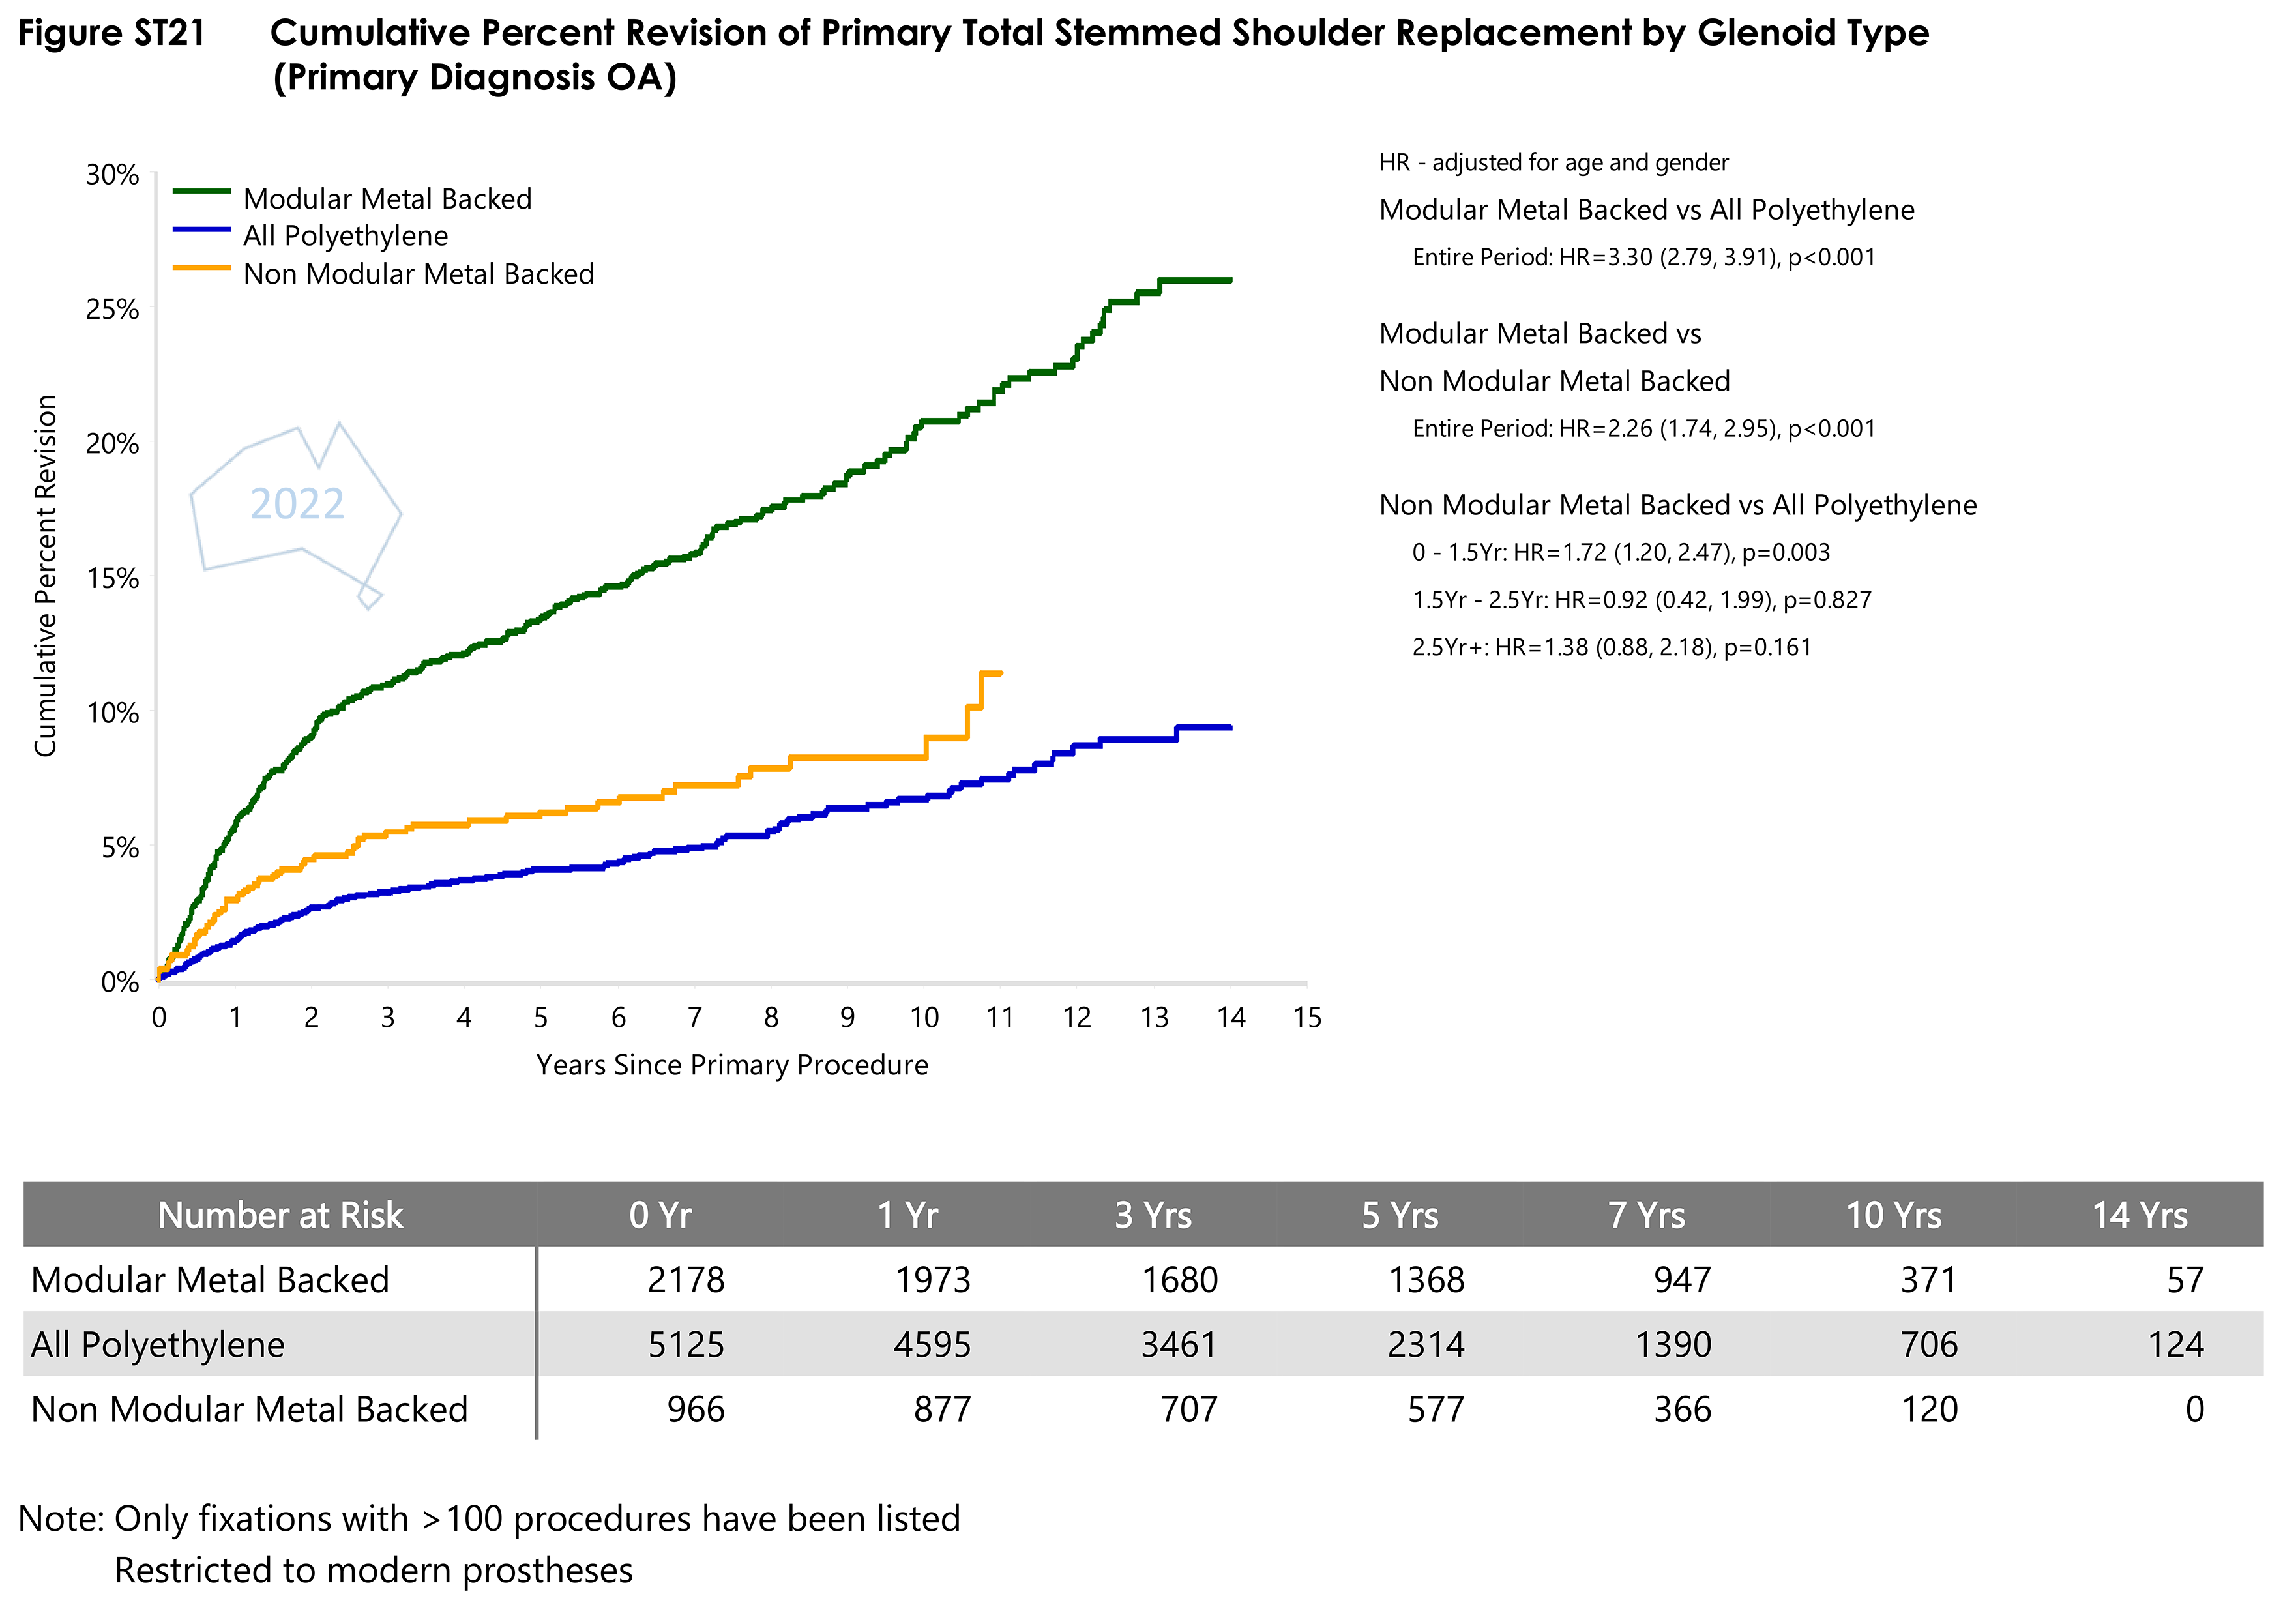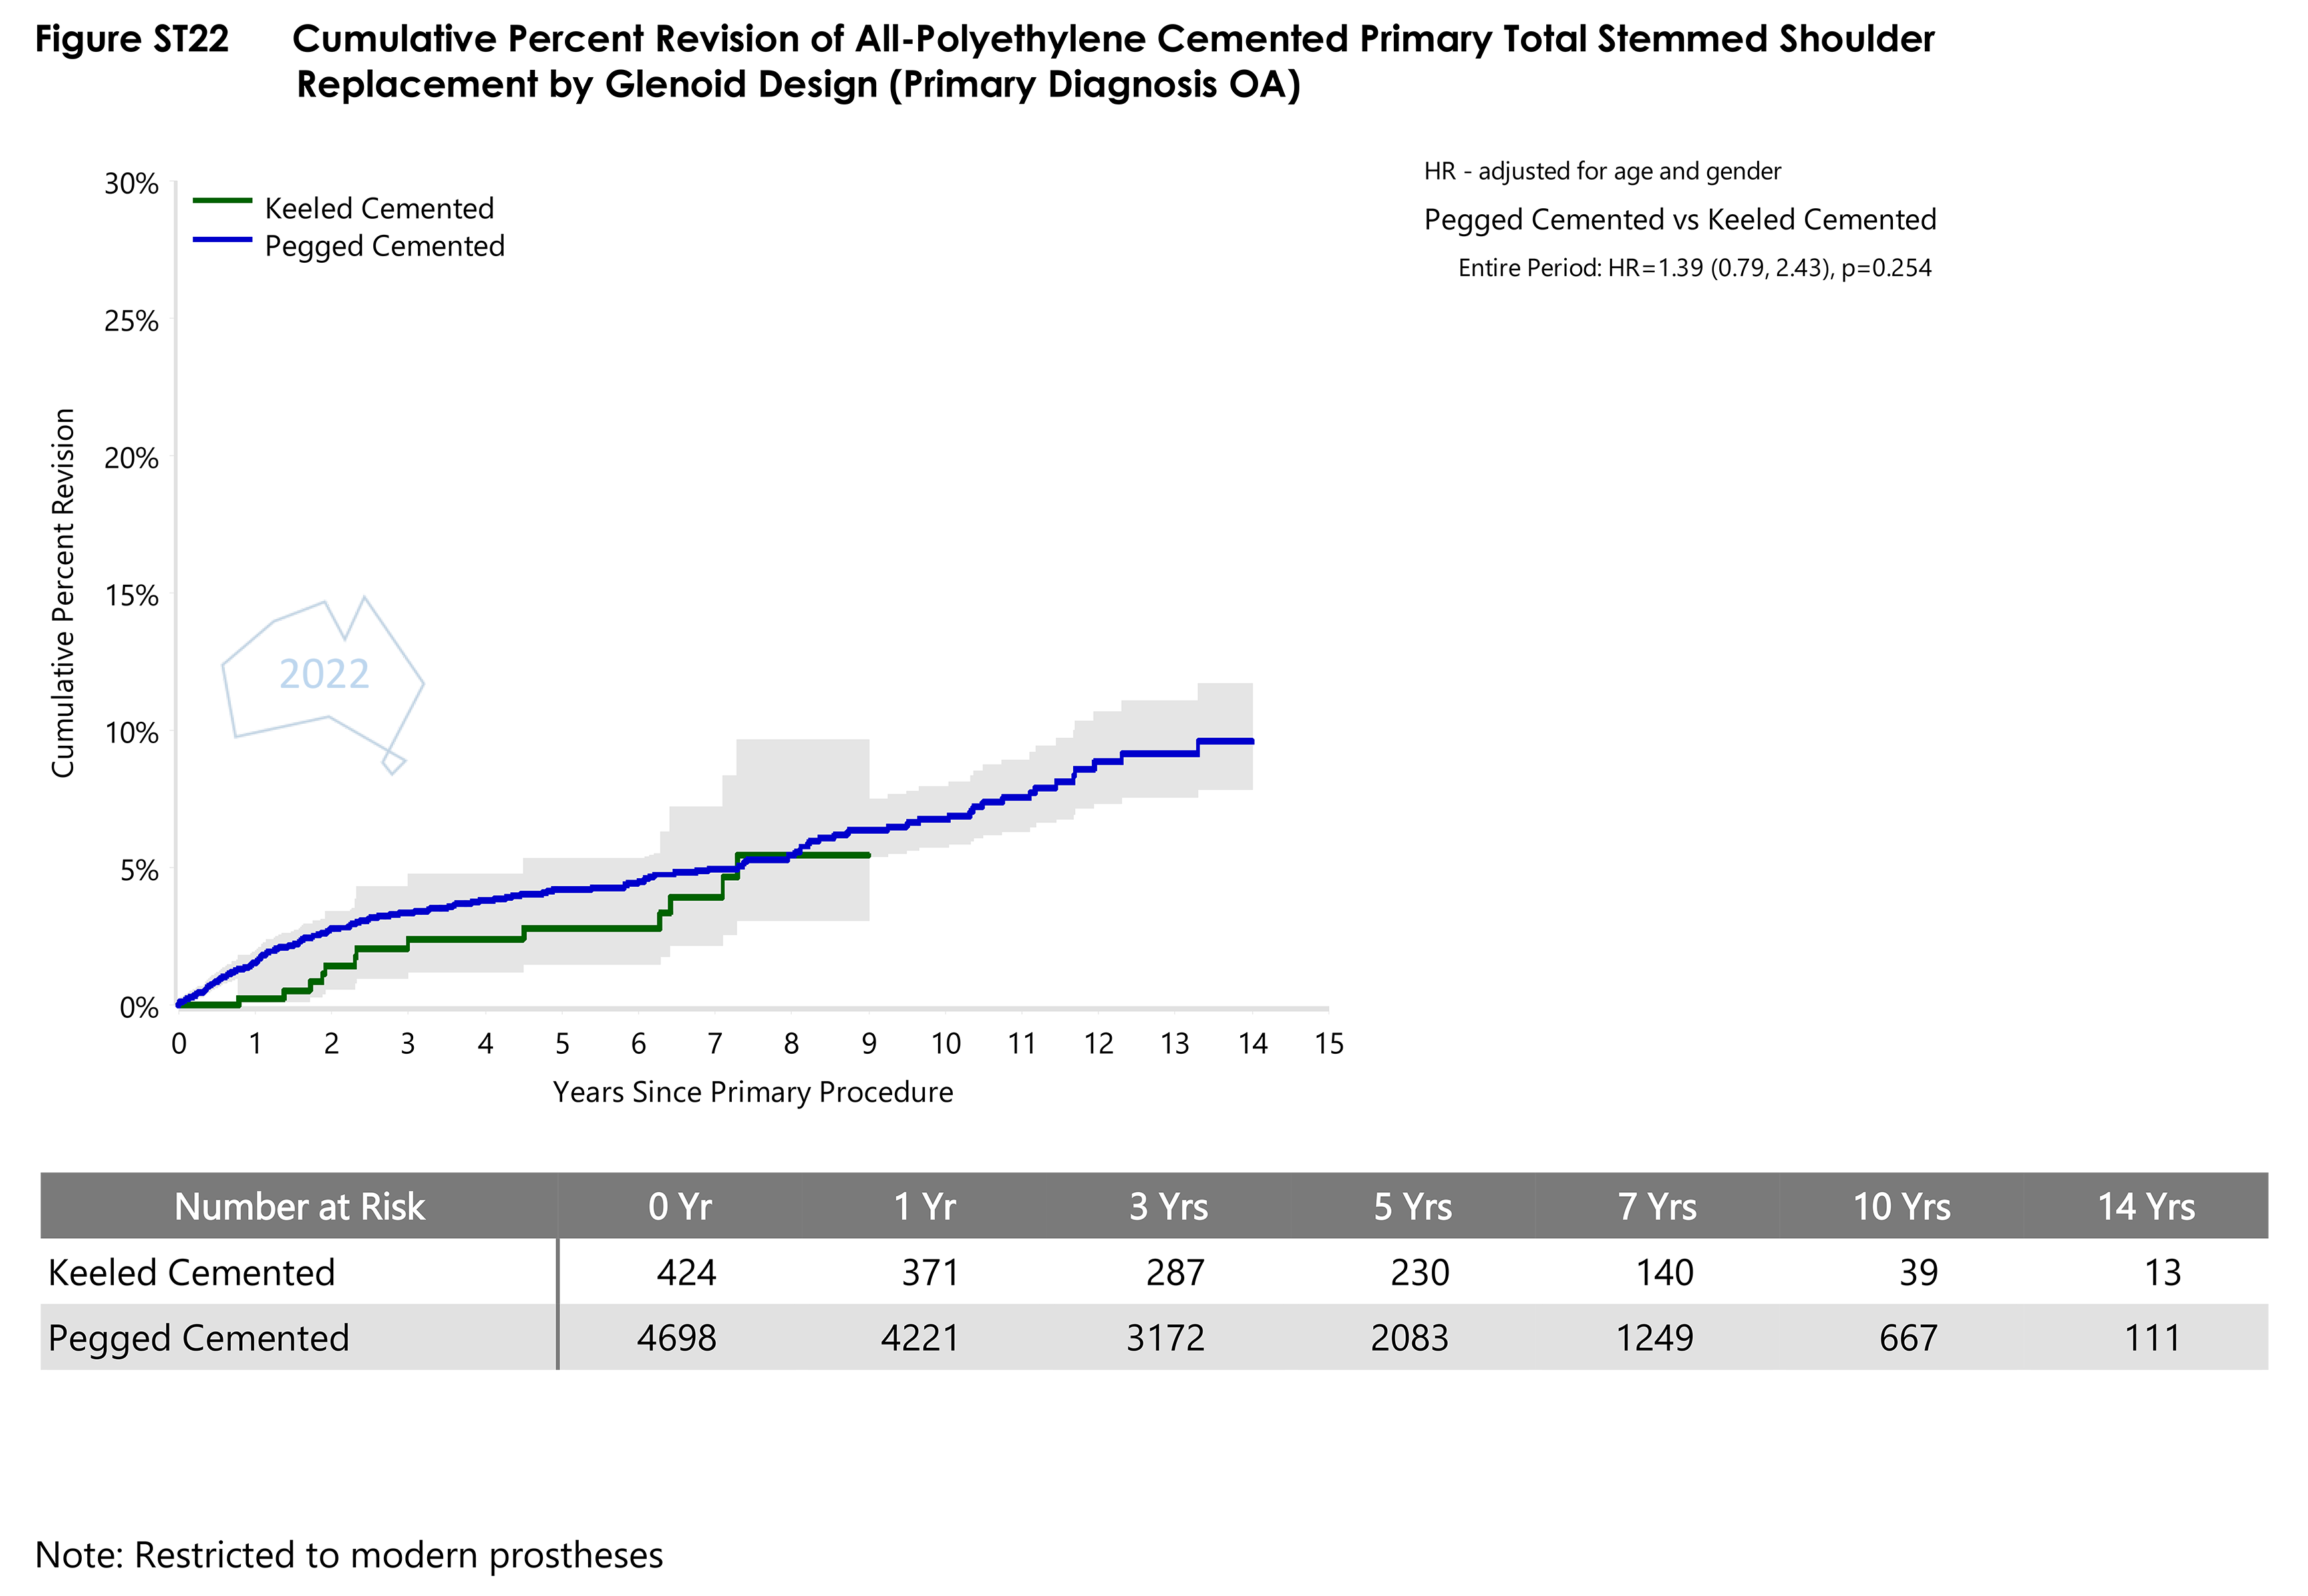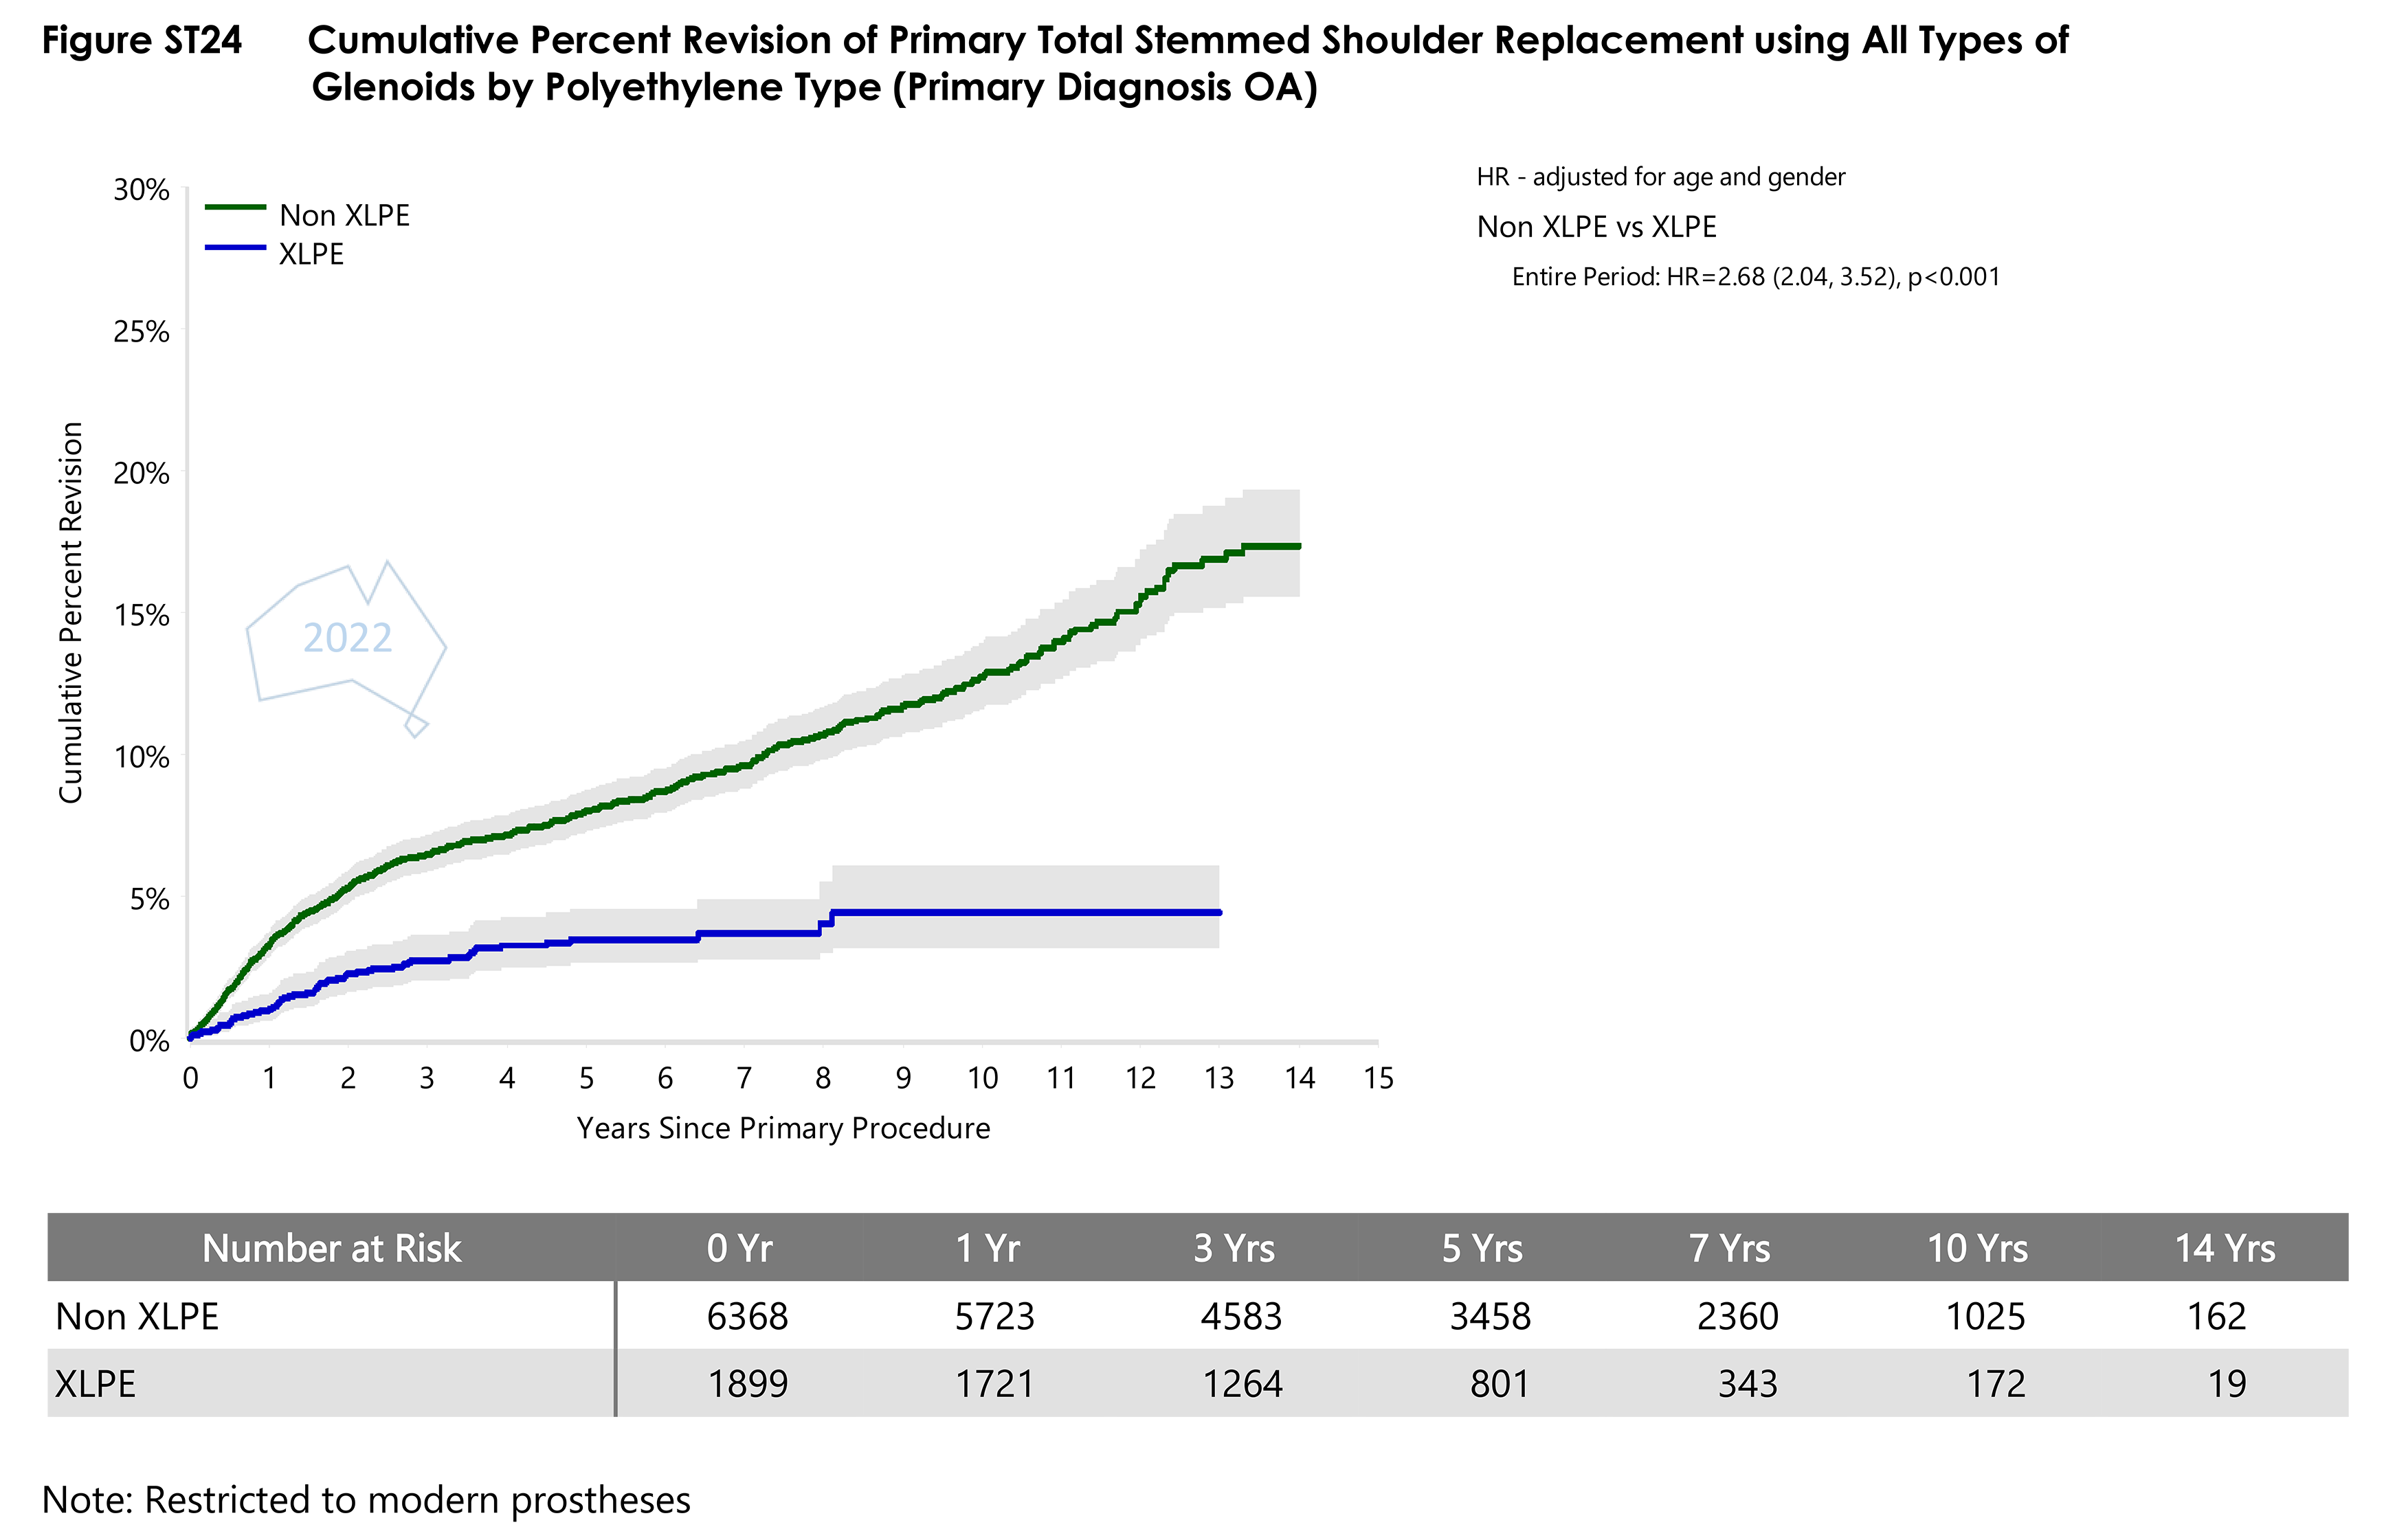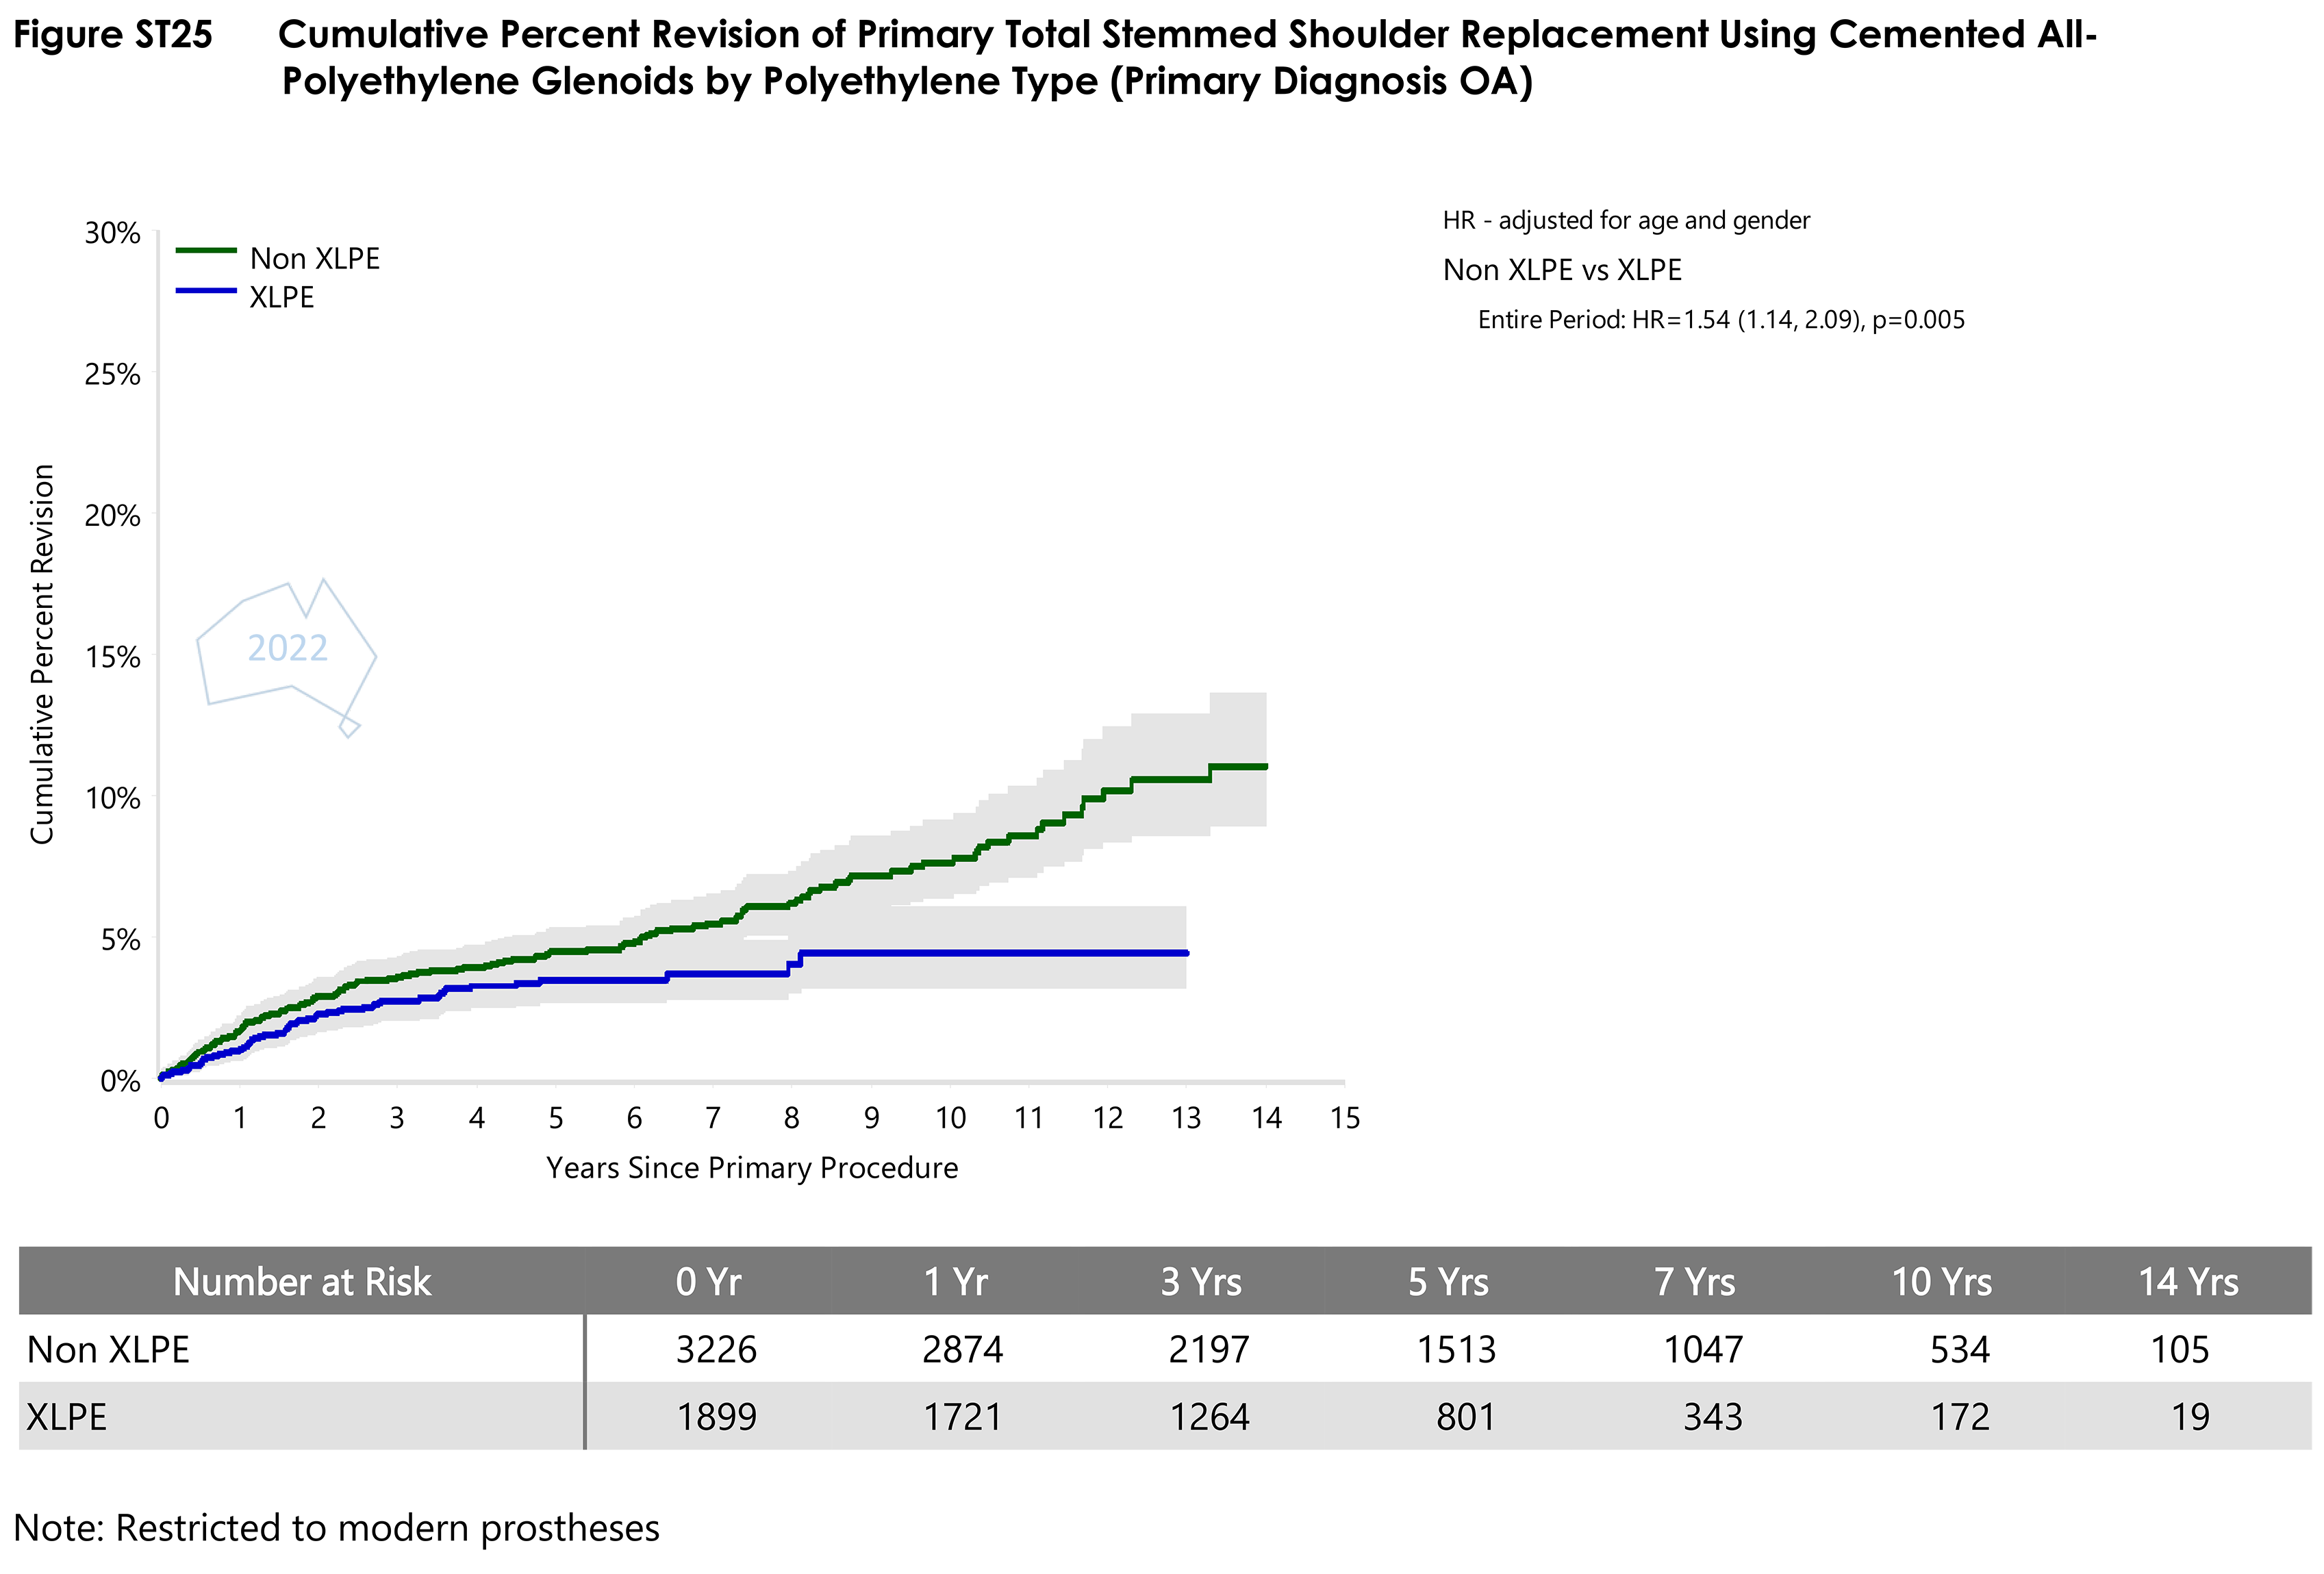
This selection of hip, knee and shoulder tables and figures from the 2022 annual report are available for download and use in presentations provided that they remain unaltered and correctly attributed to the AOANJRR.
Suggested reference:
Australian Orthopaedic Association National Joint Replacement Registry (AOANJRR). Hip, Knee & Shoulder Arthroplasty Annual Report 2022, AOA, Adelaide; 2022: 1-488. https://registry.aoa.org.au/annual-reports-2022
Further information on the AOANJRR data usage guidelines is available from the AOANJRR Data Publication and Authorship Policy.
Hips
All Hips
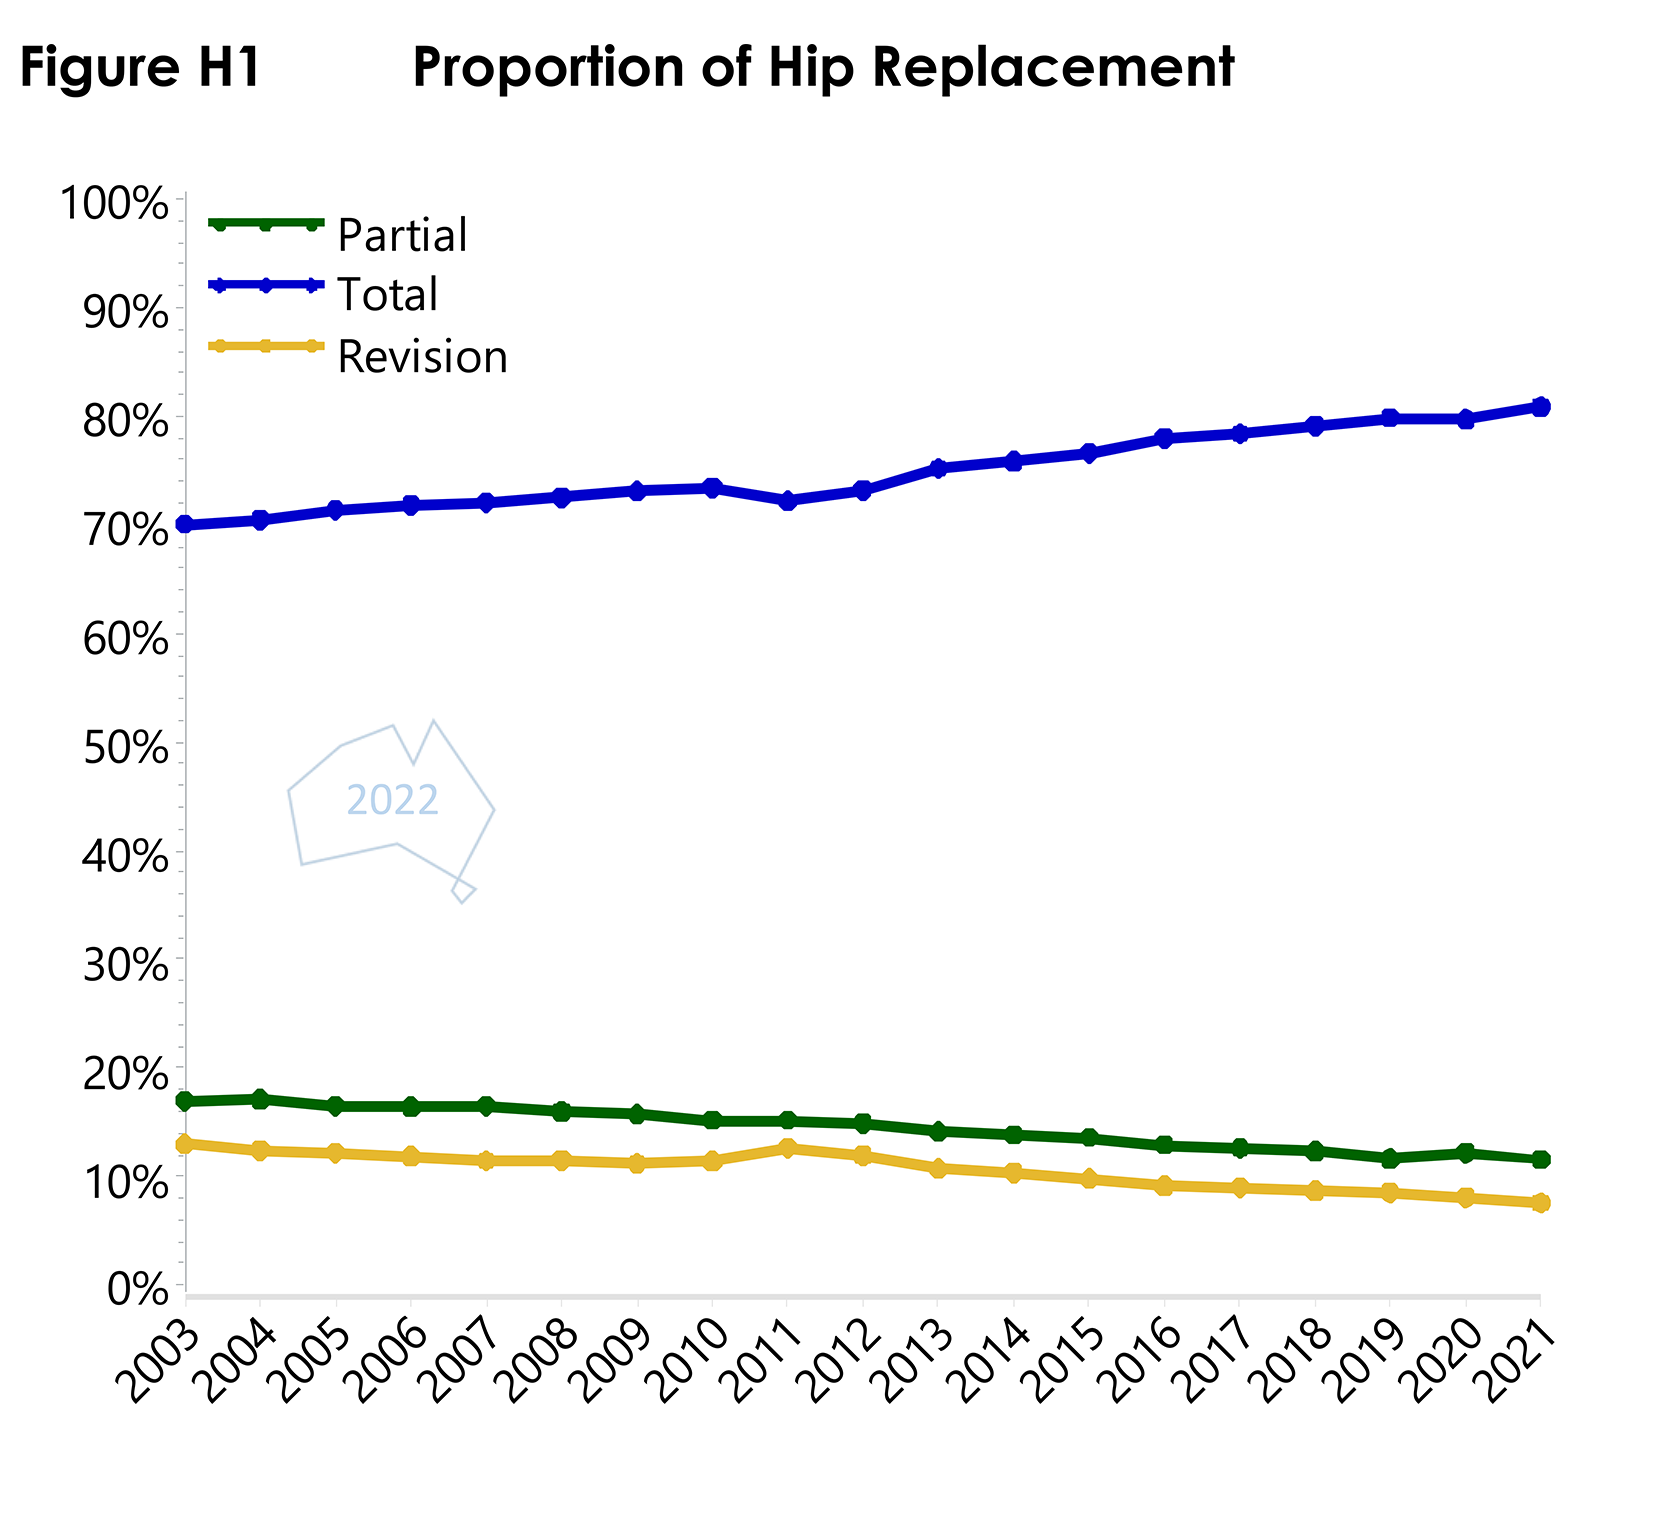
- Proportion of Hip ReplacementPDF · 63 KB
- Proportion of Hip Replacement copyPNG · 349 KB
Partial Hips
- Fig SHP8 Cumulative Percent Revision of Primary Unipolar Monoblock Hip Replacement by GenderPDF · 112 KB
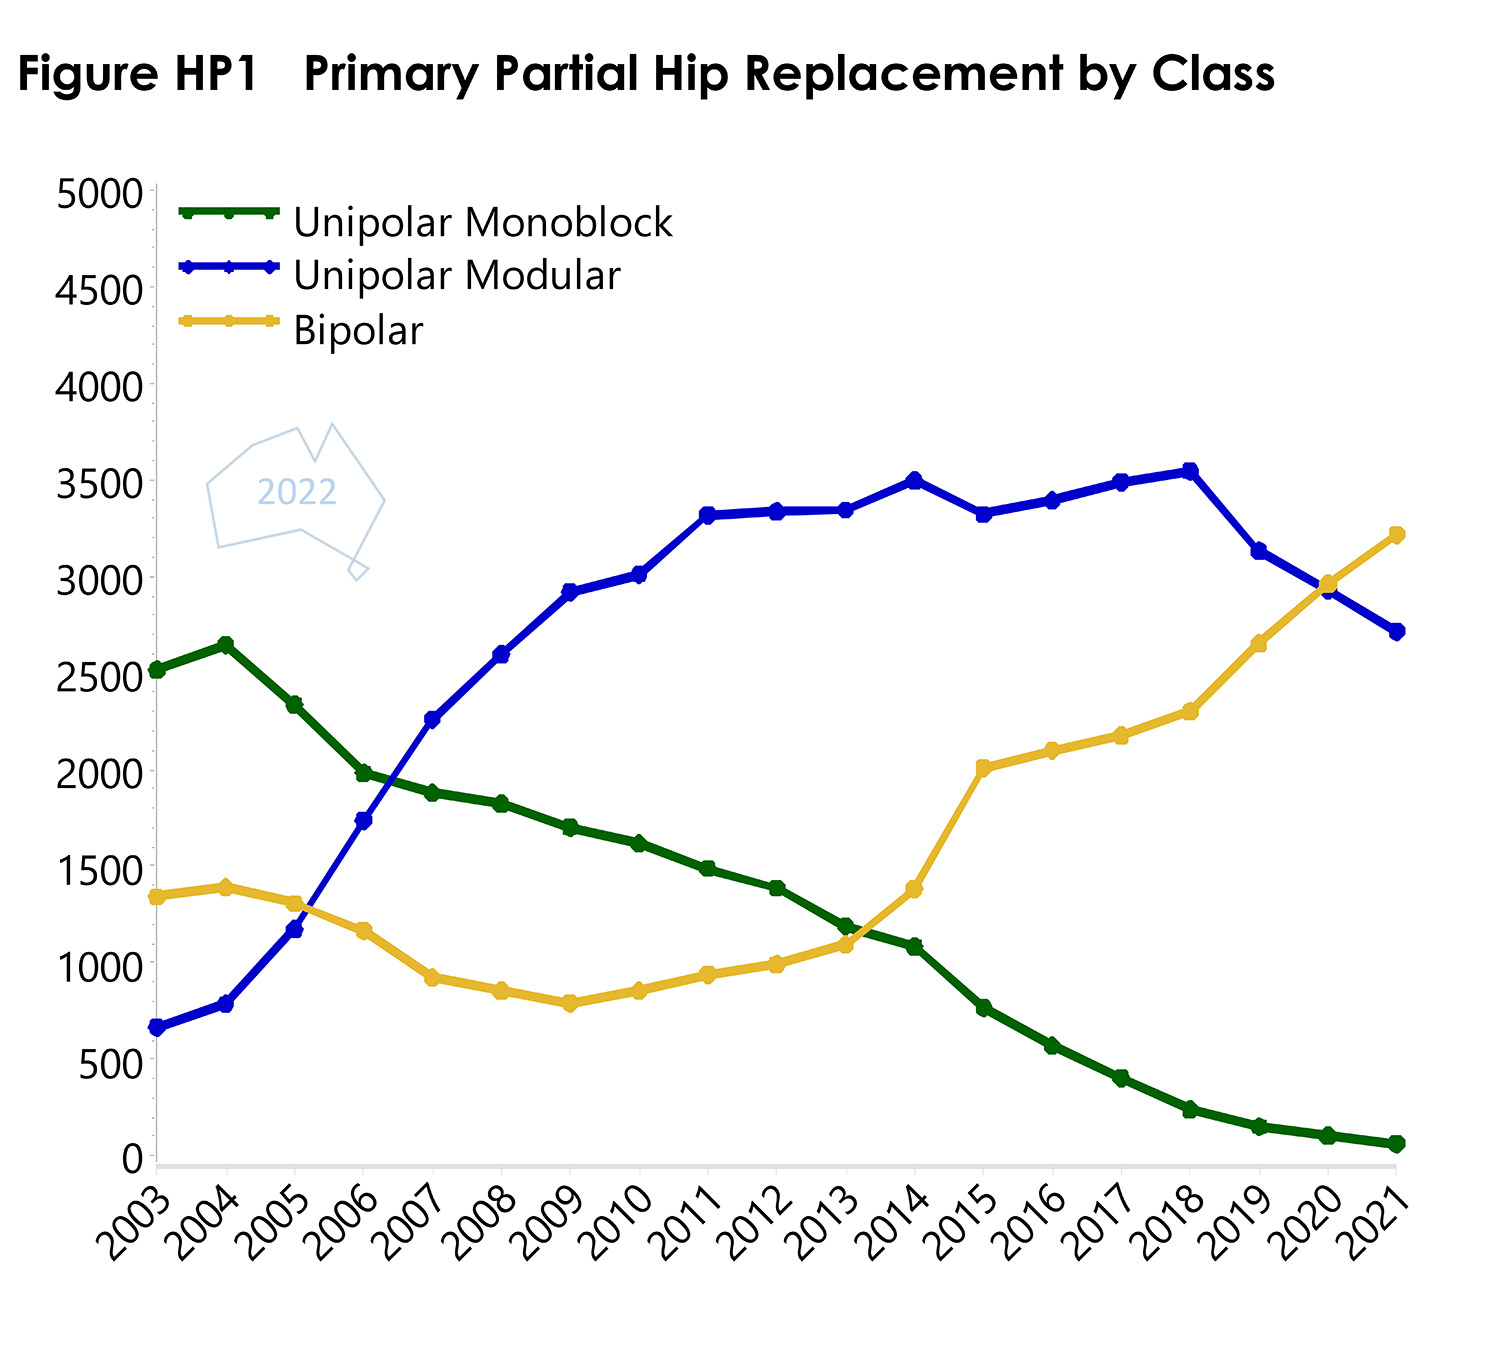
- Figure HP1 Primary Partial Hip Replacement by ClassPDF · 44 KB
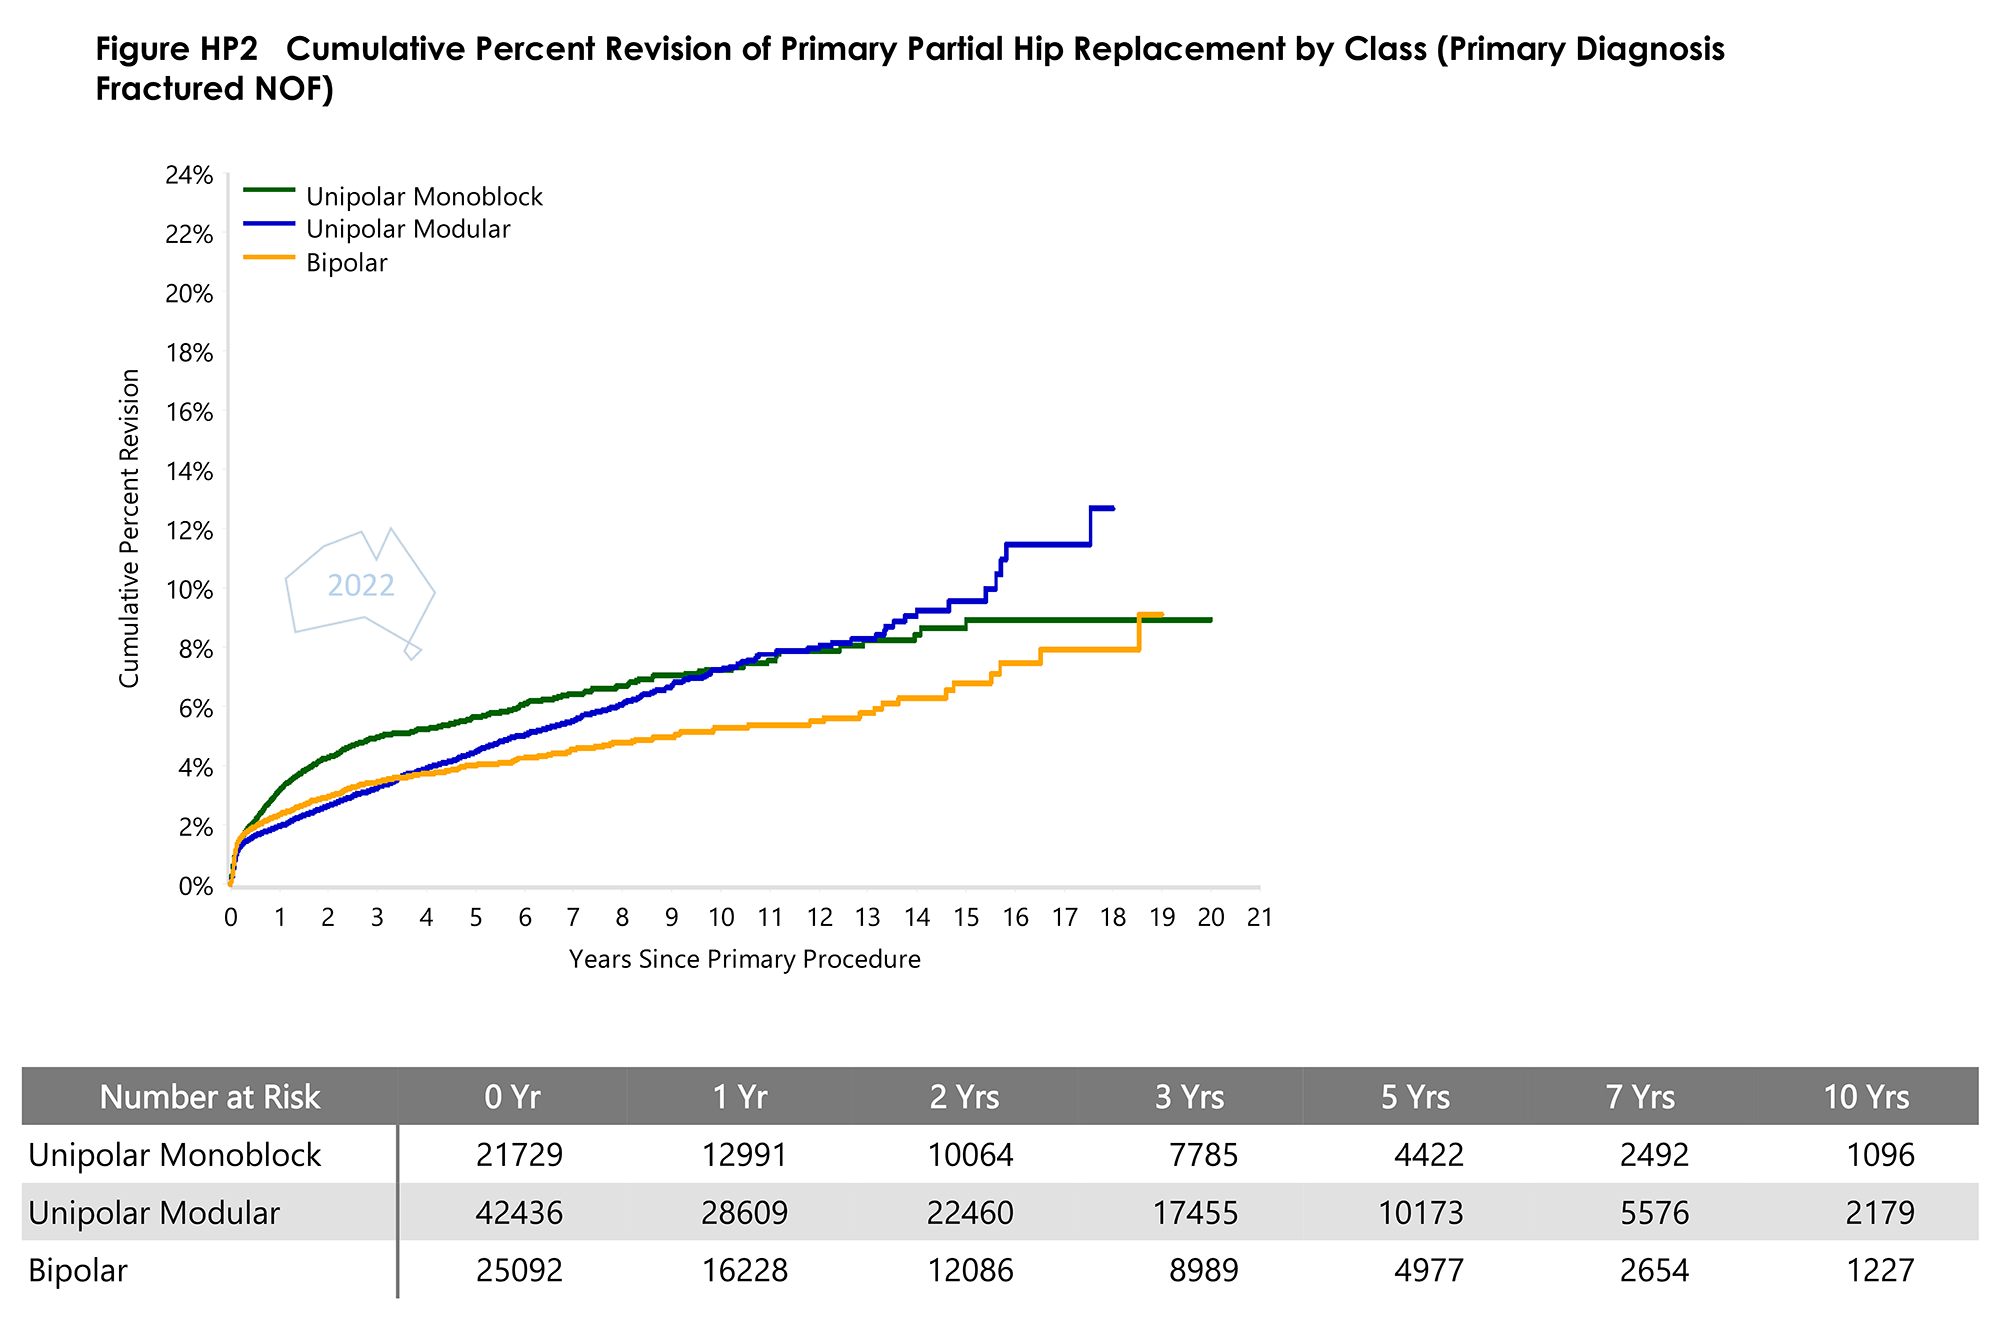
- Figure HP2 Cumulative Percent Revision of Primary Partial Hip Replacement by ClassPDF · 111 KB
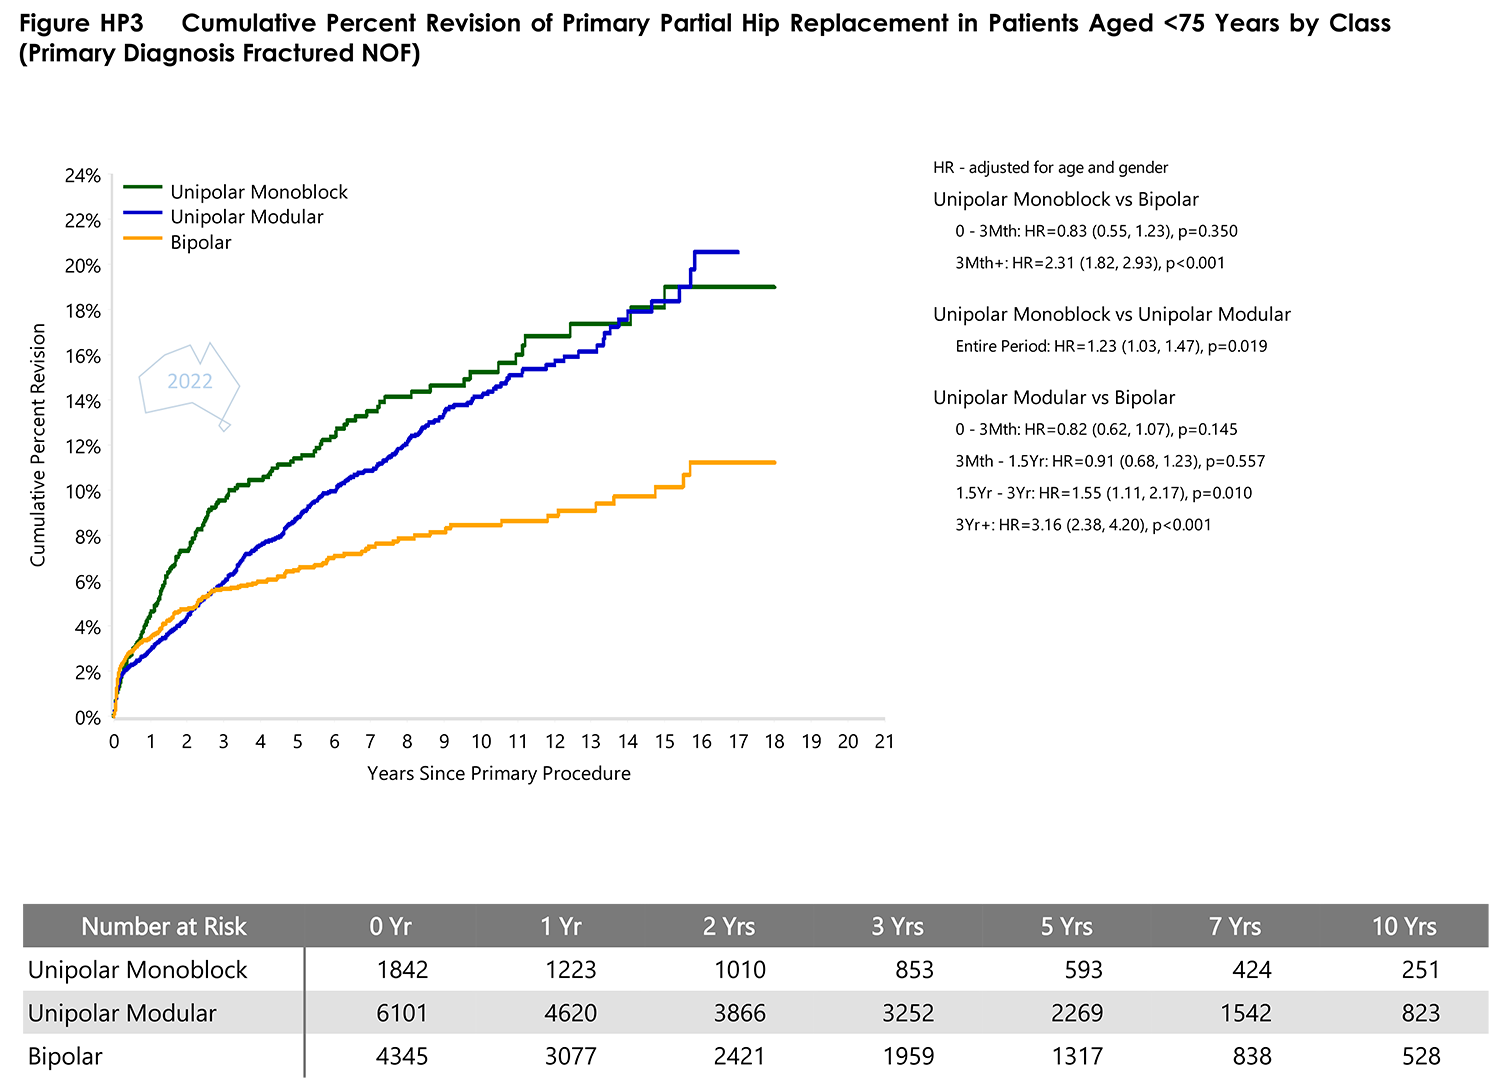
- Figure HP3 Cumulative Percent Revision of Primary Partial Hip Replacement in Patients AgedPDF · 91 KB
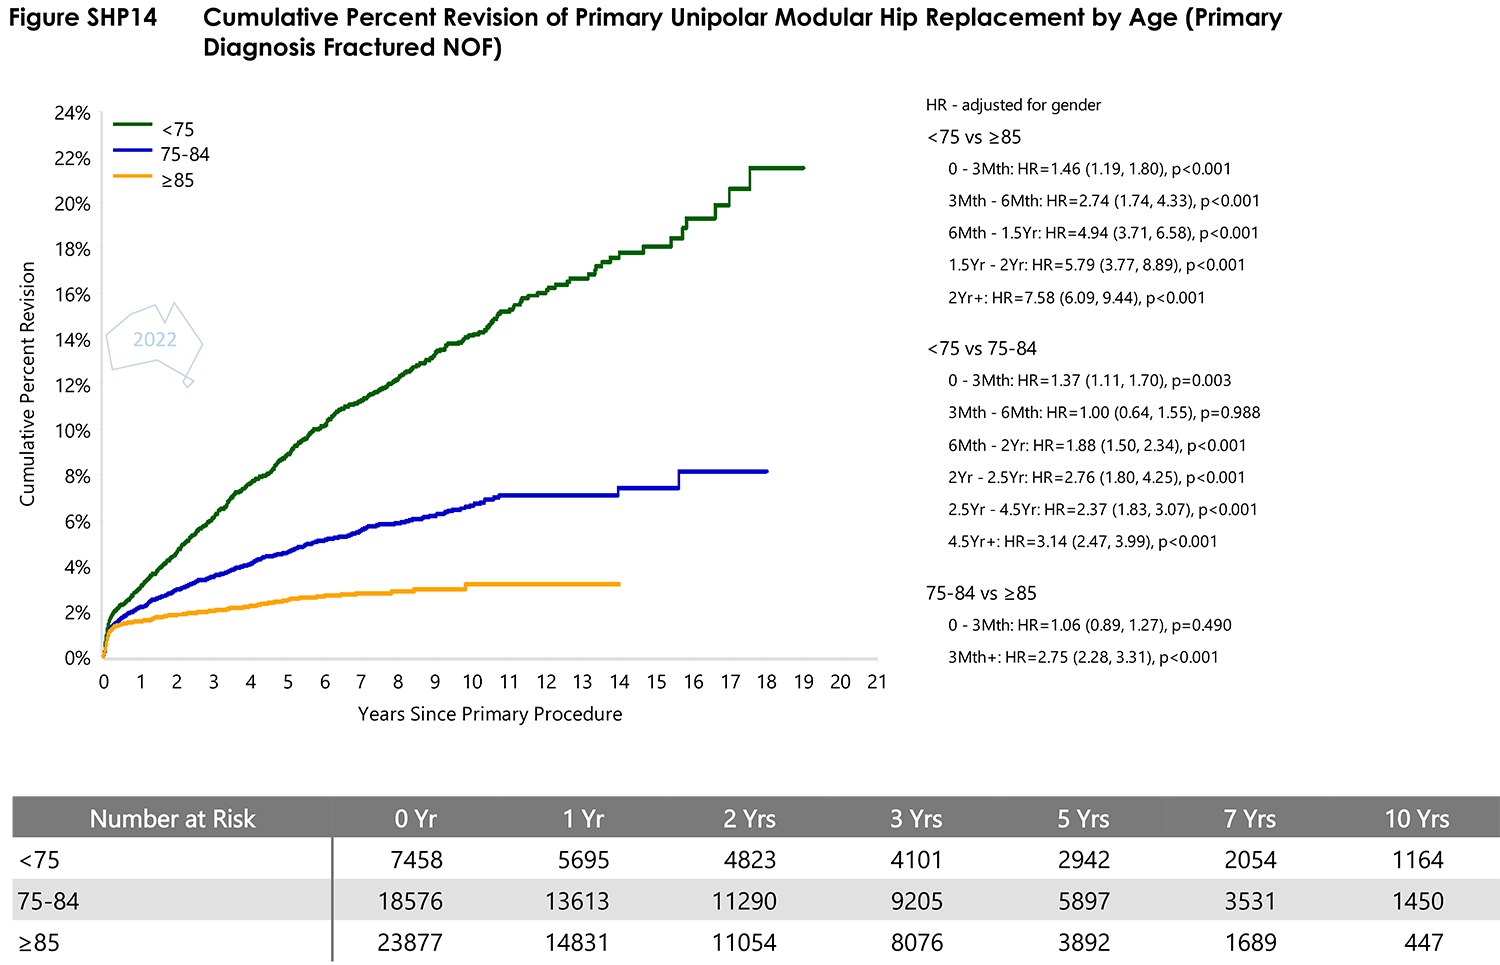
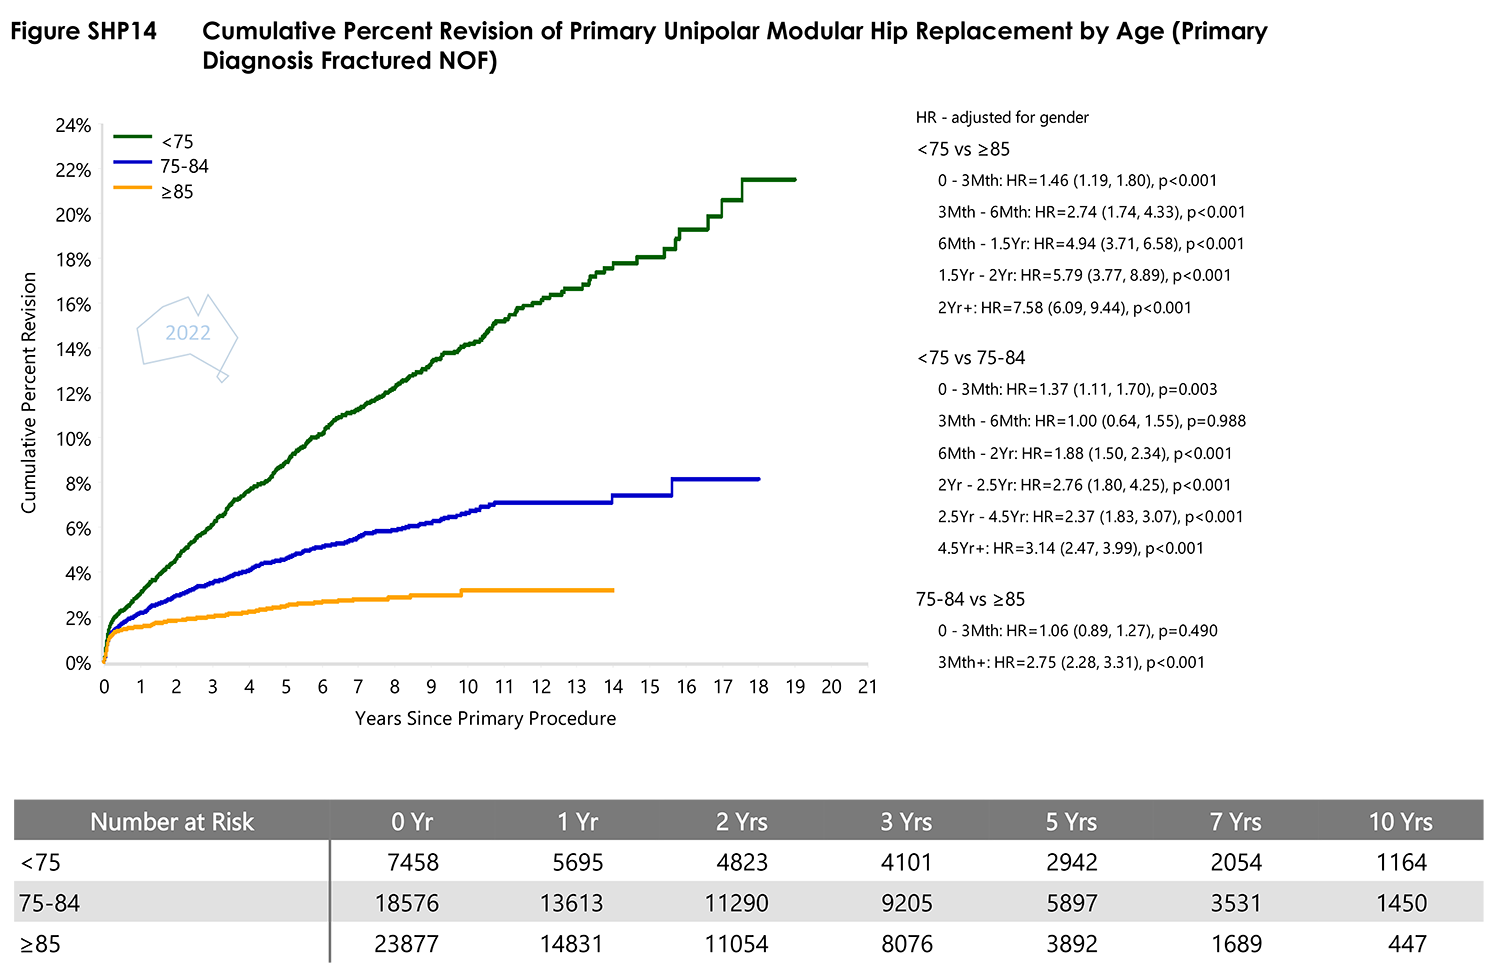
- Figure SHP14 Cumulative Percent Revision of Primary Unipolar Modular Hip Replacement by AgePDF · 113 KB
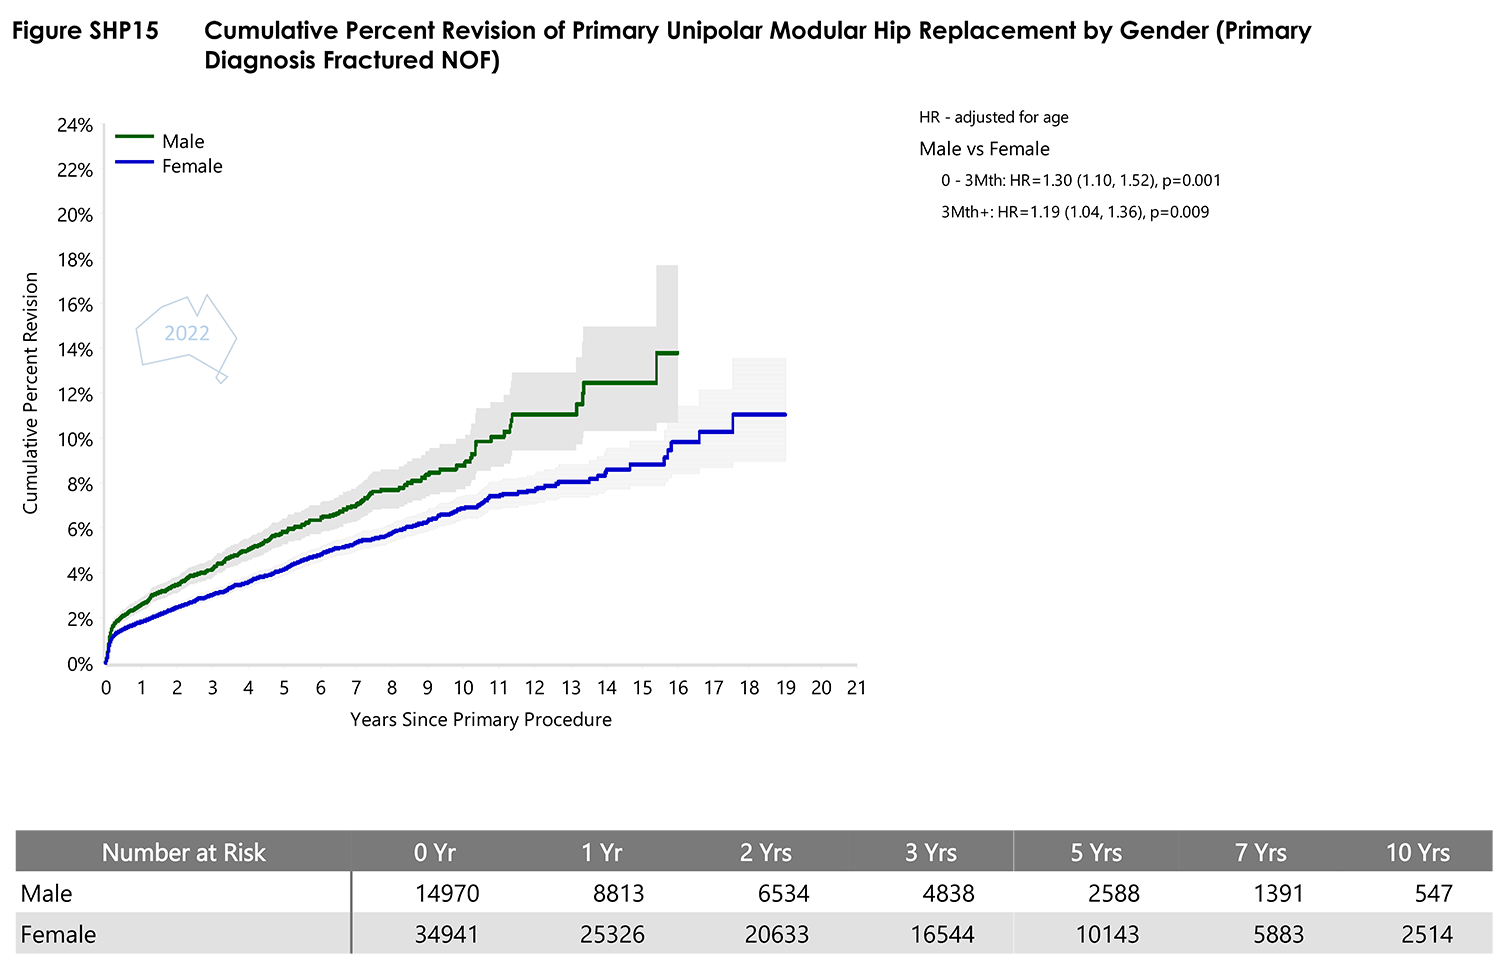
- Figure SHP15 Cumulative Percent Revision of Primary Unipolar Modular Hip Replacement by GenderPDF · 111 KB
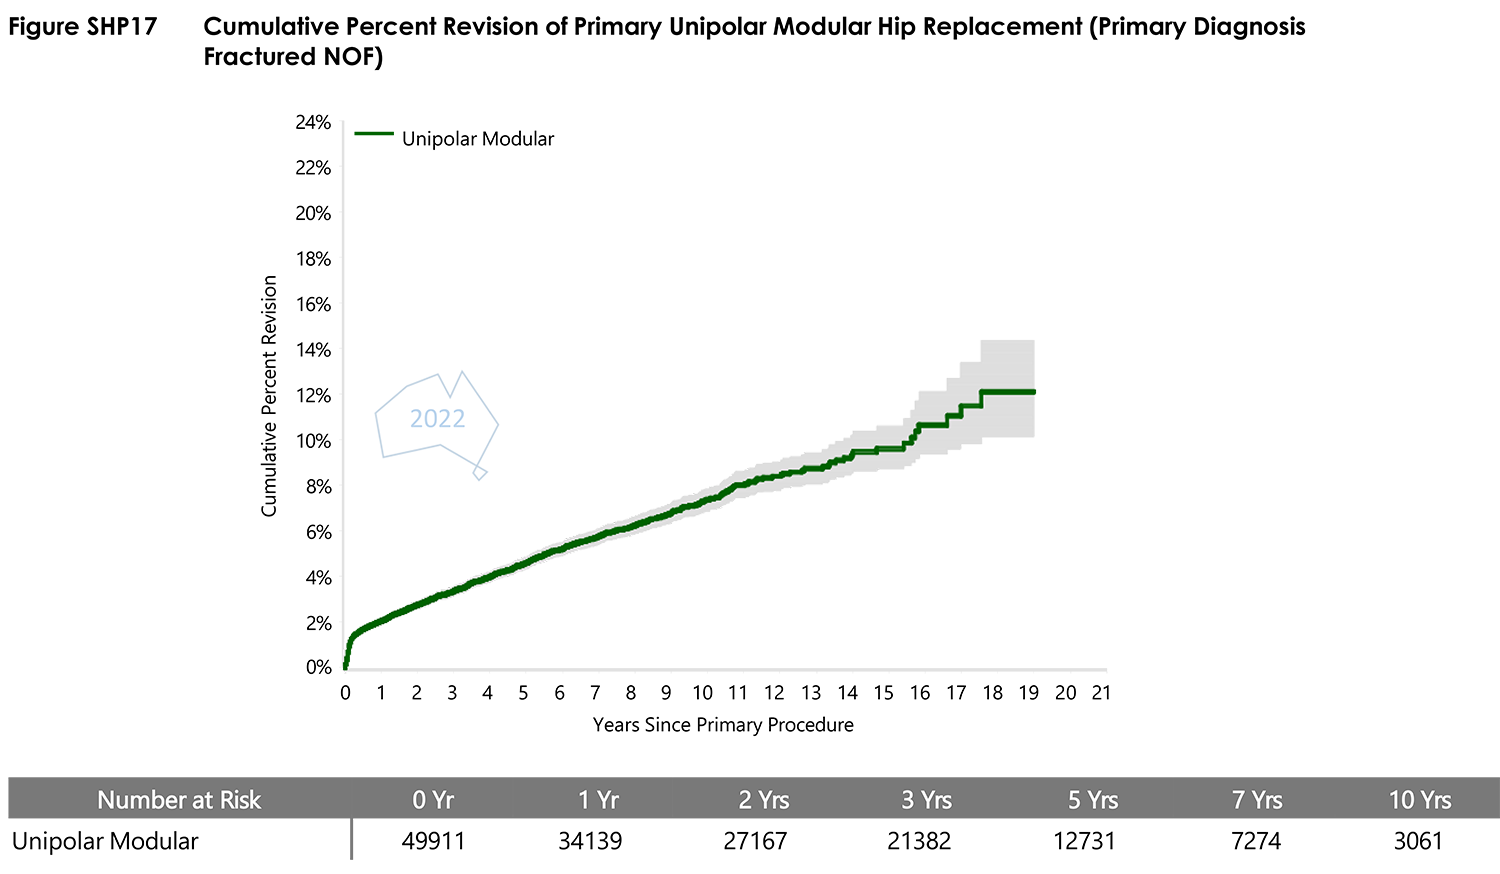
- Figure SHP17 Cumulative Percent Revision of Primary Unipolar Modular Hip ReplacementPDF · 60 KB
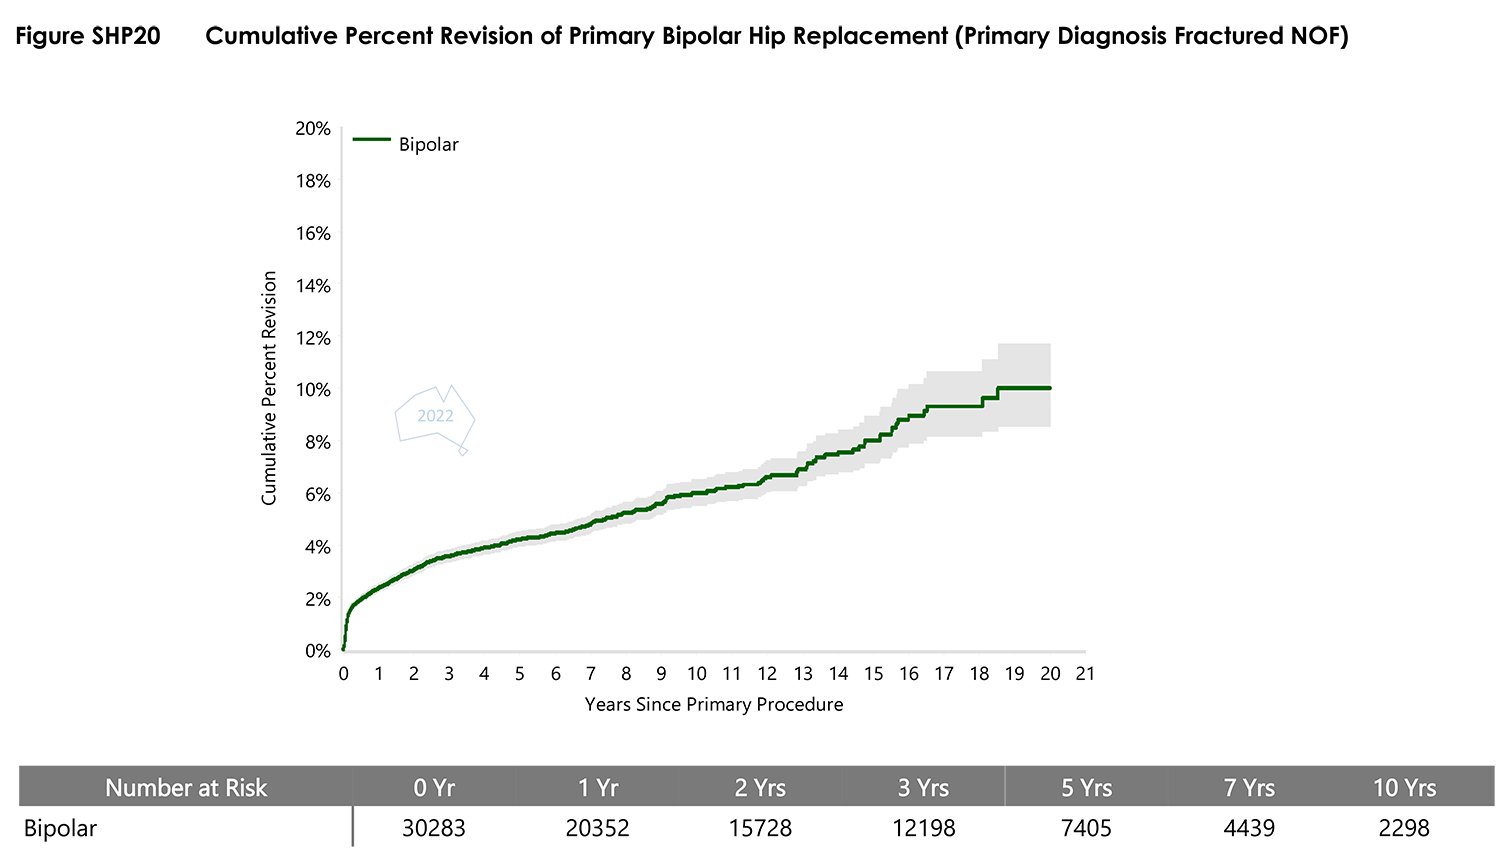
- Figure SHP20 Cumulative Percent Revision of Primary Bipolar Hip Replacement (Primary Diagnosis Fractured NOF)PDF · 89 KB
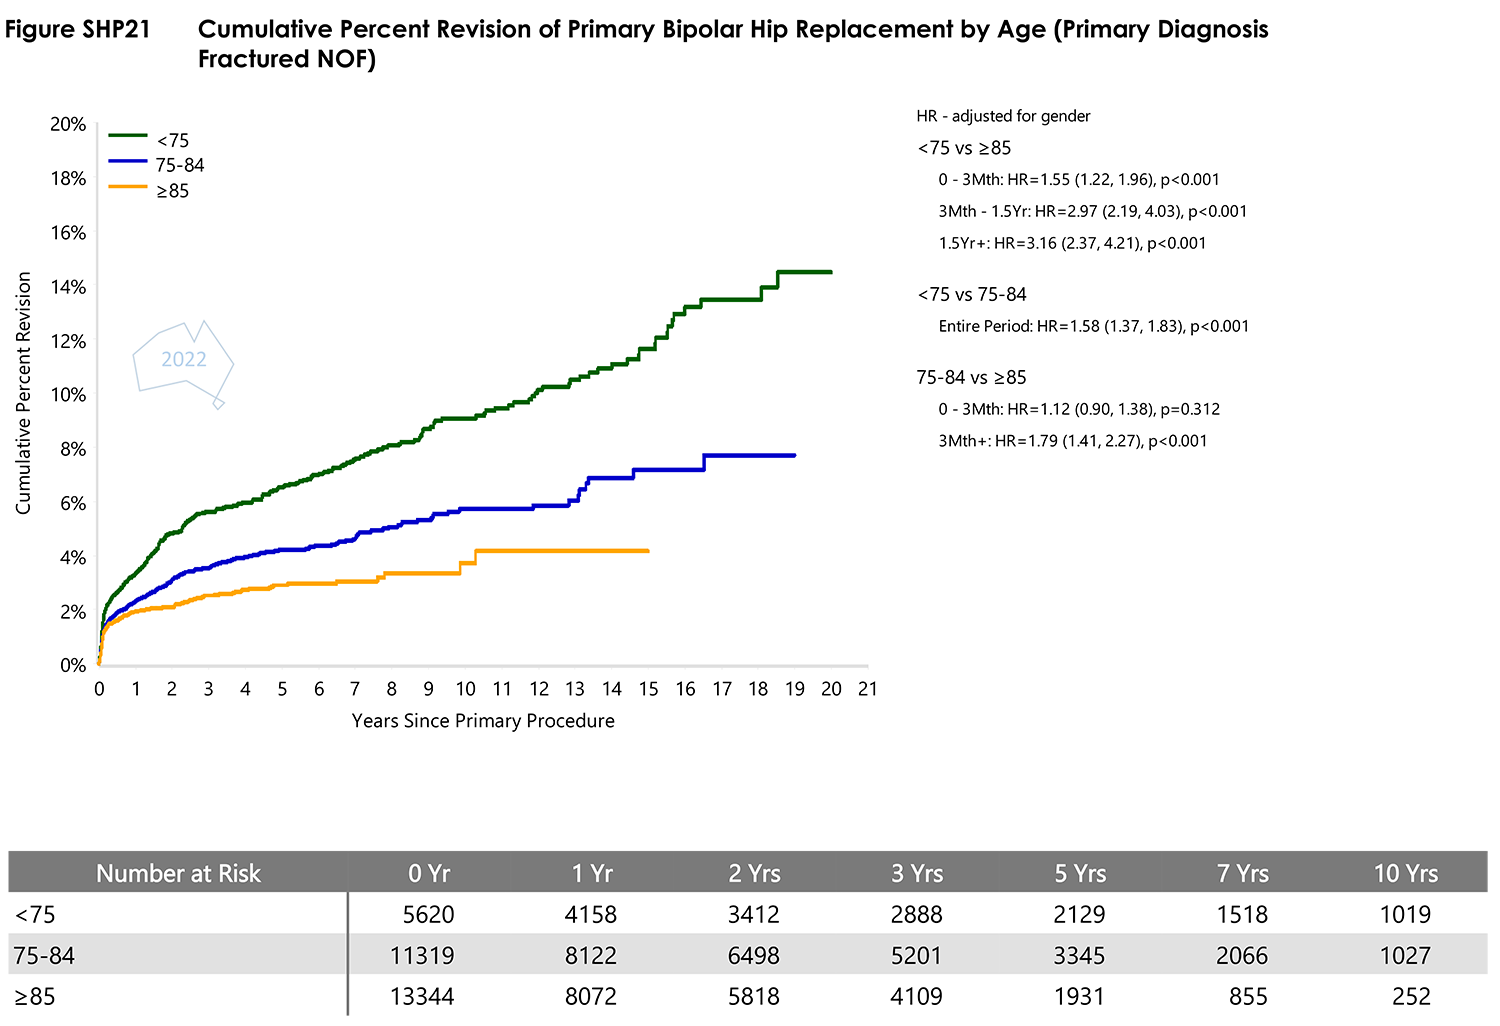
- Figure SHP21 Cumulative Percent Revision of Primary Bipolar Hip Replacement by Age (Primary Diagnosis Fractured NOF)PDF · 86 KB
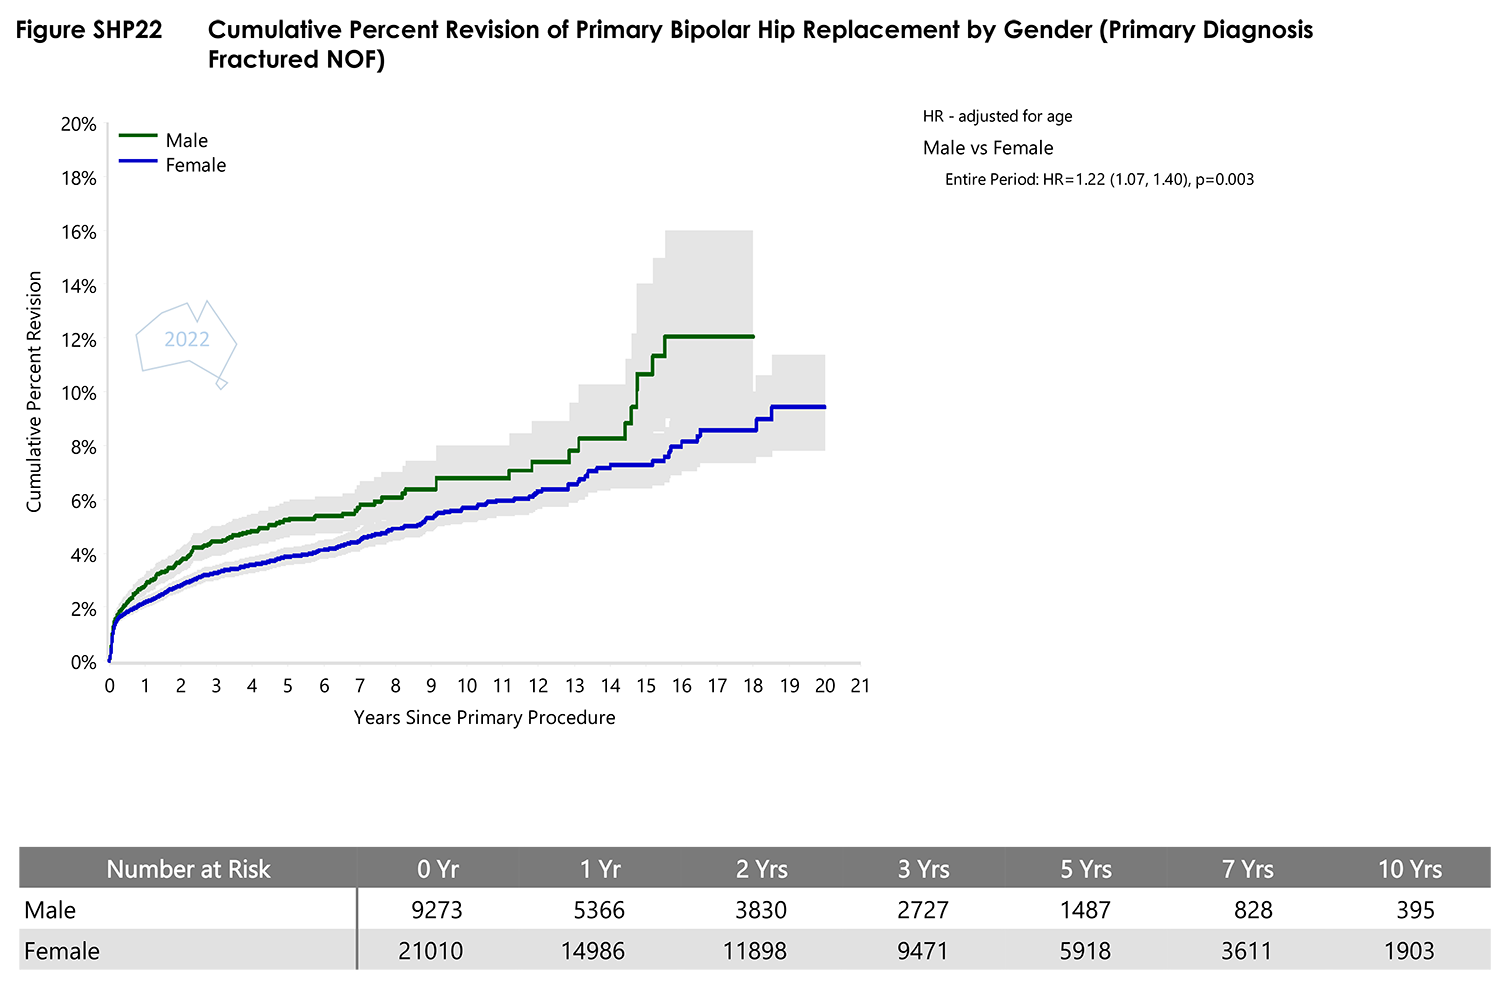
- Figure SHP22 Cumulative Percent Revision of Primary Bipolar Hip Replacement by Gender (Primary Diagnosis Fractured NOF)PDF · 92 KB
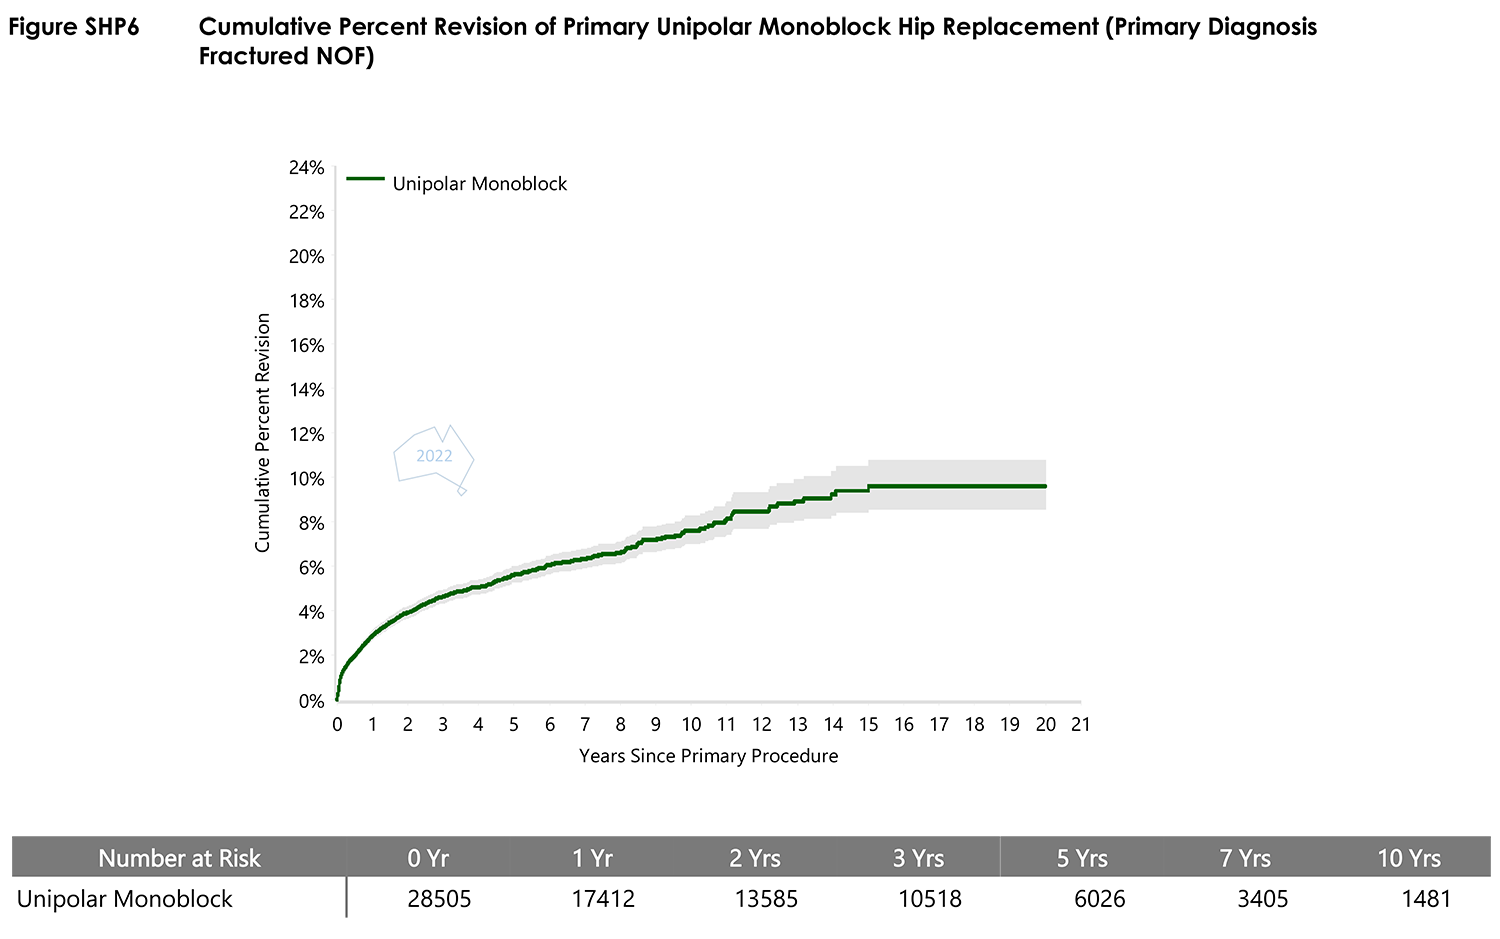
- SHP6 Cumulative Percent Revision of Primary Unipolar Monoblock Hip ReplacementPDF · 80 KB
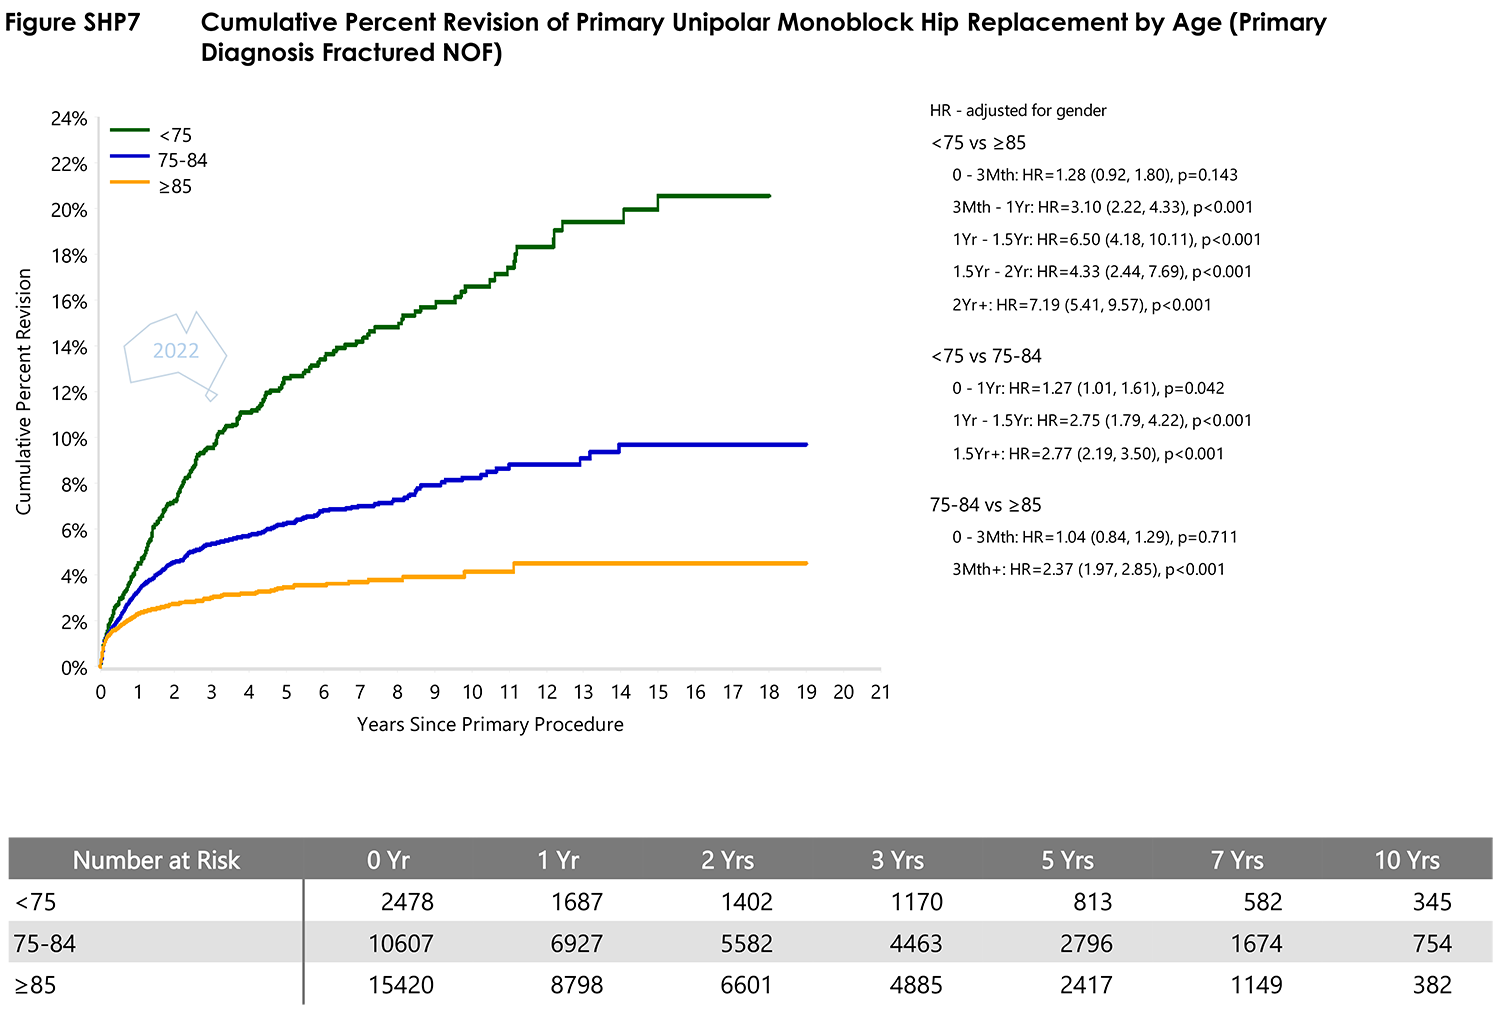
- SHP7 Cumulative Percent Revision of Primary Unipolar Monoblock Hip Replacement by AgePDF · 89 KB
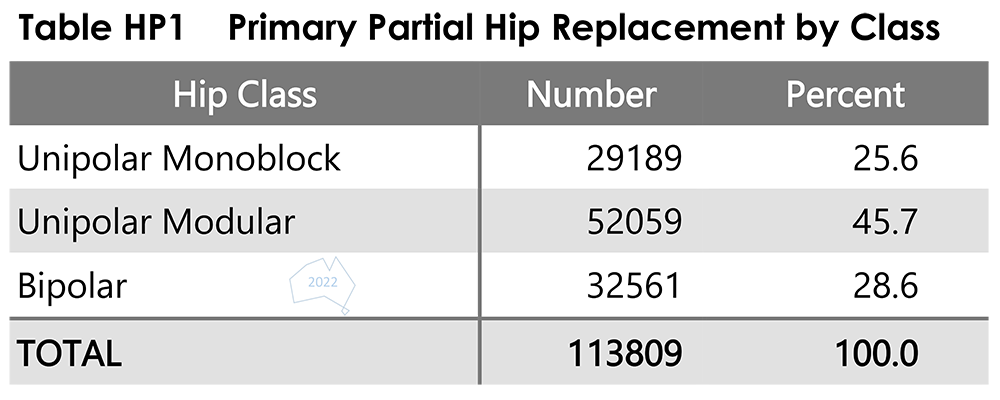
- Table HP1 Primary Partial Hip Replacement by ClassPDF · 71 KB
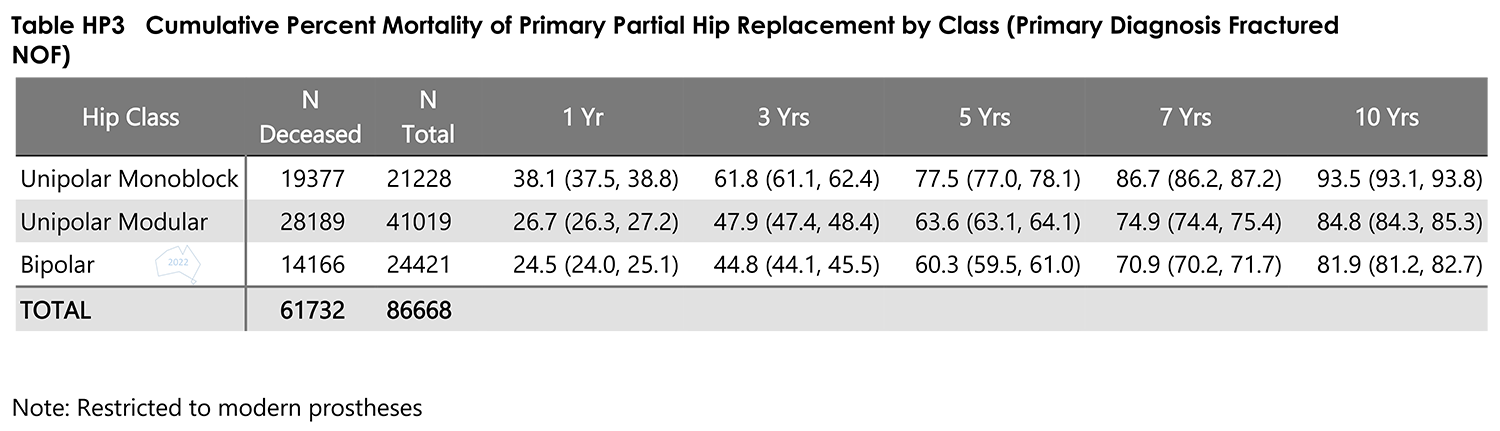
- Table HP3 Cumulative Percent Mortality of Primary Partial Hip Replacement by ClassPDF · 67 KB
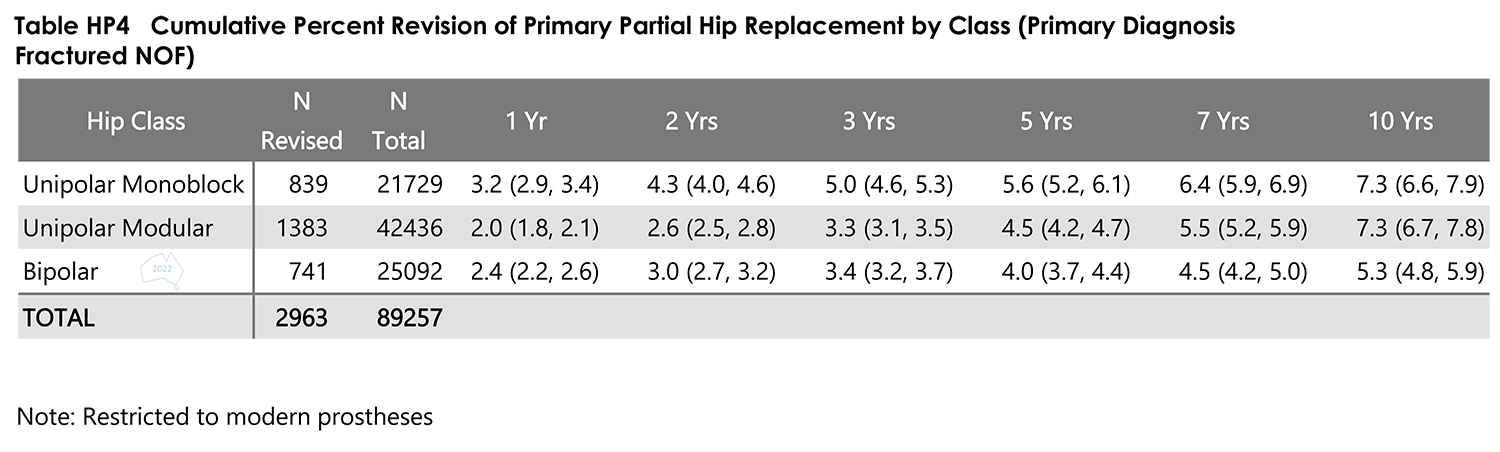
- Table HP4 Cumulative Percent Revision of Primary Partial Hip Replacement by ClassPDF · 78 KB
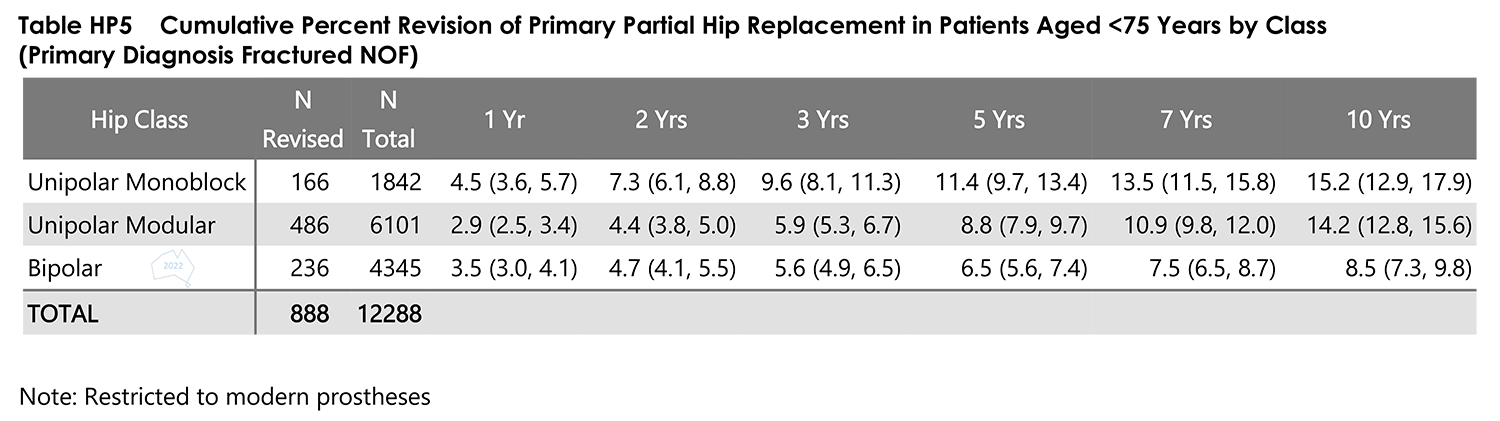
- Table HP5 Cumulative Percent Revision of Primary Partial Hip Replacement in Patients Aged less than 75 Years by ClassPDF · 68 KB
PNG
- Fig SHP8 Cumulative Percent Revision of Primary Unipolar Monoblock Hip Replacement by GenderPNG · 338 KB
- Figure HP1 Primary Partial Hip Replacement by ClassPNG · 402 KB
- Figure HP2 Cumulative Percent Revision of Primary Partial Hip Replacement by ClassPNG · 357 KB
- Figure HP3 Cumulative Percent Revision of Primary Partial Hip Replacement in Patients AgedPNG · 338 KB
- Figure SHP14 Cumulative Percent Revision of Primary Unipolar Modular Hip Replacement by AgePNG · 339 KB
- Figure SHP15 Cumulative Percent Revision of Primary Unipolar Modular Hip Replacement by Gender copyPNG · 284 KB
- Figure SHP17 Cumulative Percent Revision of Primary Unipolar Modular Hip ReplacementDOCX · 22 KB
- Figure SHP17 Cumulative Percent Revision of Primary Unipolar Modular Hip Replacement copyPNG · 182 KB
- Figure SHP20 Cumulative Percent Revision of Primary Bipolar Hip Replacement (Primary Diagnosis Fractured NOF)PNG · 185 KB
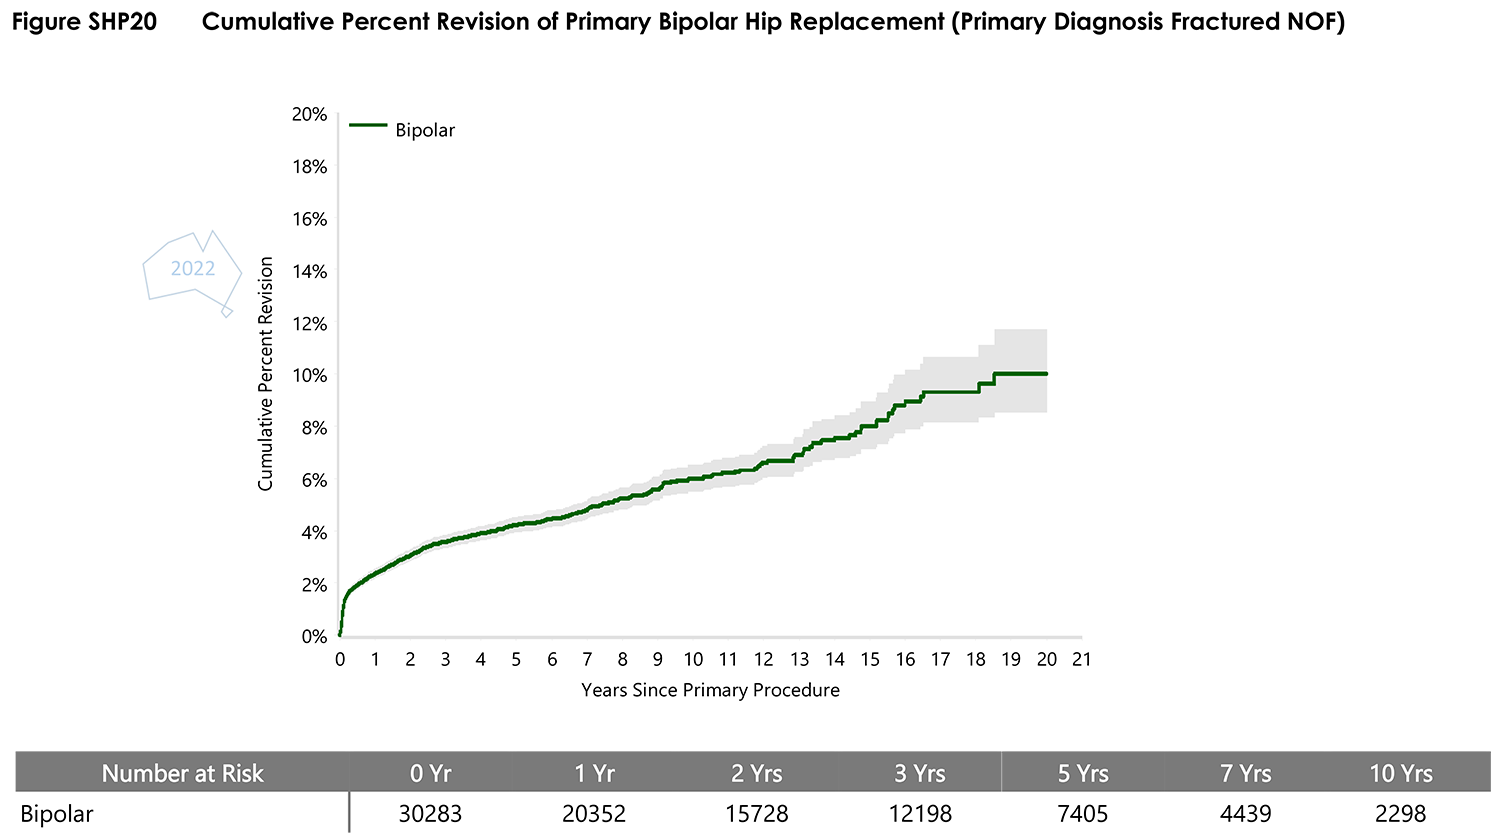
- Figure SHP20 Cumulative Percent Revision of Primary Bipolar Hip Replacement (Primary Diagnosis Fractured NOF) copyPNG · 185 KB
- Figure SHP21 Cumulative Percent Revision of Primary Bipolar Hip Replacement by Age (Primary Diagnosis Fractured NOF) copyPNG · 280 KB
- Figure SHP22 Cumulative Percent Revision of Primary Bipolar Hip Replacement by Gender (Primary Diagnosis Fractured NOF) copyPNG · 258 KB
- SHP6 Cumulative Percent Revision of Primary Unipolar Monoblock Hip Replacement copyPNG · 186 KB
- SHP7 Cumulative Percent Revision of Primary Unipolar Monoblock Hip Replacement by Age copyPNG · 312 KB
- Table HP1 Primary Partial Hip Replacement by ClassPNG · 116 KB
- Table HP3 Cumulative Percent Mortality of Primary Partial Hip Replacement by ClassPNG · 208 KB
- Table HP4 Cumulative Percent Revision of Primary Partial Hip Replacement by Class copyPNG · 204 KB
- Table HP5 Cumulative Percent Revision of Primary Partial Hip Replacement in Patients Aged less than 75 Years by Class copyPNG · 210 KB
Total Hips
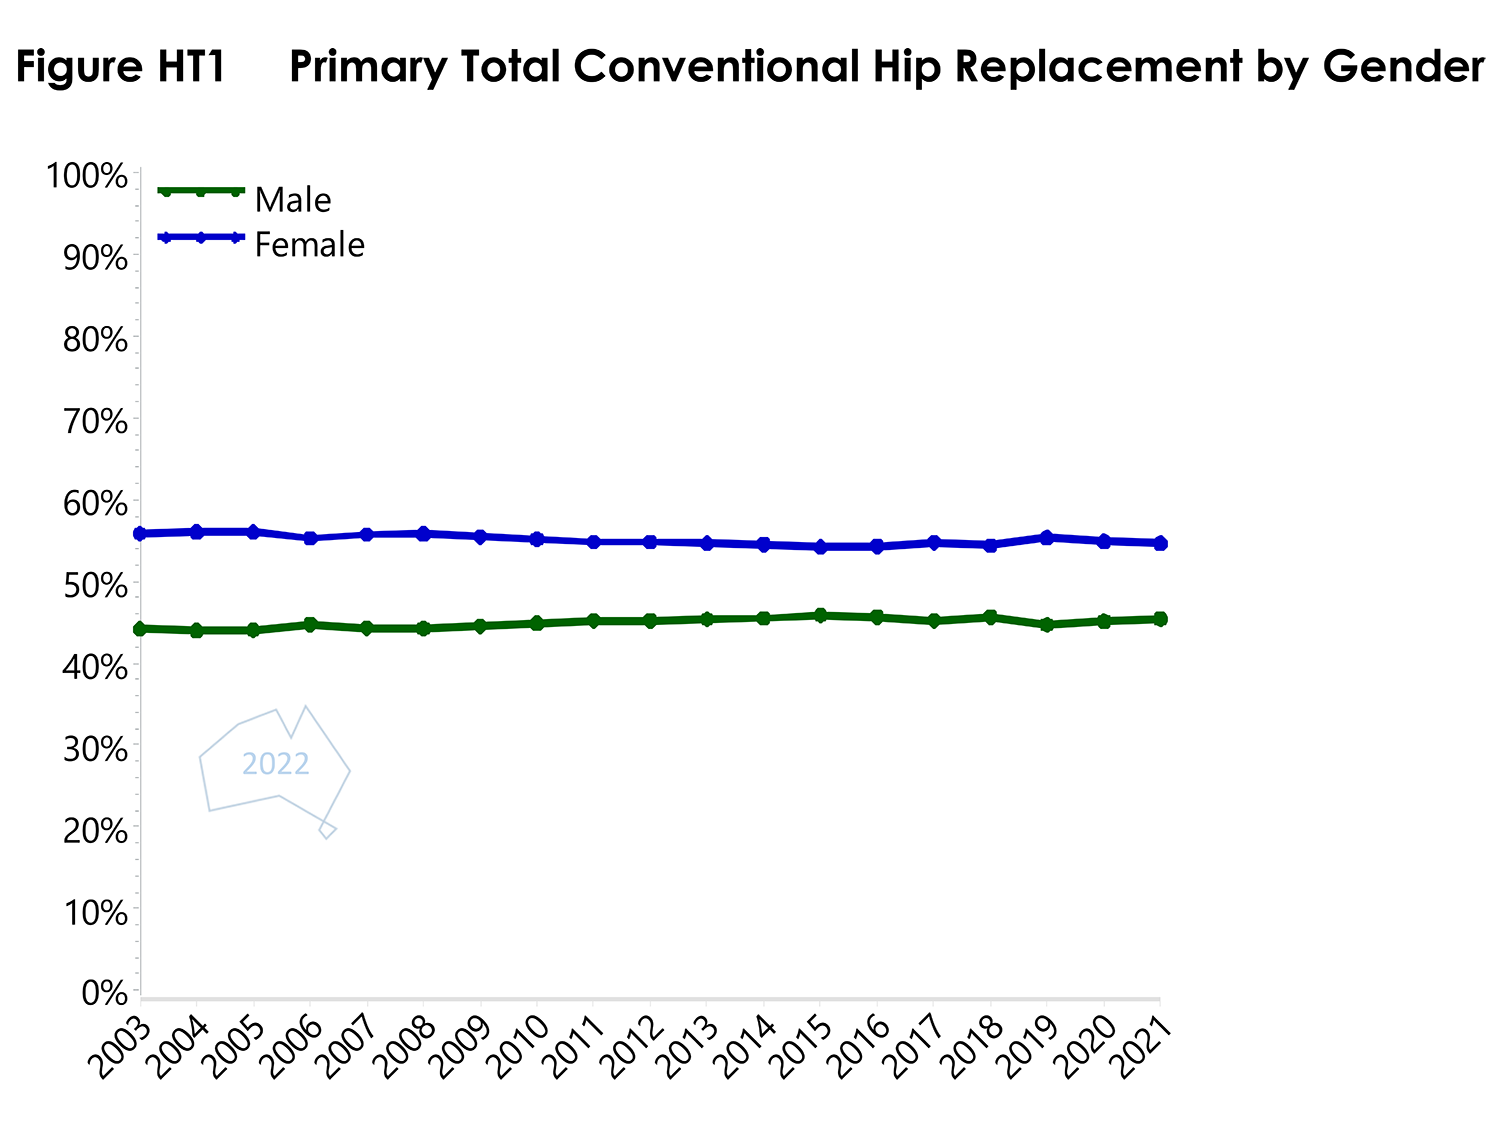
- Figure HT1 Primary Total Conventional Hip Replacement by GenderPDF · 60 KB
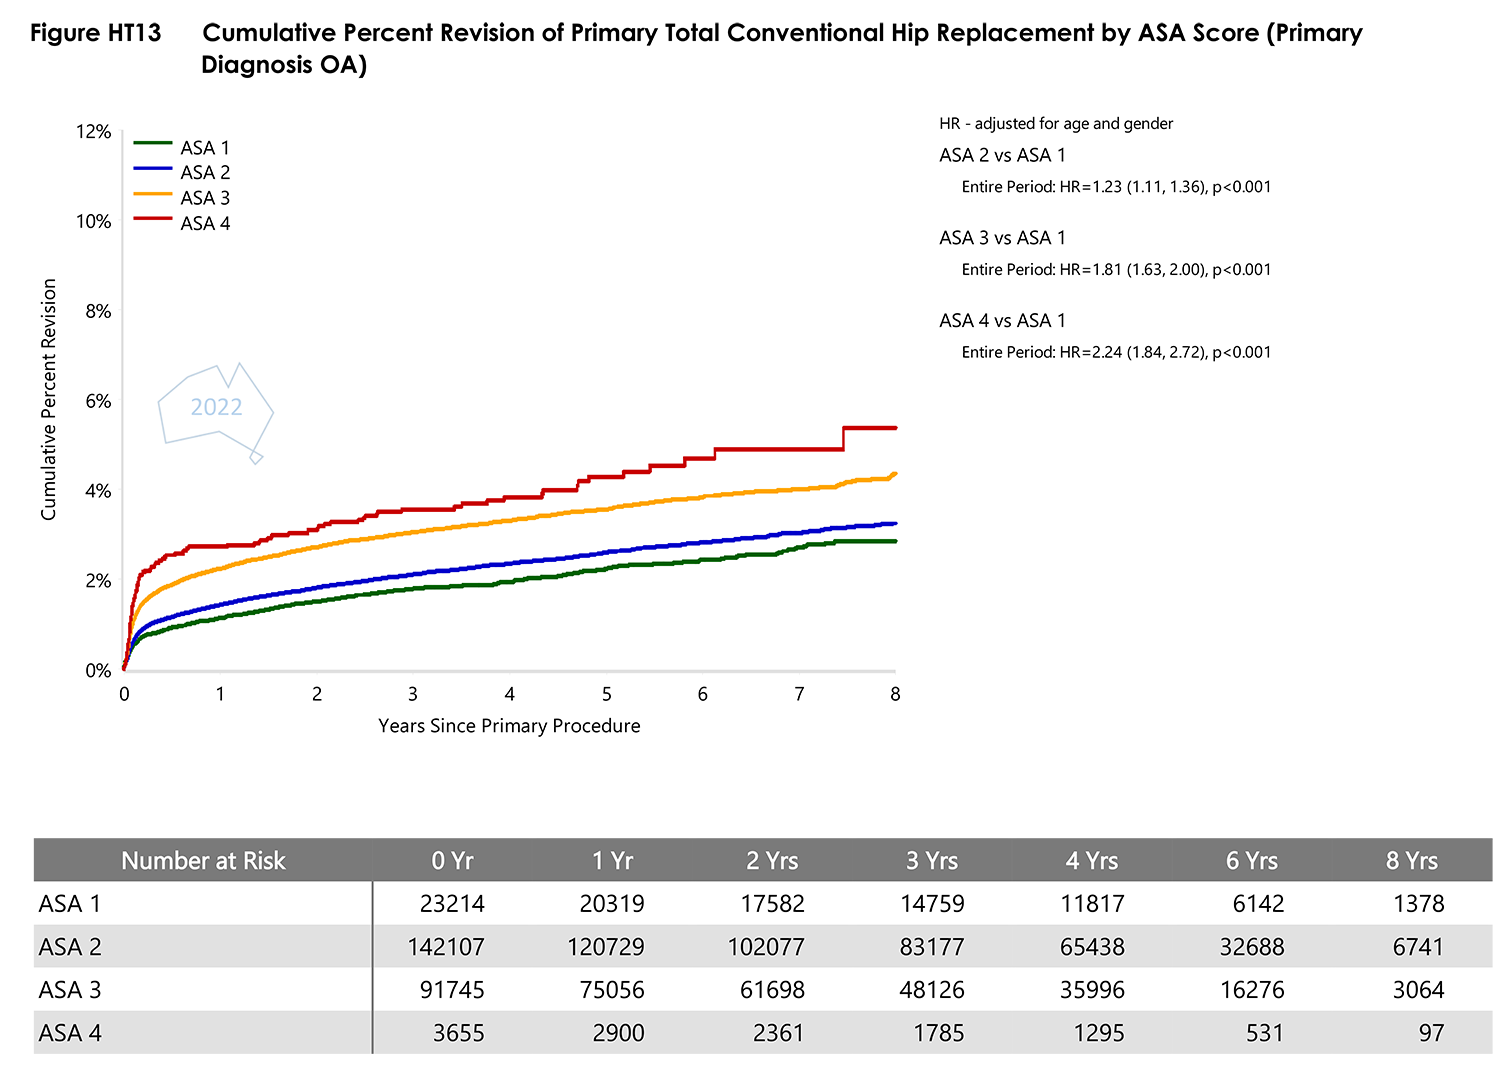
- Figure HT13 Cumulative Percent Revision of Primary Total Conventional Hip Replacement by ASA Score (Primary Diagnosis OA)PDF · 165 KB
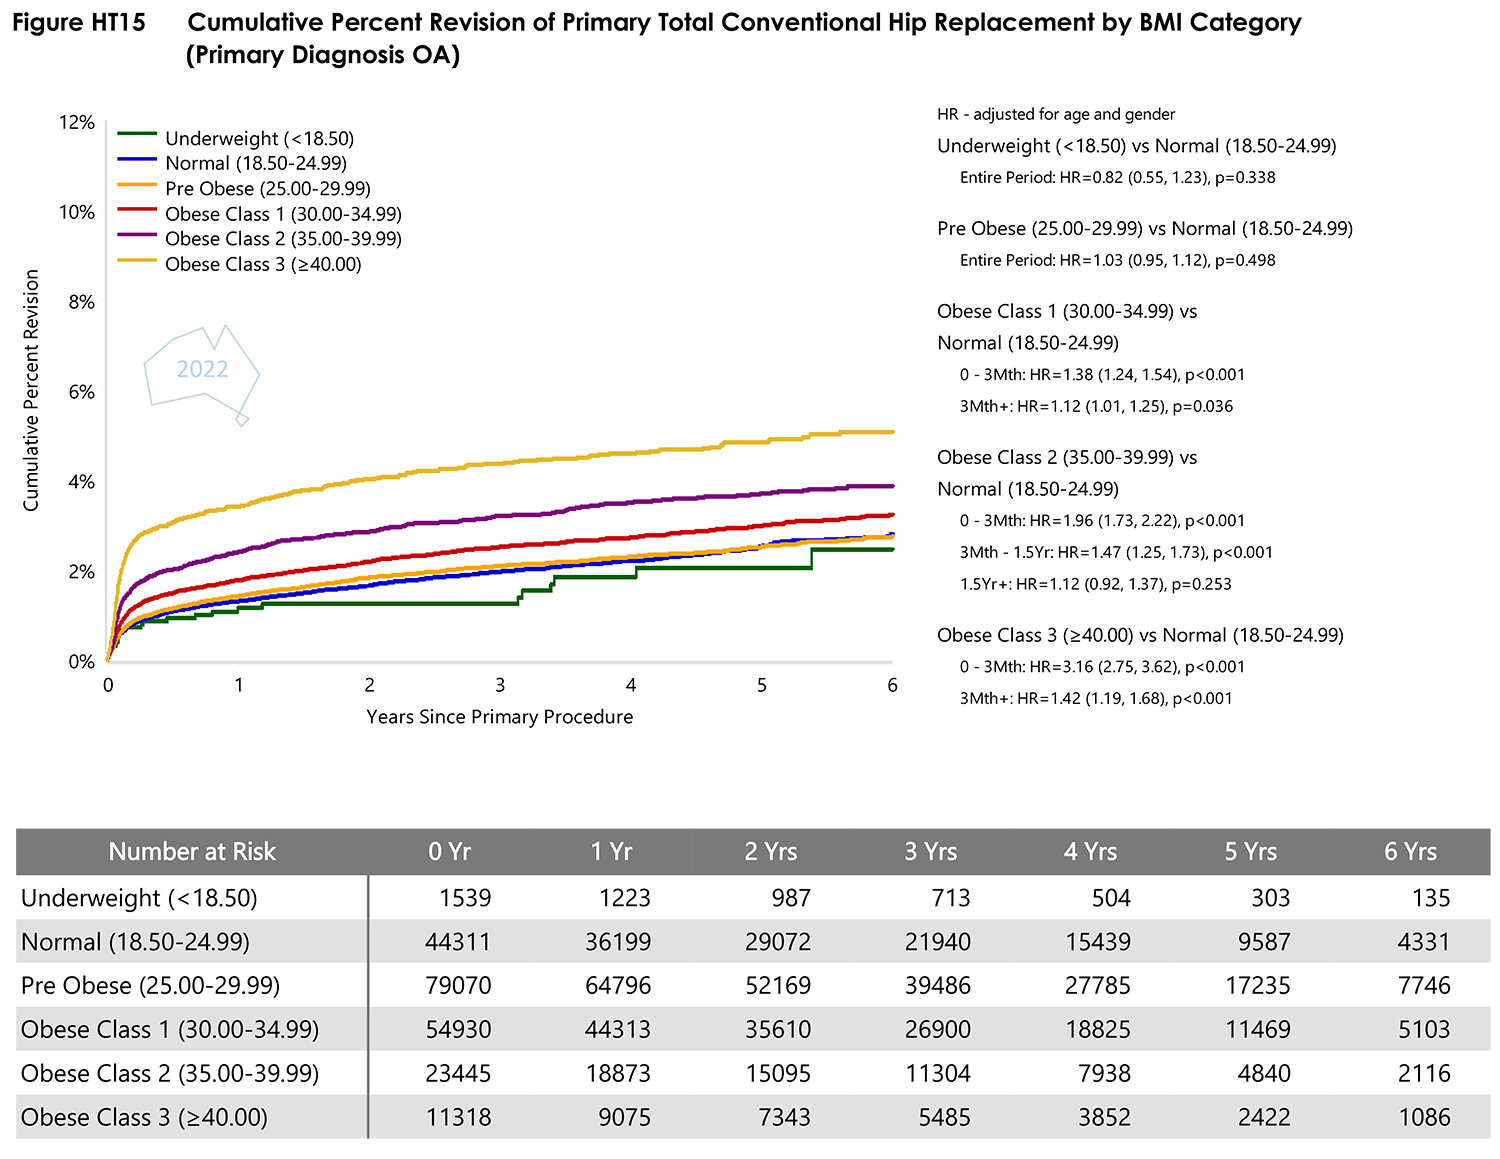
- Figure HT15 Cumulative Percent Revision of Primary Total Conventional Hip Replacement by BMI CategoryPDF · 177 KB
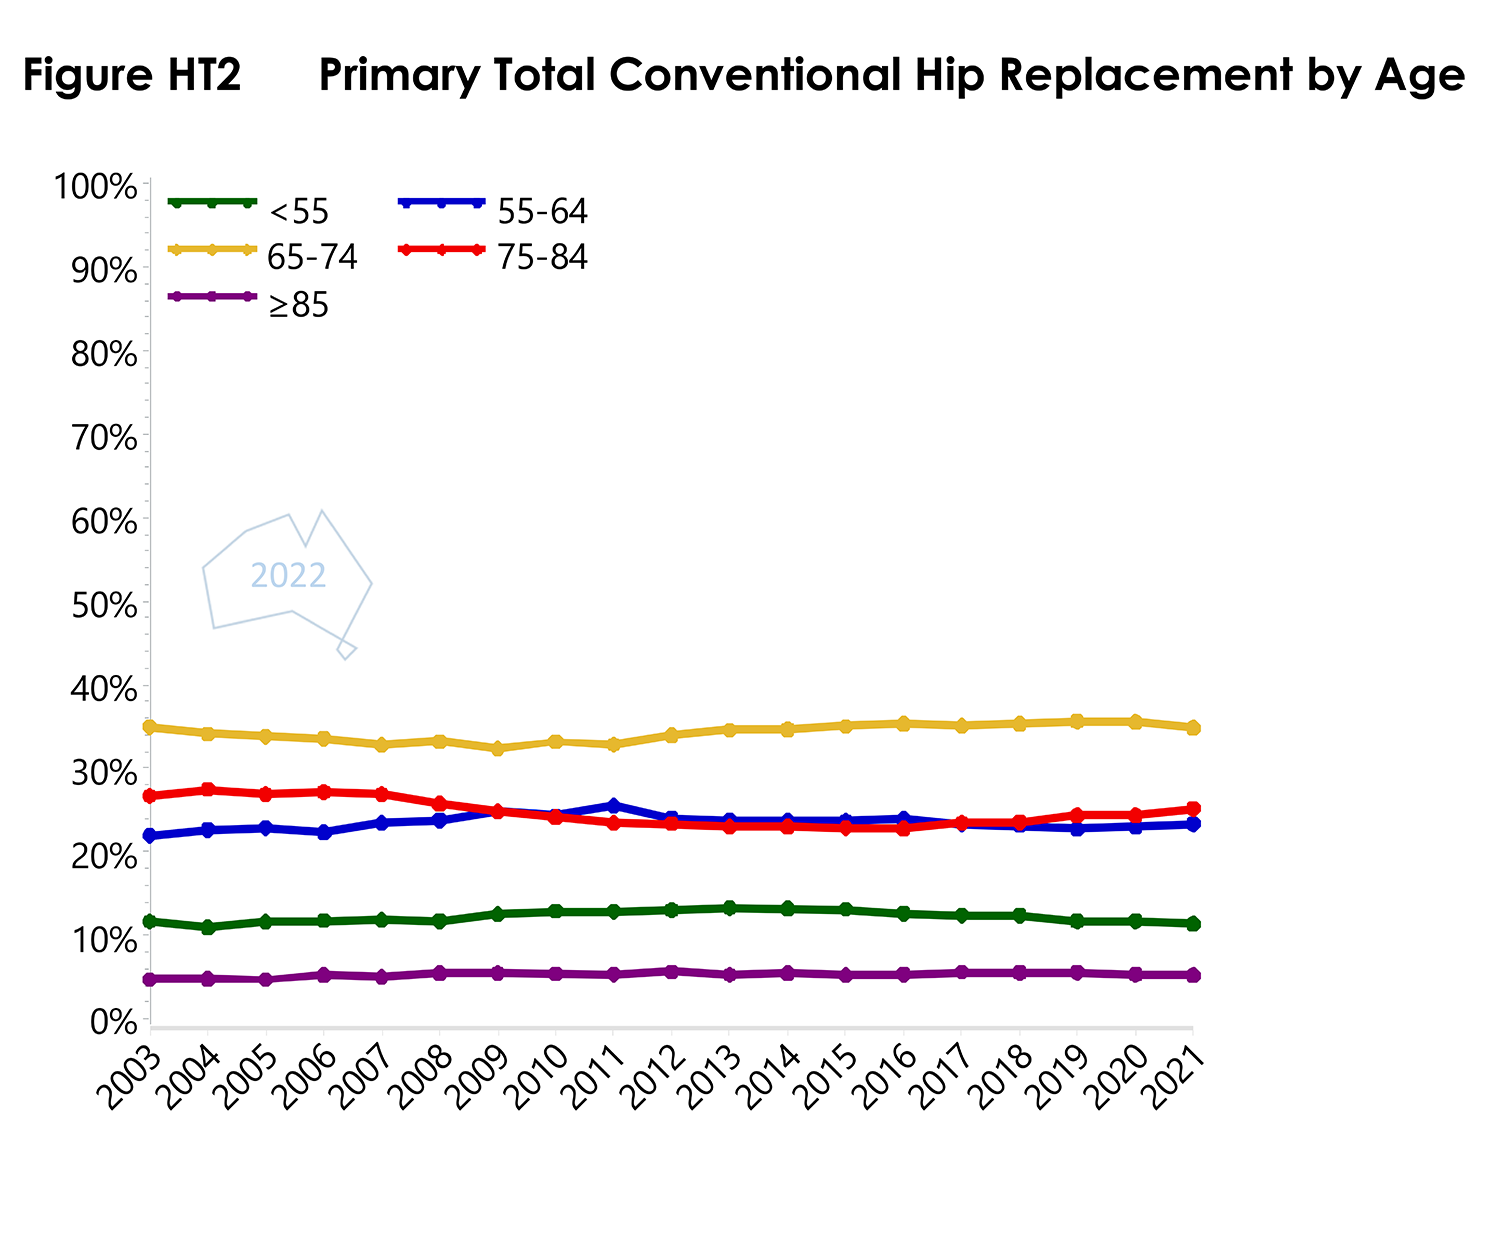
- Figure HT2 Primary Total Conventional Hip Replacement by AgePDF · 65 KB
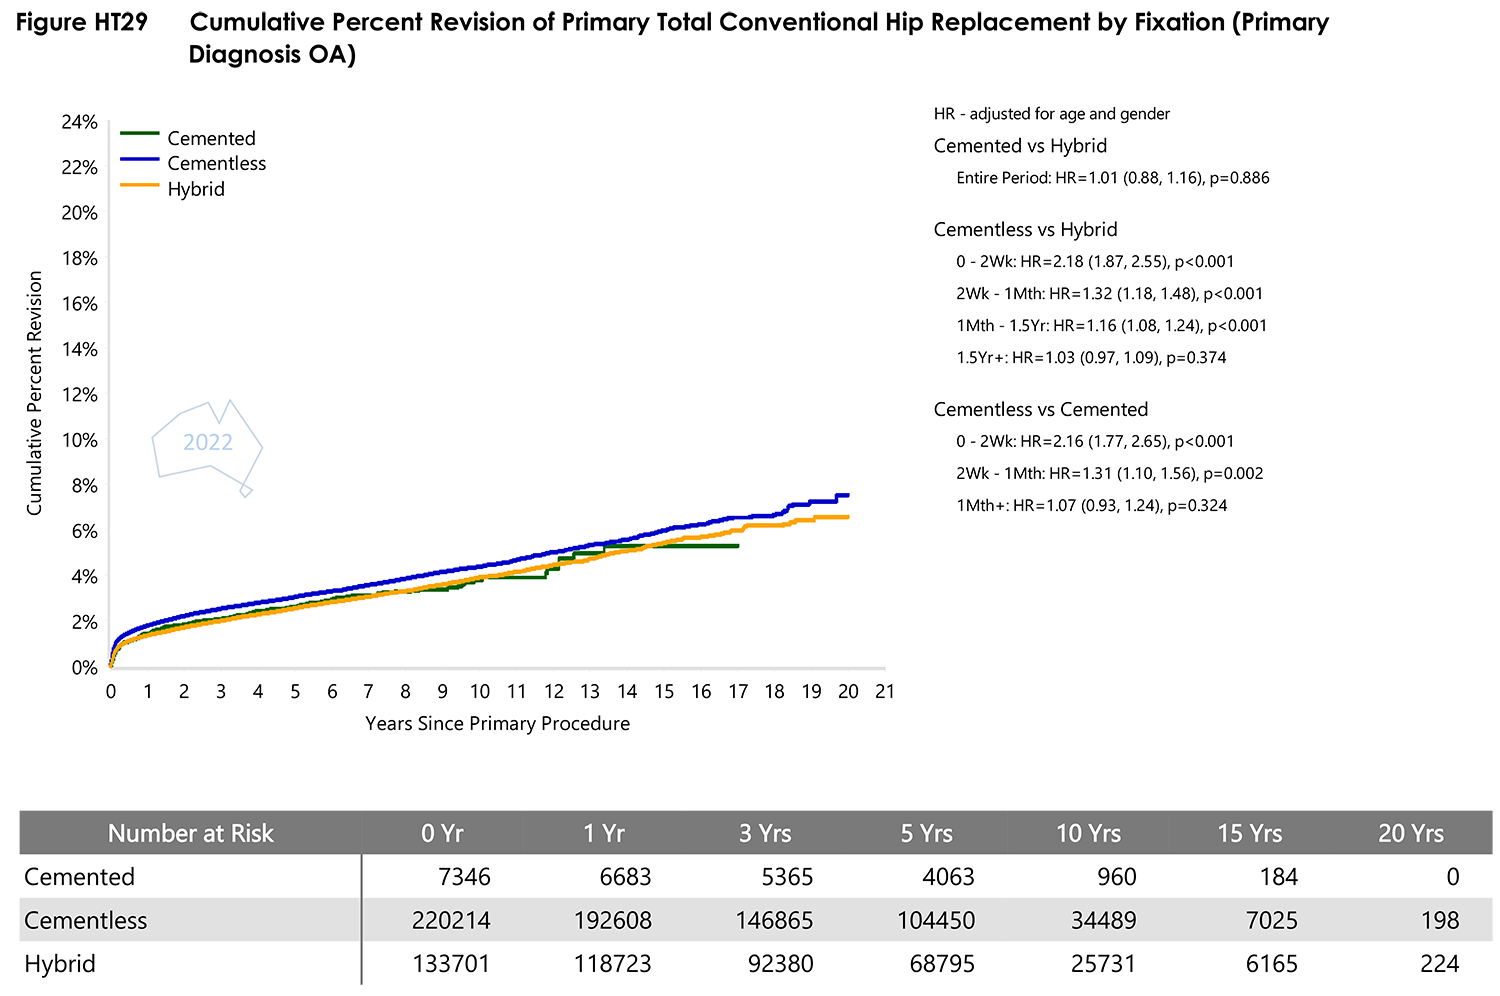
- Figure HT29 Cumulative Percent Revision of Primary Total Conventional Hip Replacement by FixationPDF · 183 KB
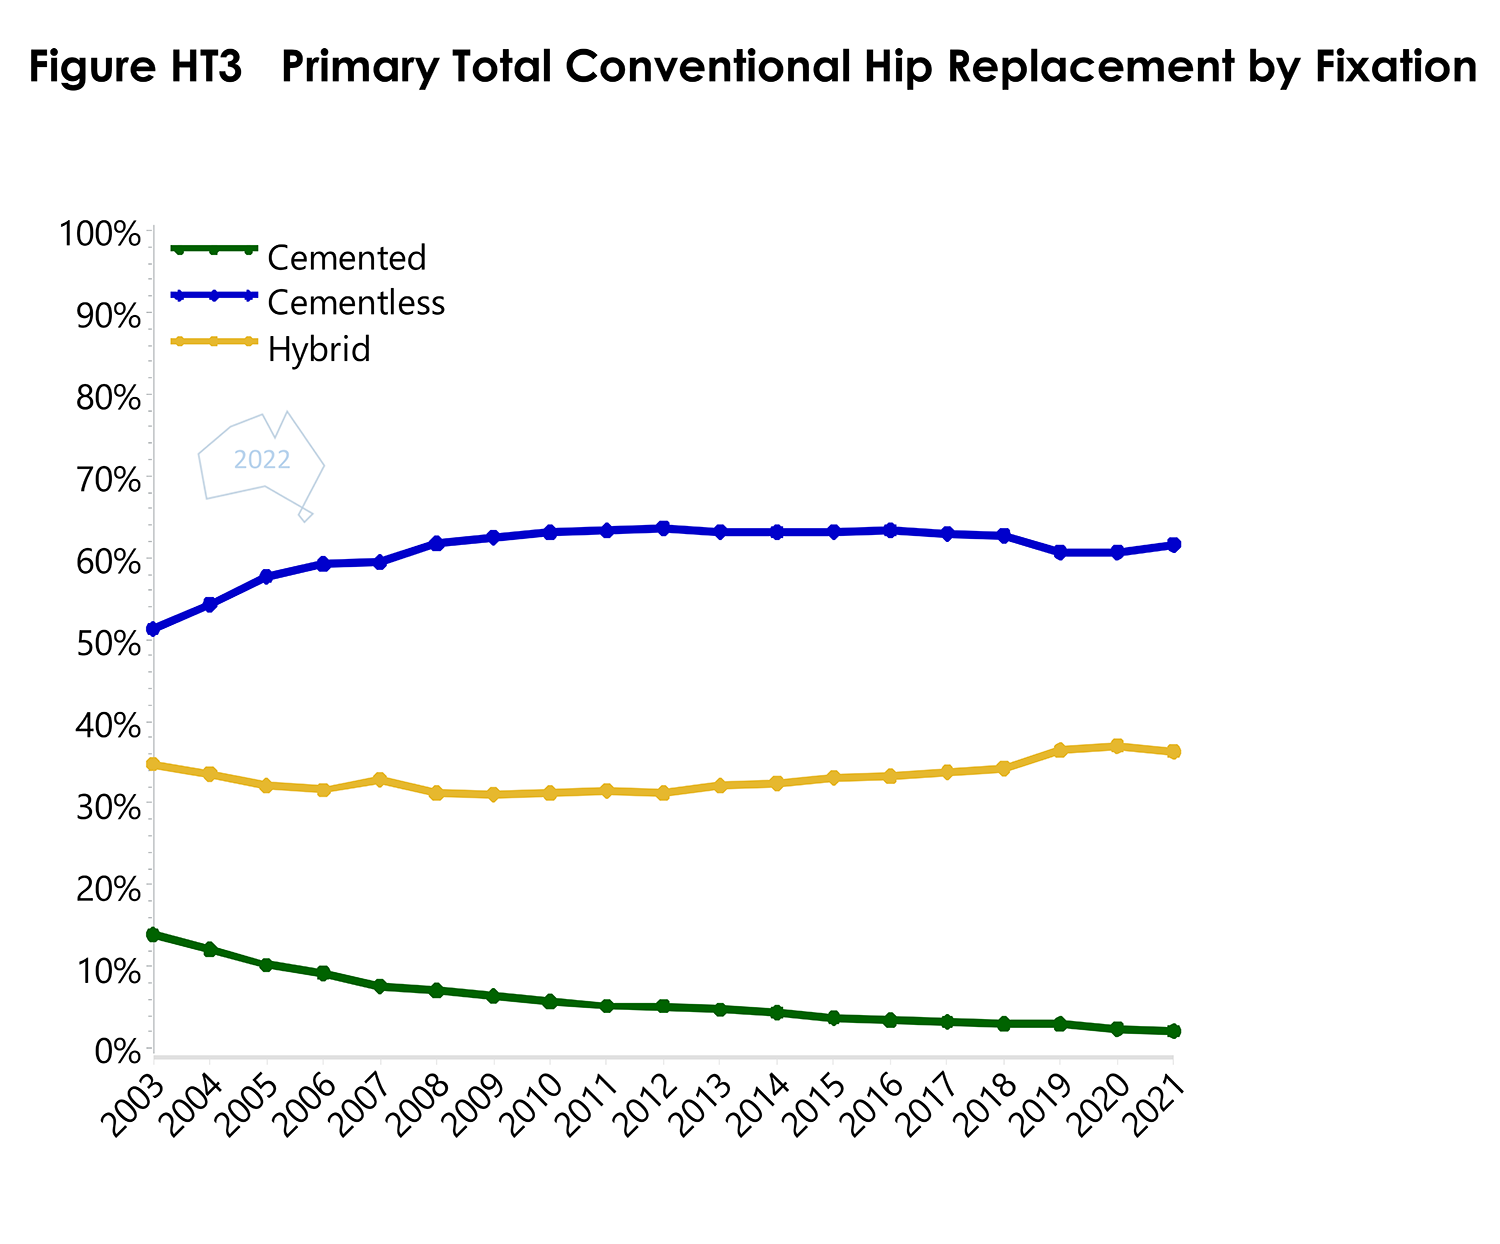
- Figure HT3 Primary Total Conventional Hip Replacement by FixationPDF · 64 KB
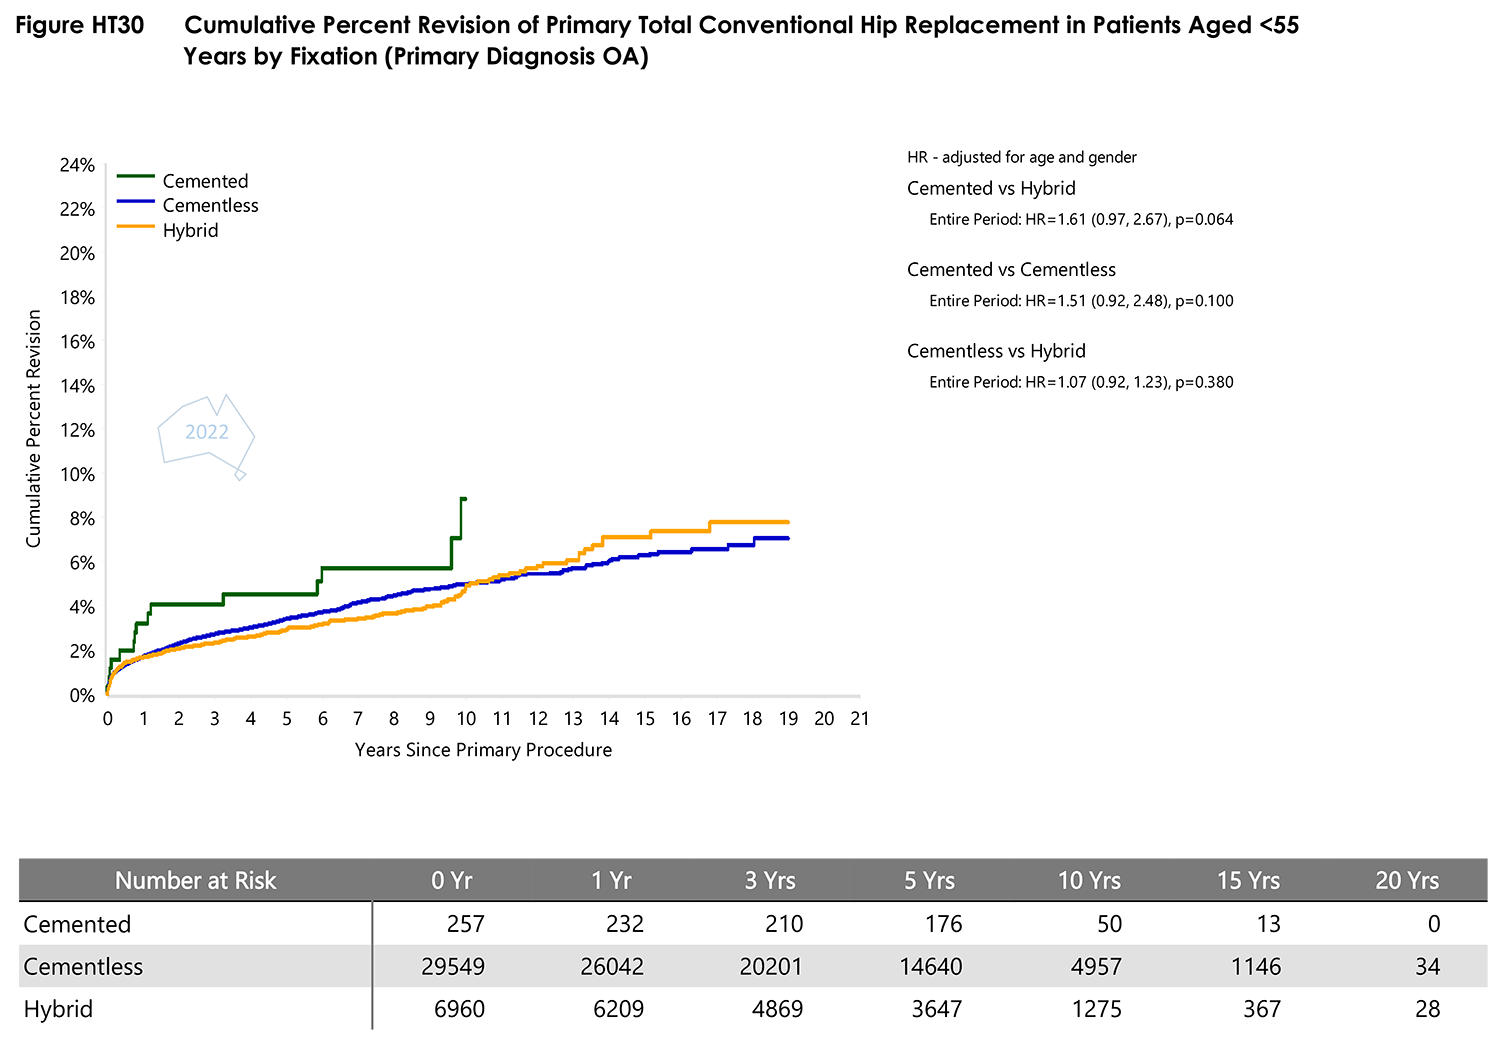
- Figure HT30 Cumulative Percent Revision of Primary Total Conventional Hip Replacement in Patients AgedPDF · 106 KB
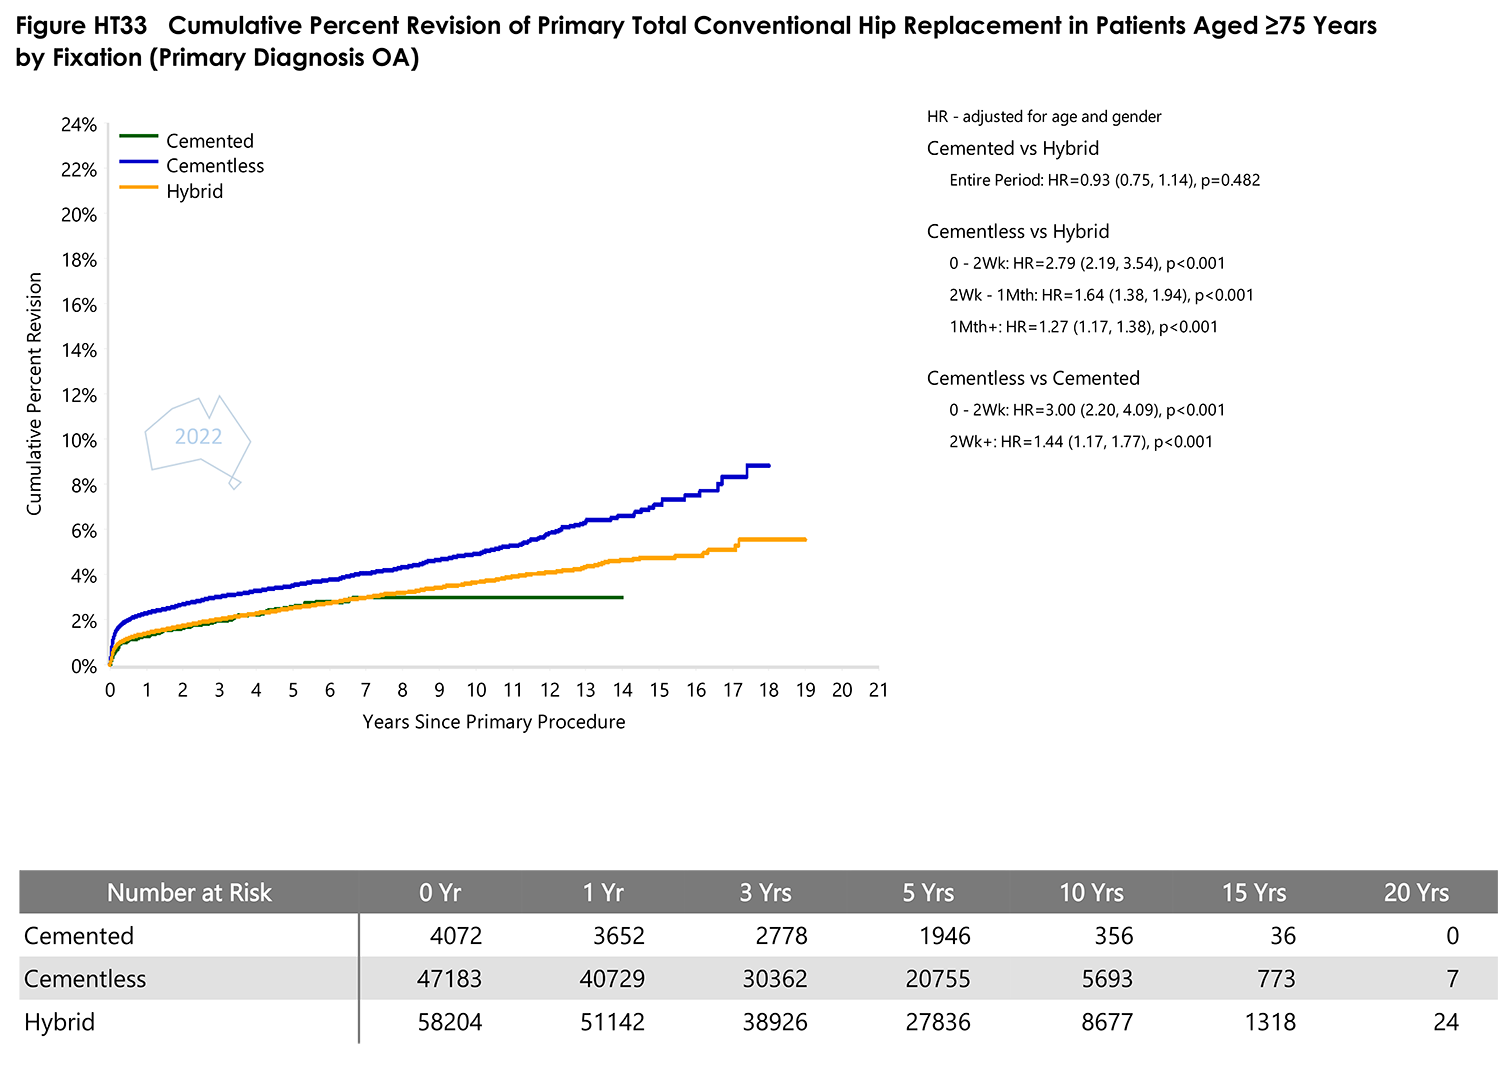
- Figure HT33 Cumulative Percent Revision of Primary Total Conventional Hip Replacement in Patients AgedPDF · 134 KB
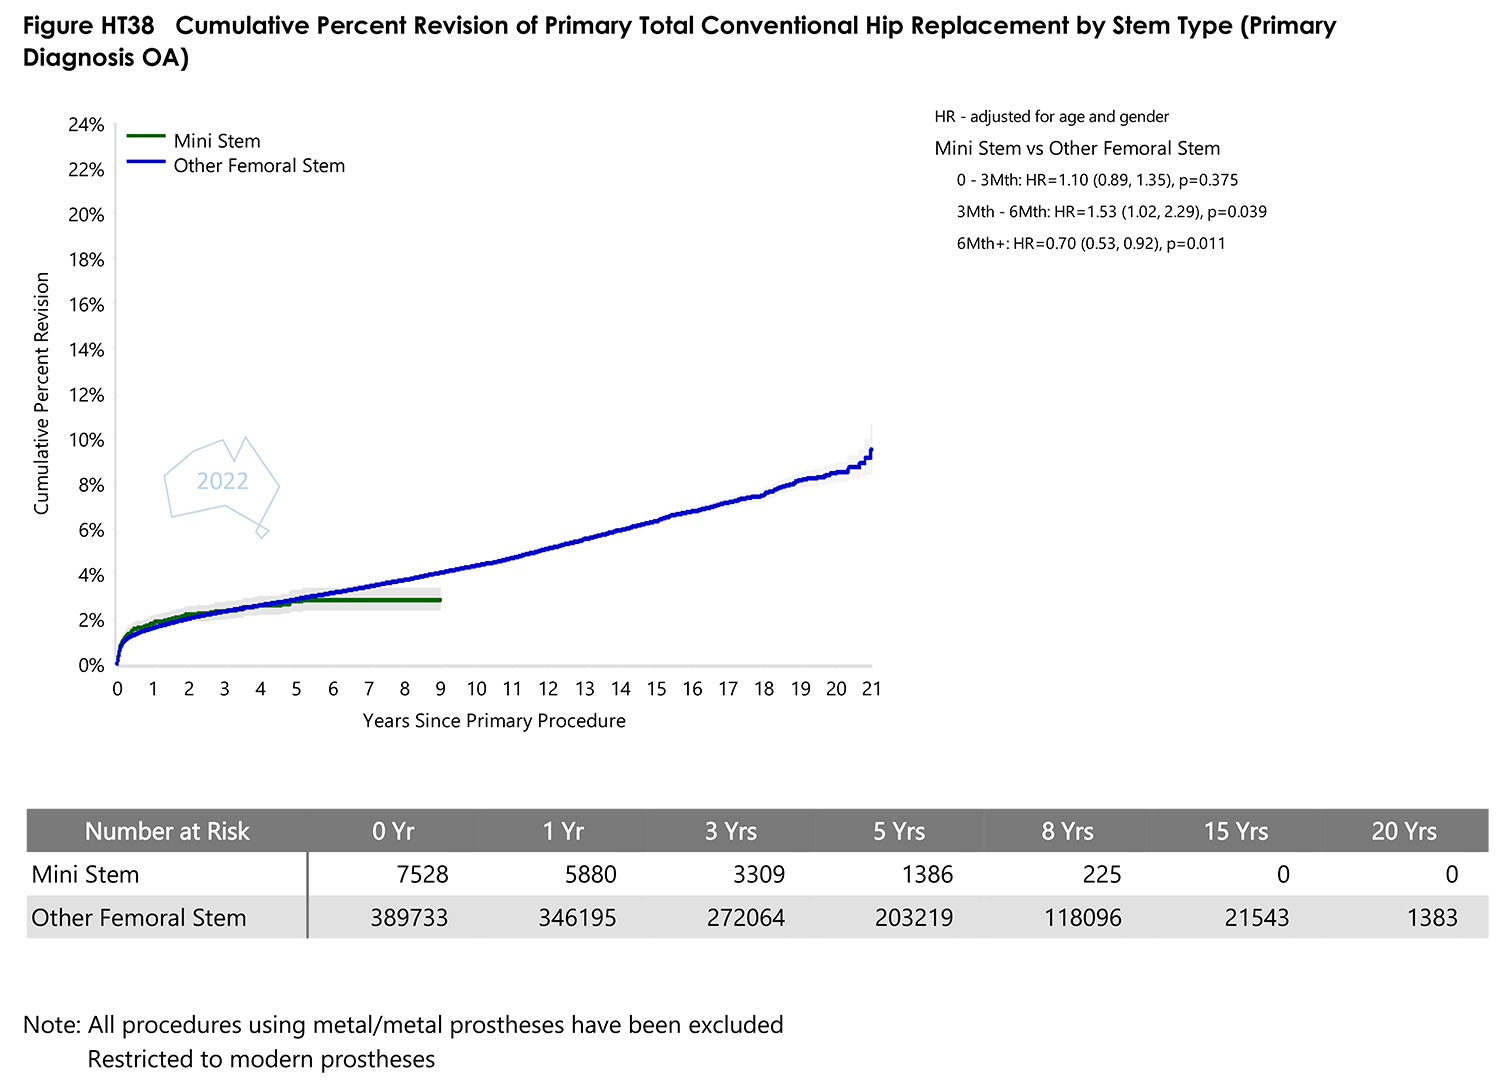
- Figure HT38 Cumulative Percent Revision of Primary Total Conventional Hip Replacement by Stem TypePDF · 166 KB
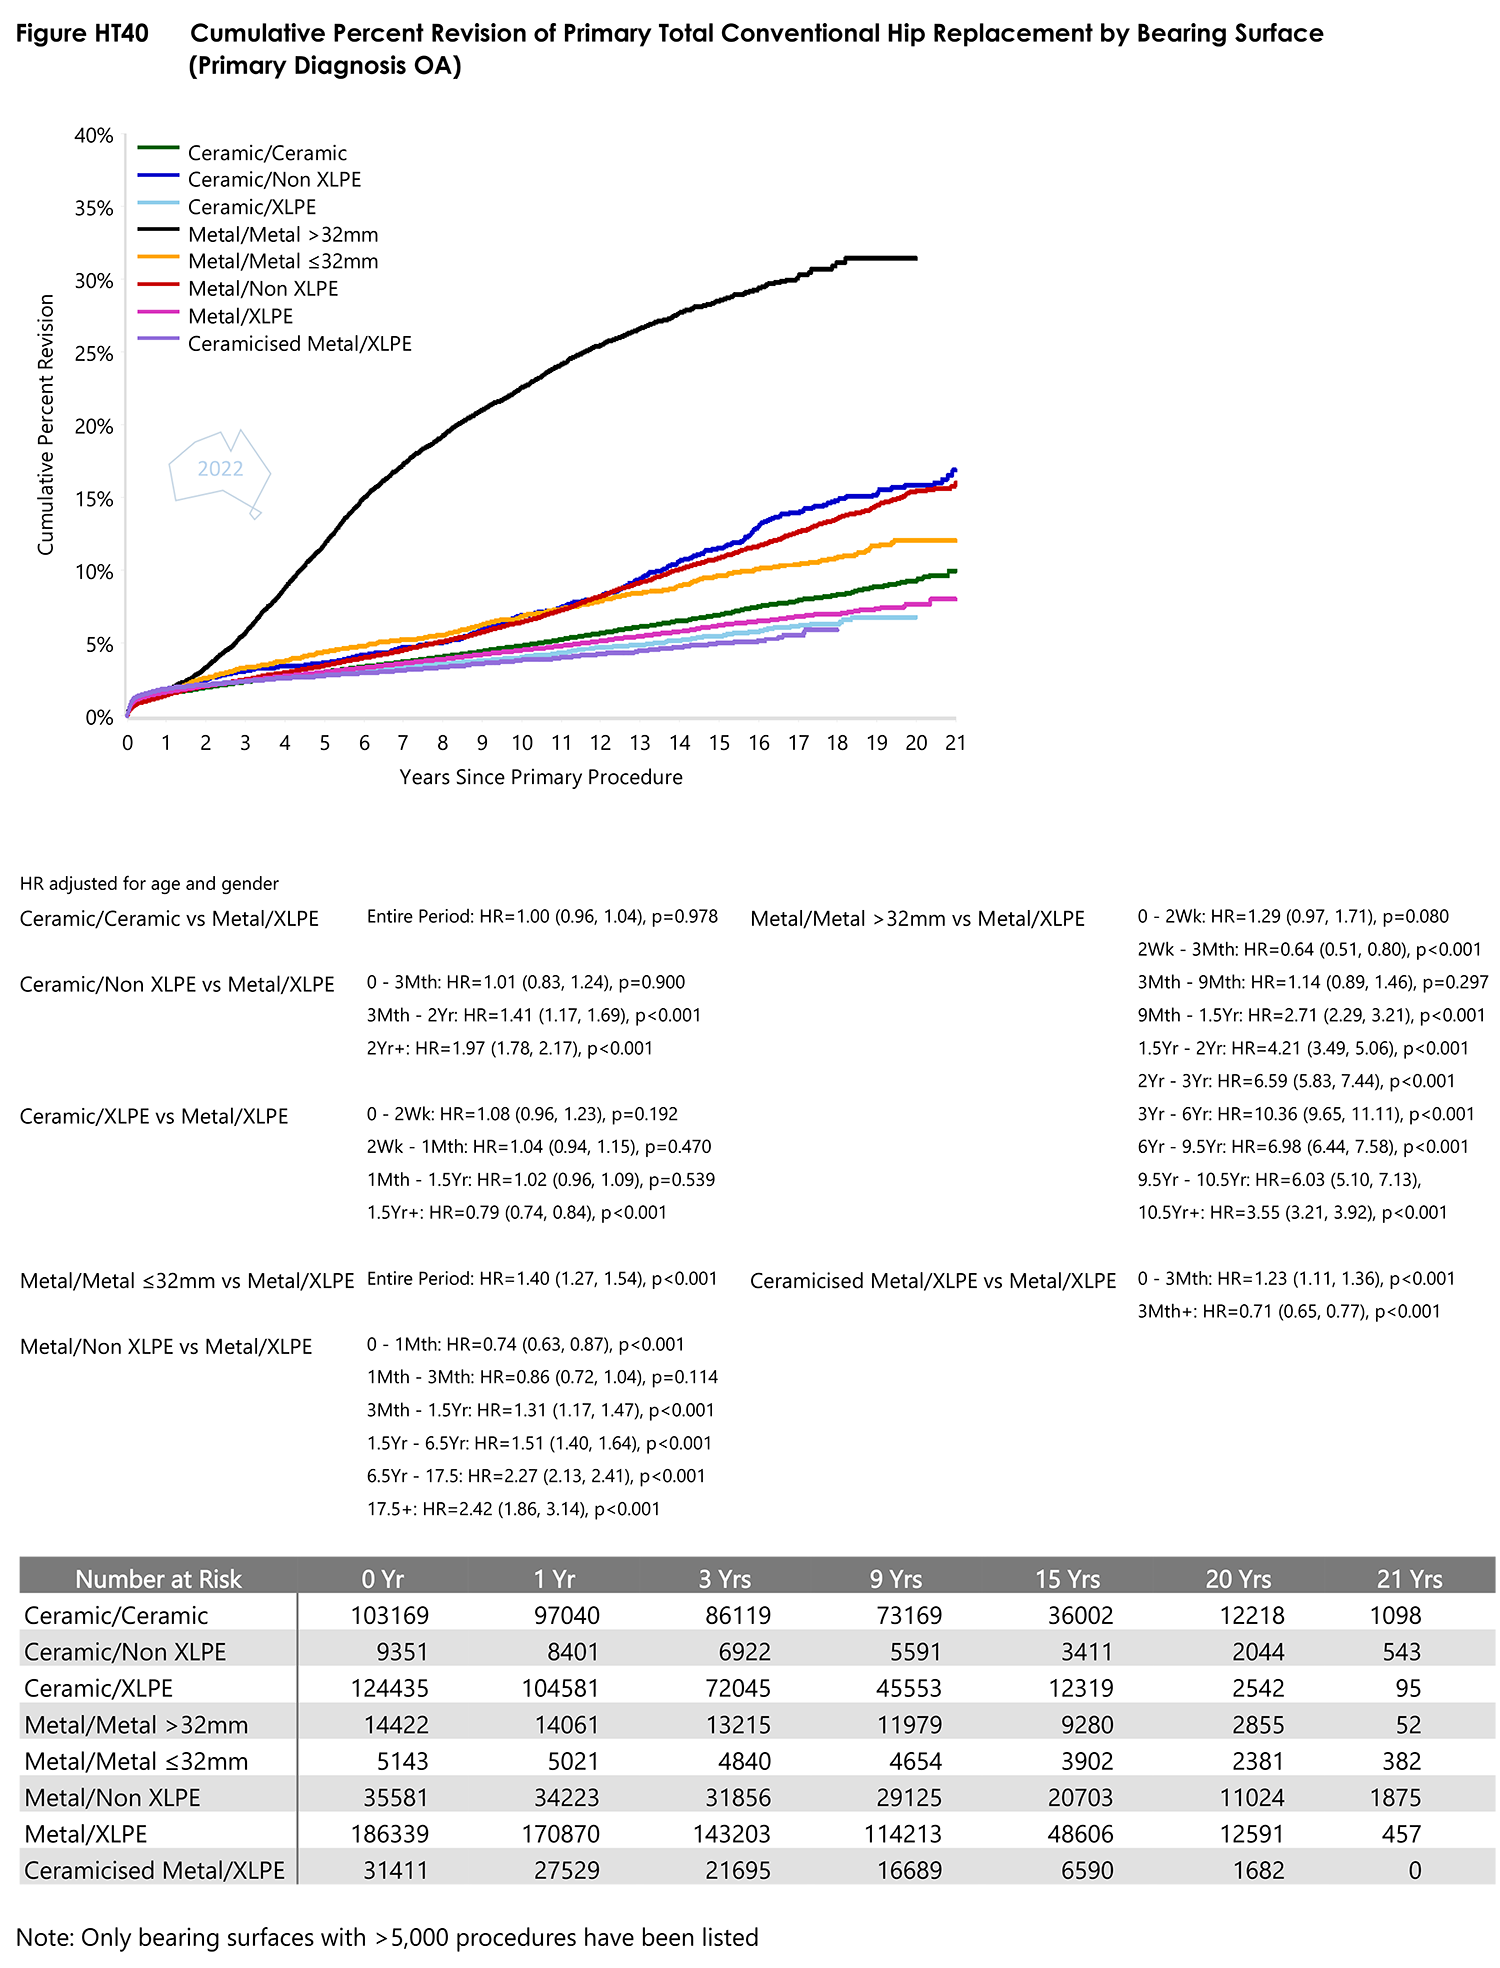
- Figure HT40 Cumulative Percent Revision of Primary Total Conventional Hip Replacement by Bearing SurfacePDF · 442 KB
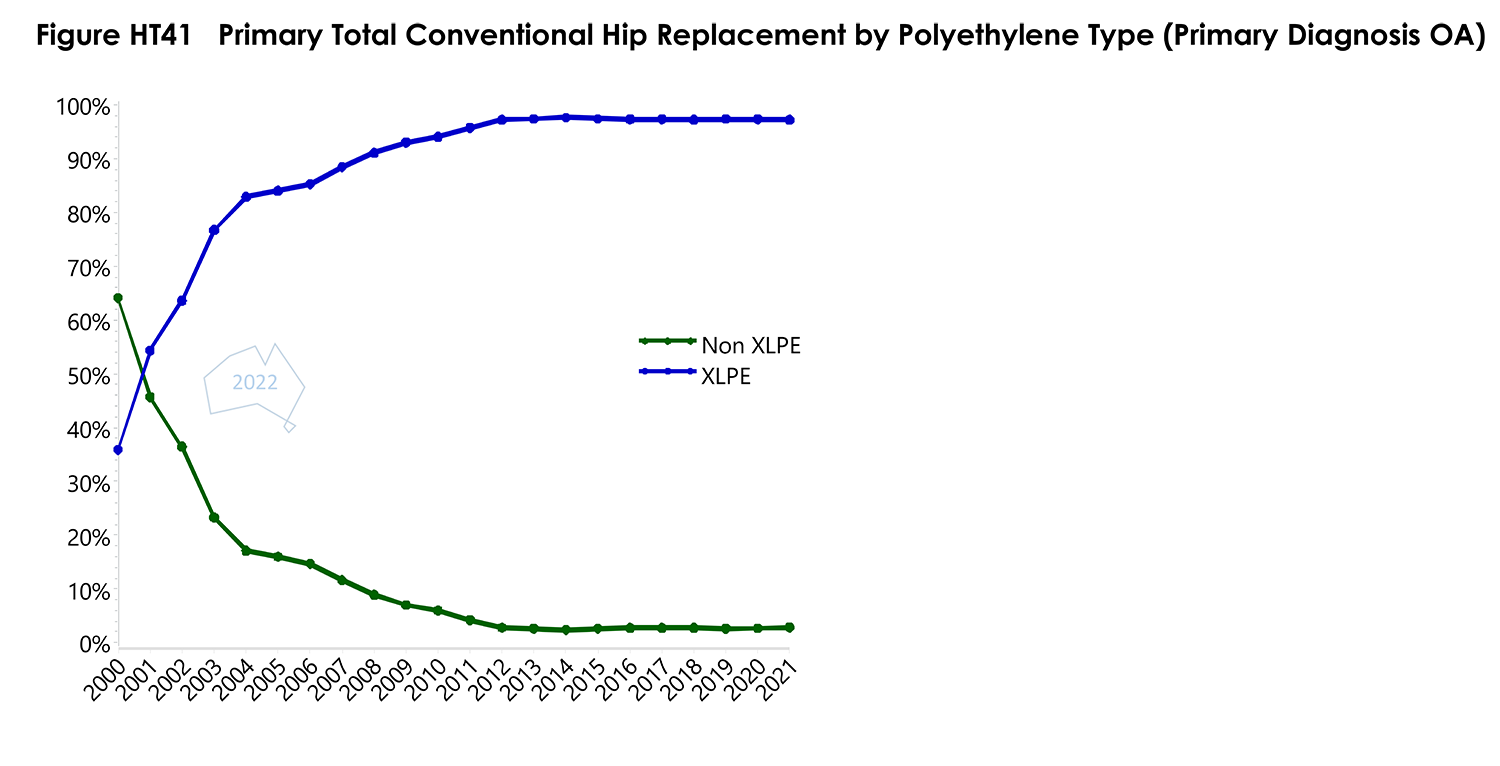
- Figure HT41 Primary Total Conventional Hip Replacement by Polyethylene TypePDF · 62 KB
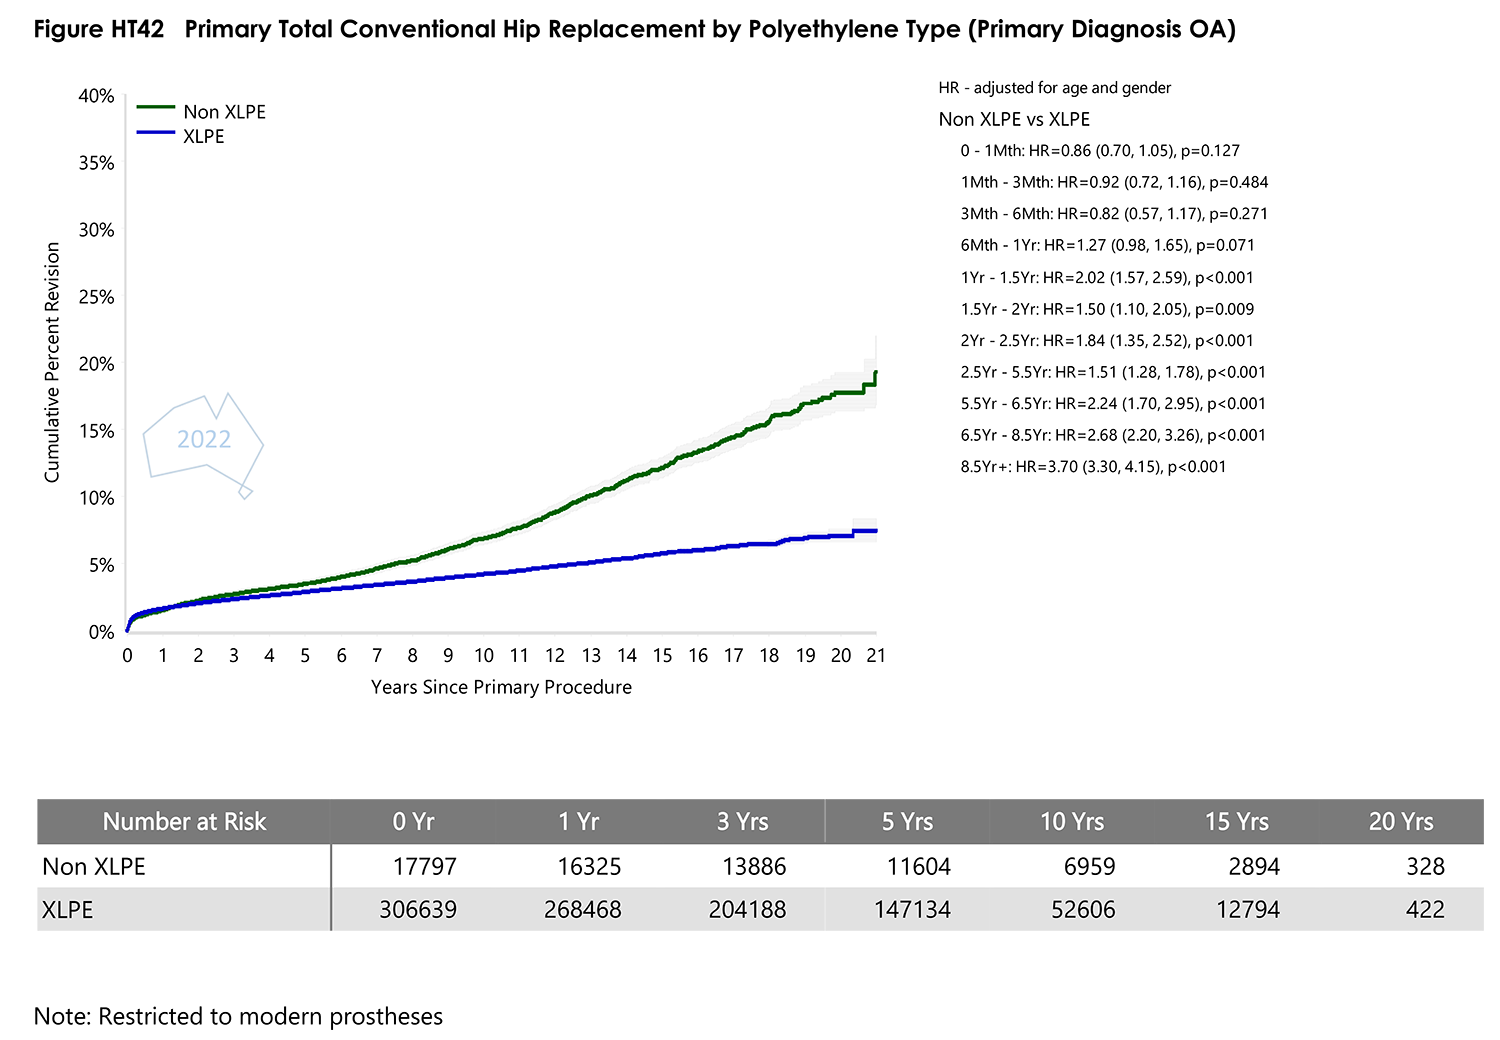
- Figure HT42 Primary Total Conventional Hip Replacement by Polyethylene TypePDF · 186 KB
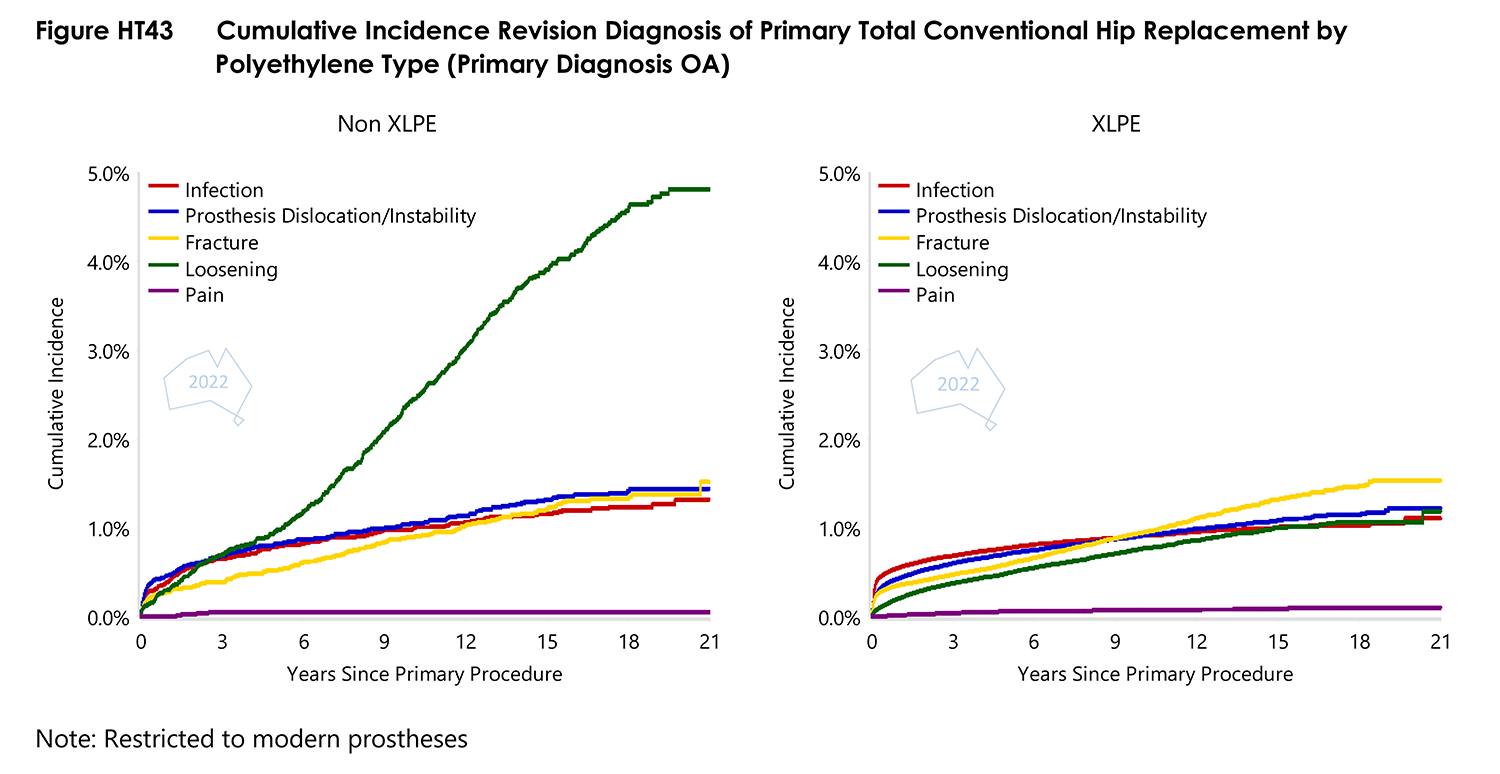
- Figure HT43 Cumulative Incidence Revision Diagnosis of Primary Total Conventional Hip Replacement by Polyethylene TypePDF · 224 KB
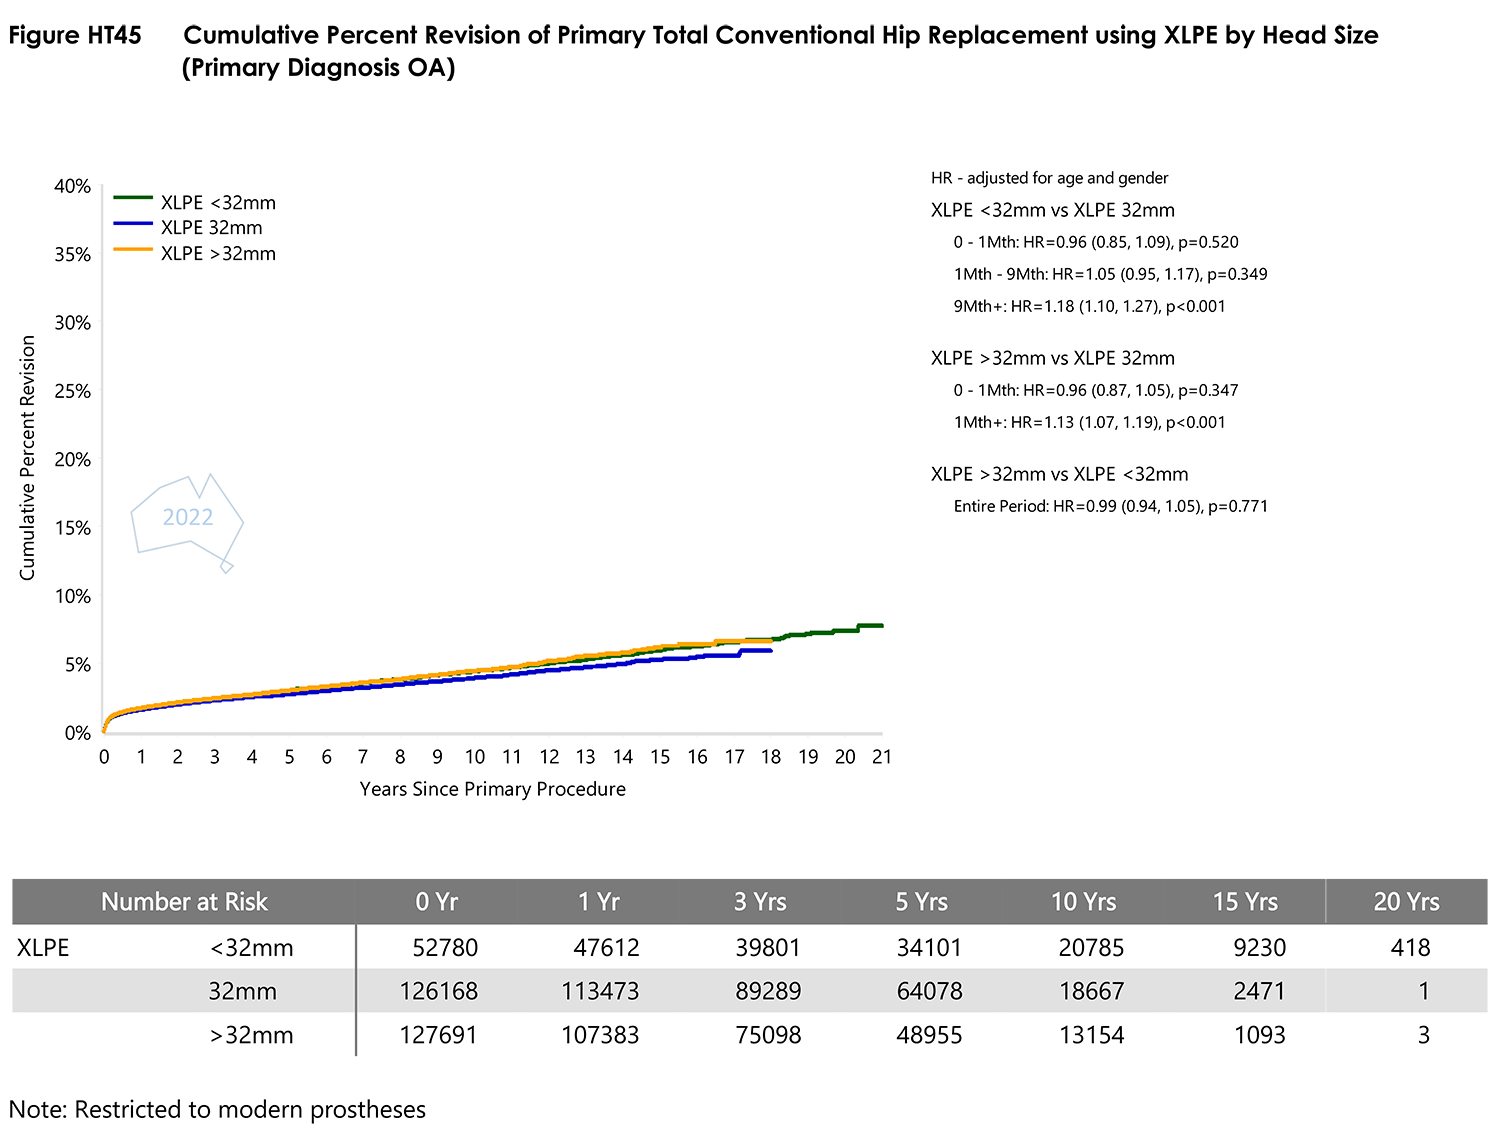
- Figure HT45 Cumulative Percent Revision of Primary Total Conventional Hip Replacement using XLPE by Head SizePDF · 190 KB
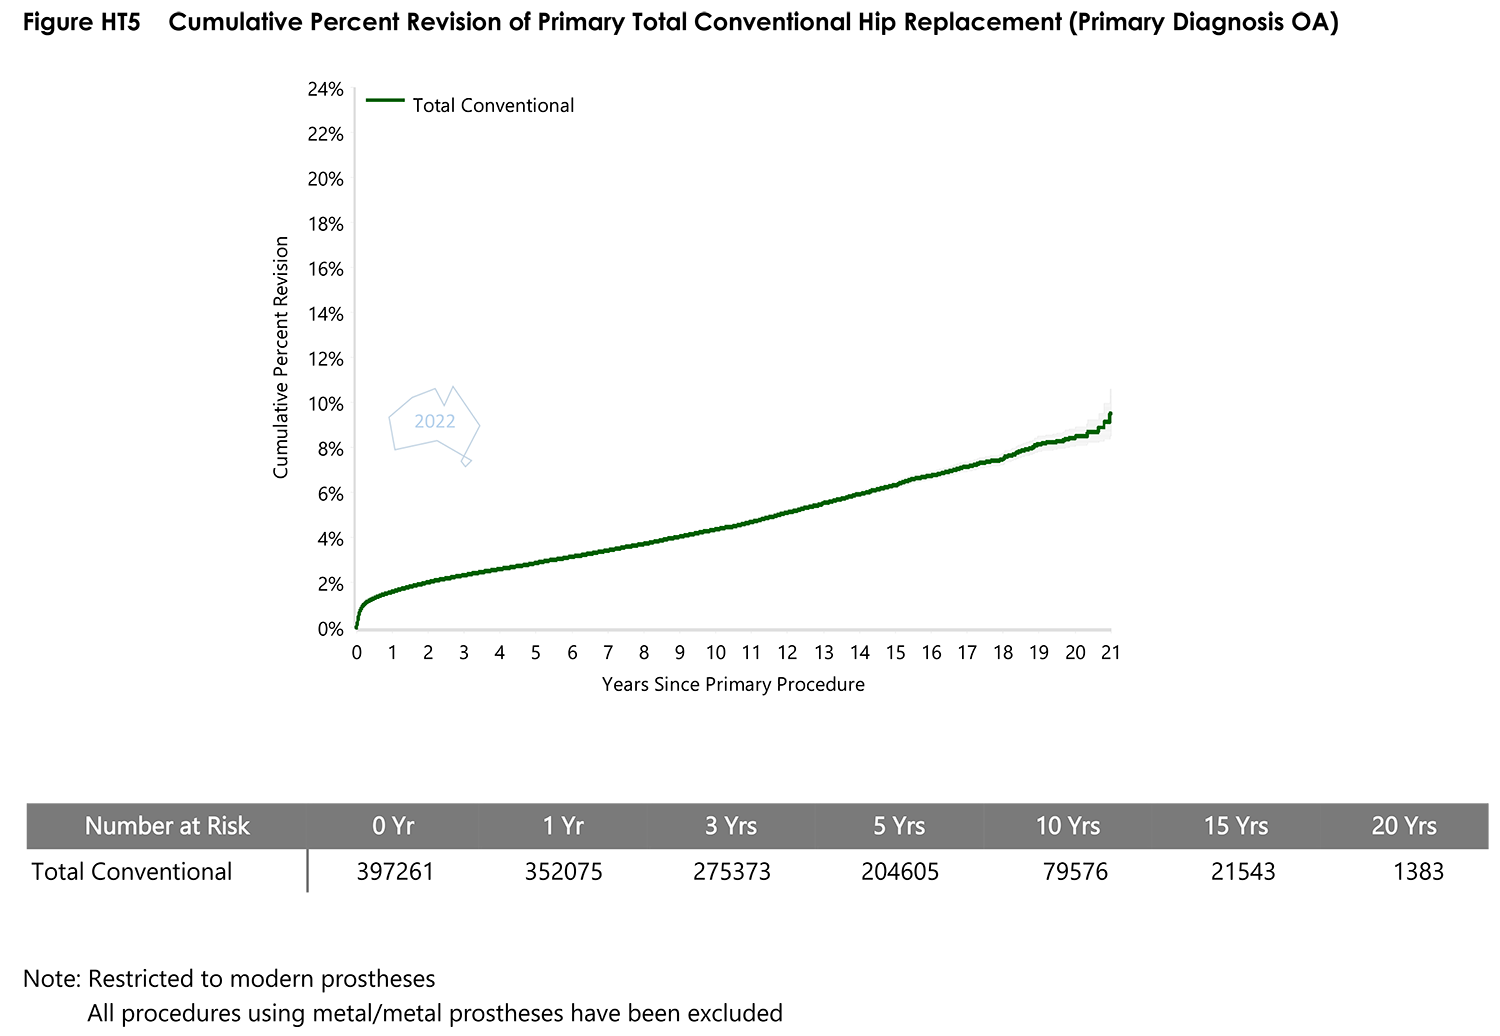
- Figure HT5 Cumulative Percent Revision of Primary Total Conventional Hip ReplacementPDF · 136 KB
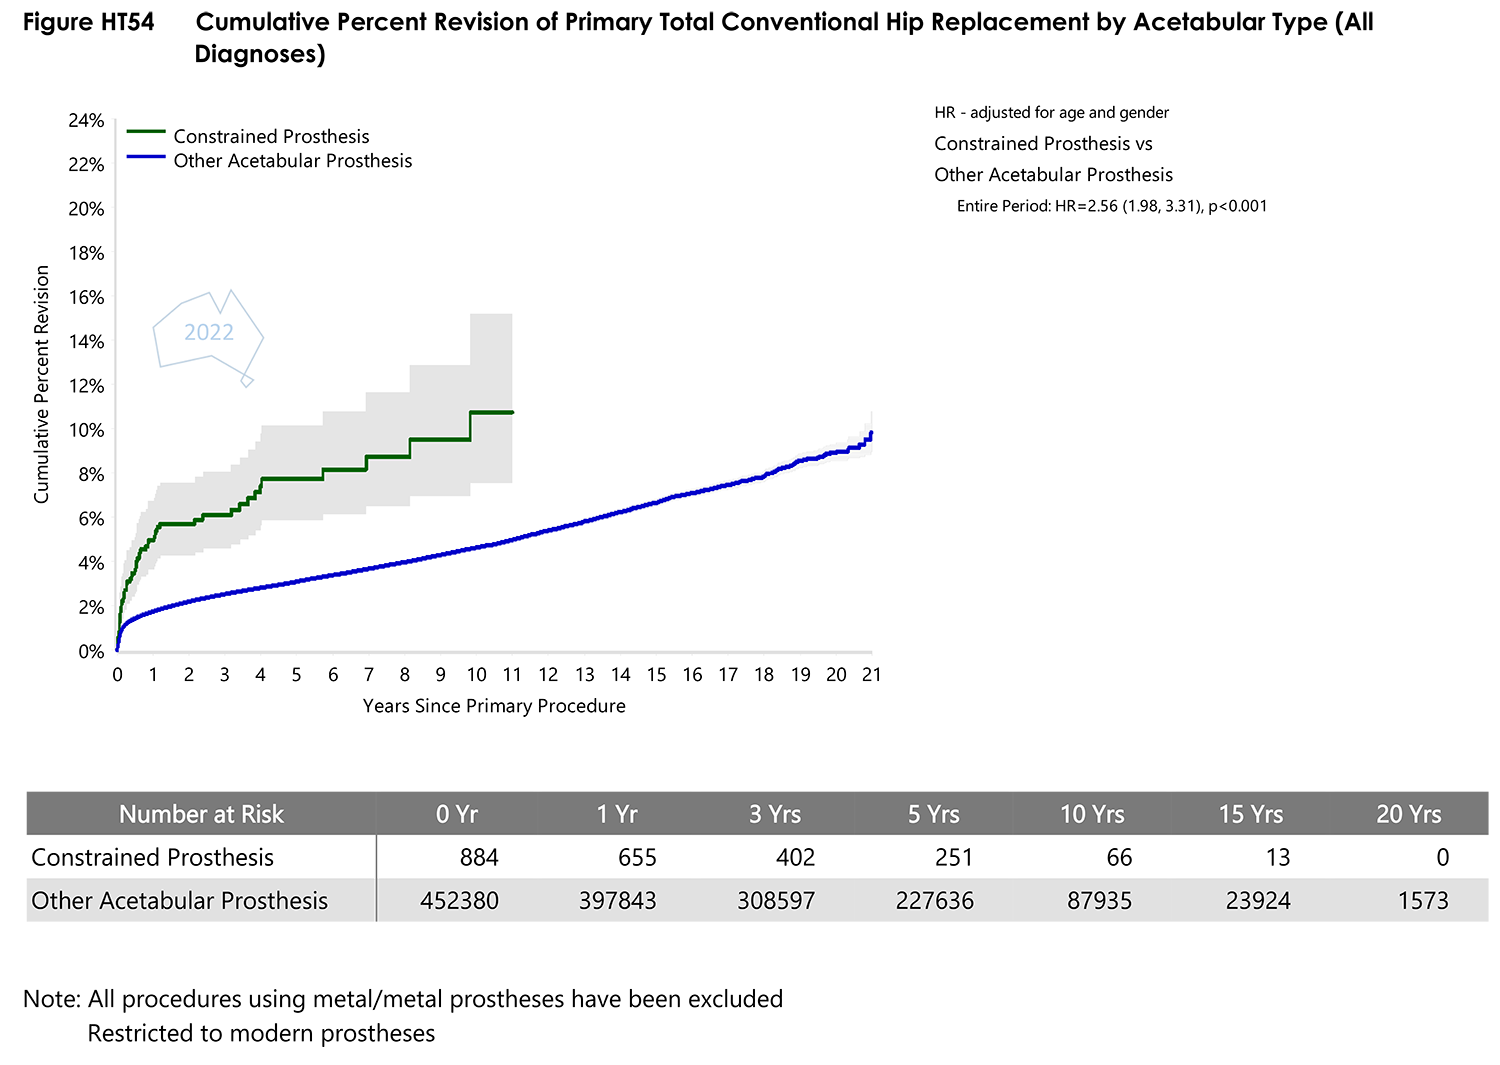
- Figure HT54 Cumulative Percent Revision of Primary Total Conventional Hip Replacement by Acetabular TypePDF · 148 KB
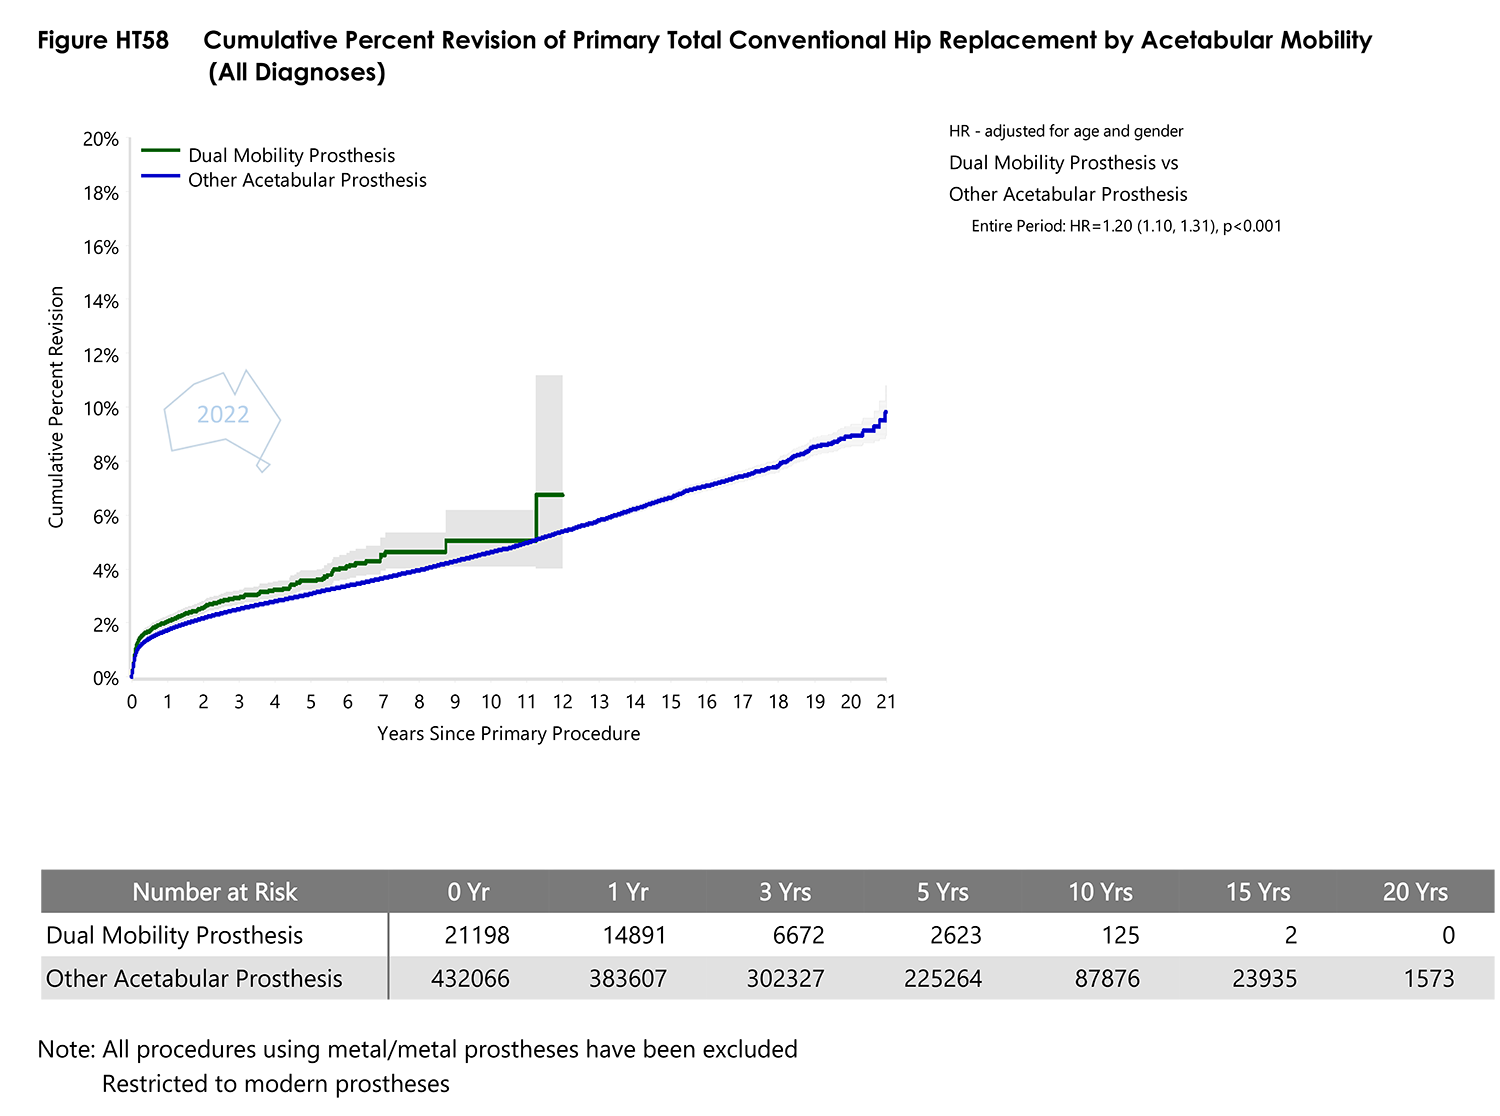
- Figure HT58 Cumulative Percent Revision of Primary Total Conventional Hip Replacement by Acetabular MobilityPDF · 196 KB
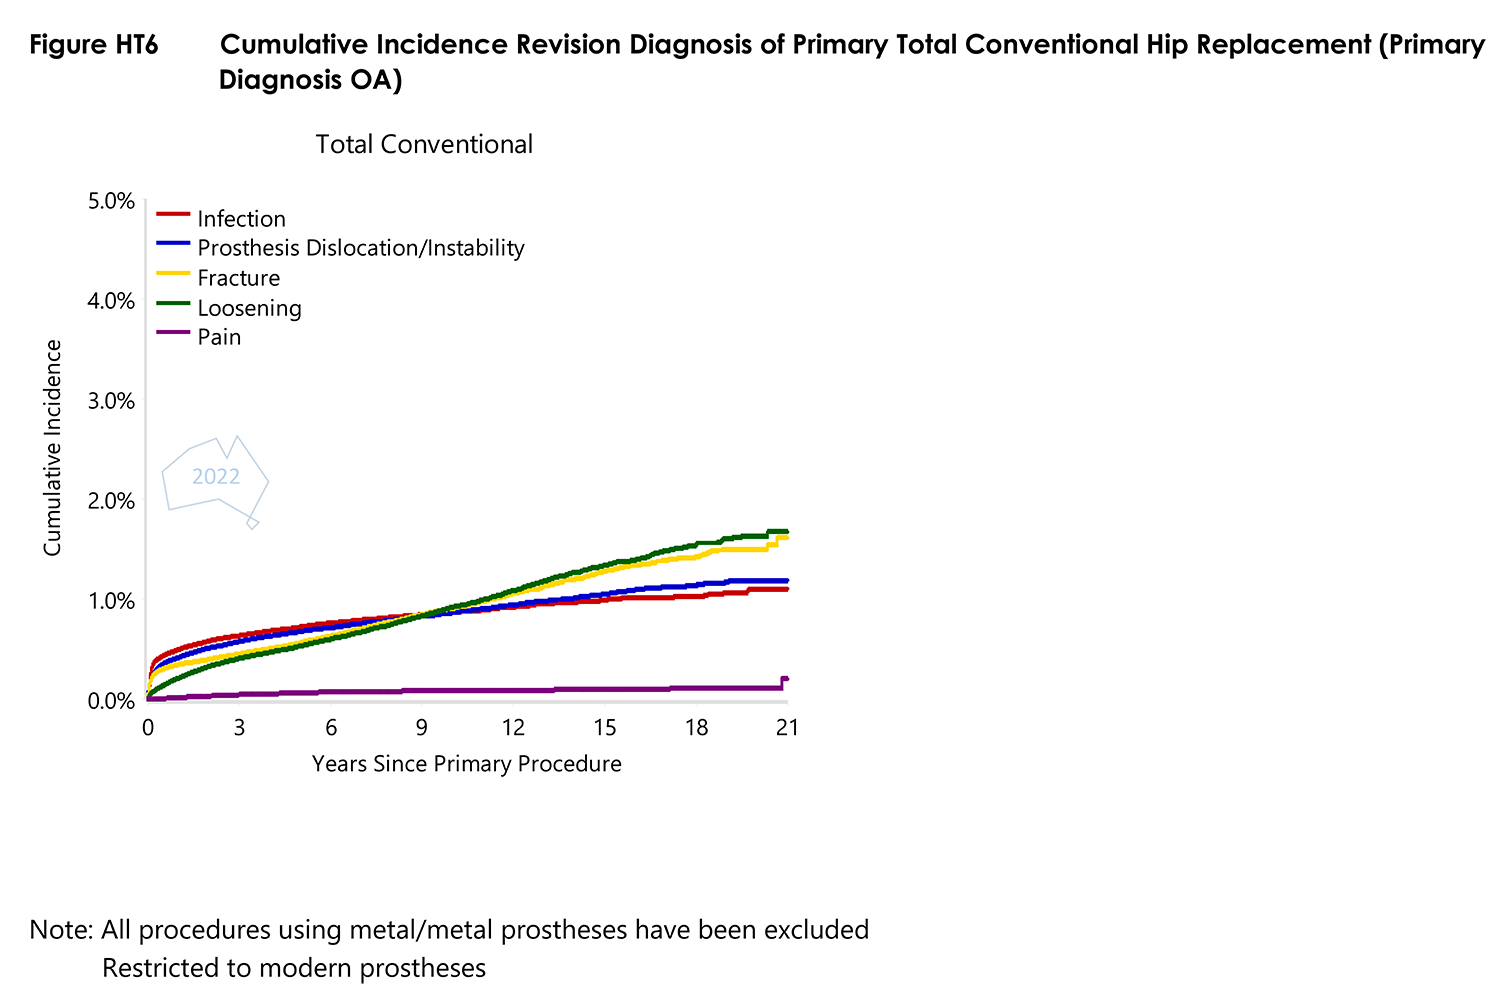
- Figure HT6 Cumulative Incidence Revision Diagnosis of Primary Total Conventional Hip ReplacementPDF · 188 KB
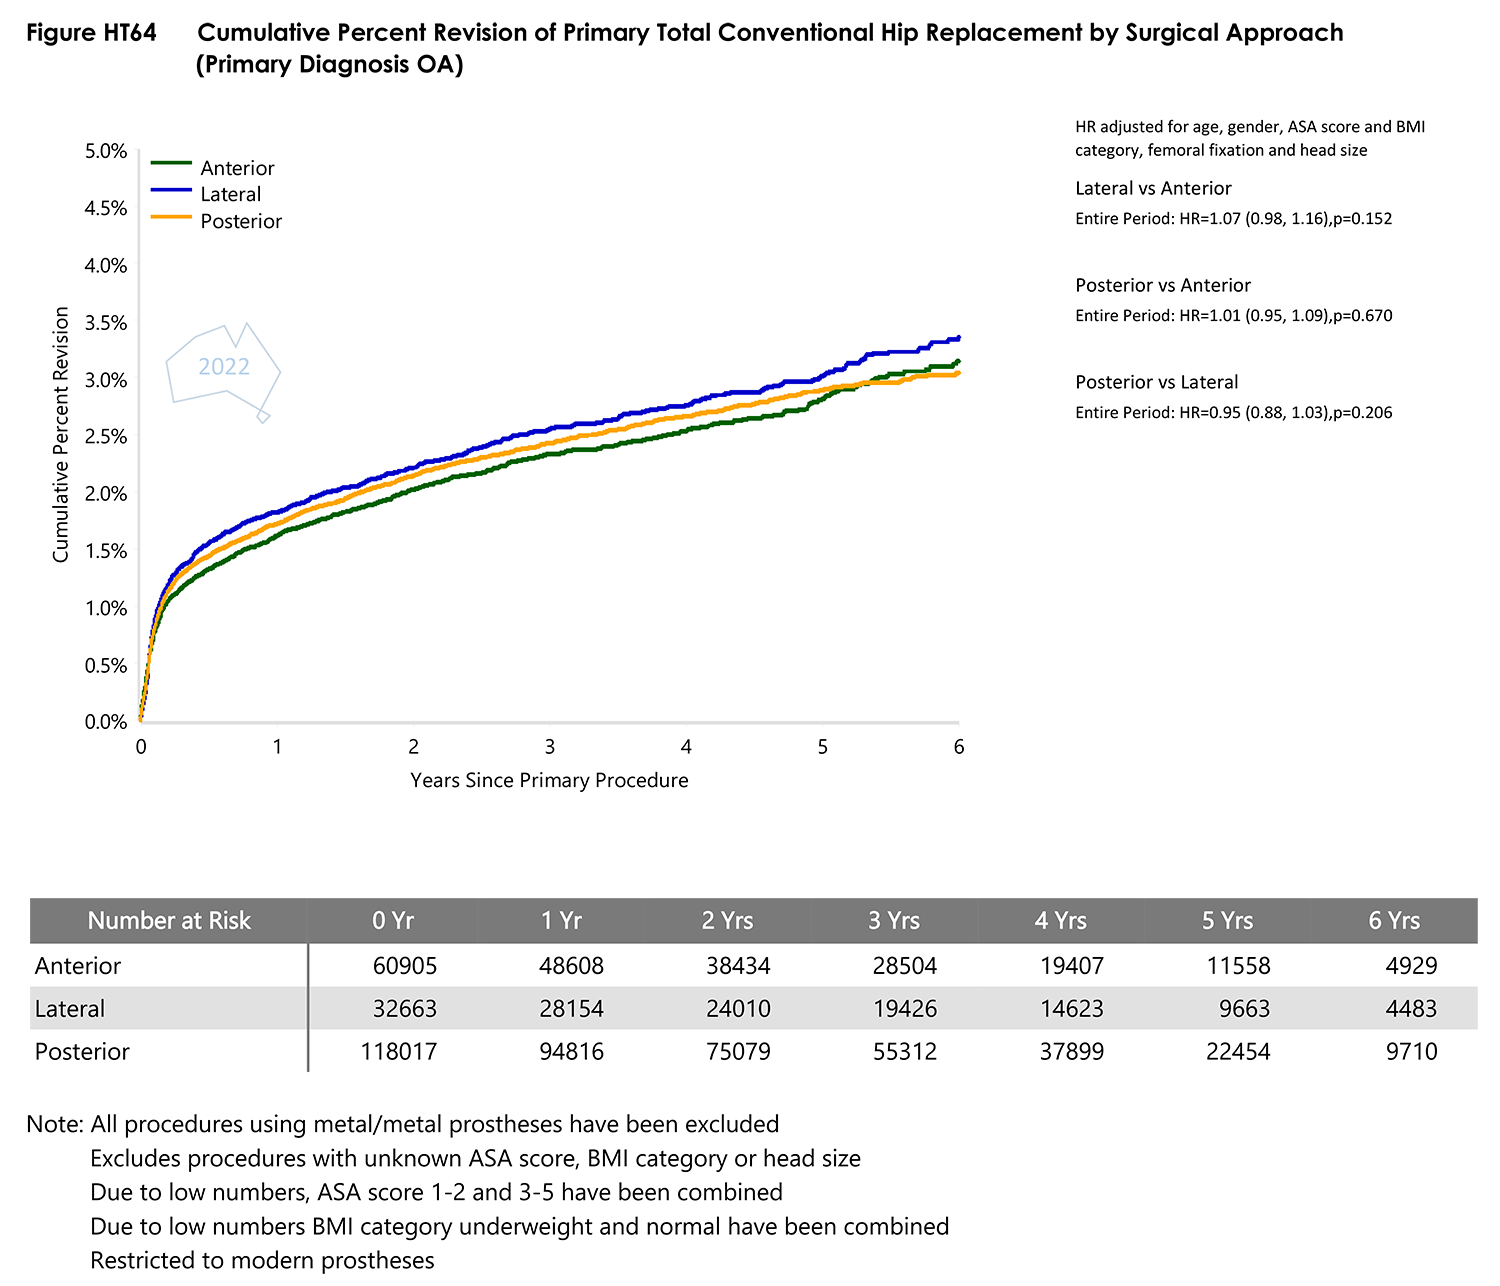
- Figure HT64 Cumulative Percent Revision of Primary Total Conventional Hip Replacement by Surgical ApproachPDF · 190 KB
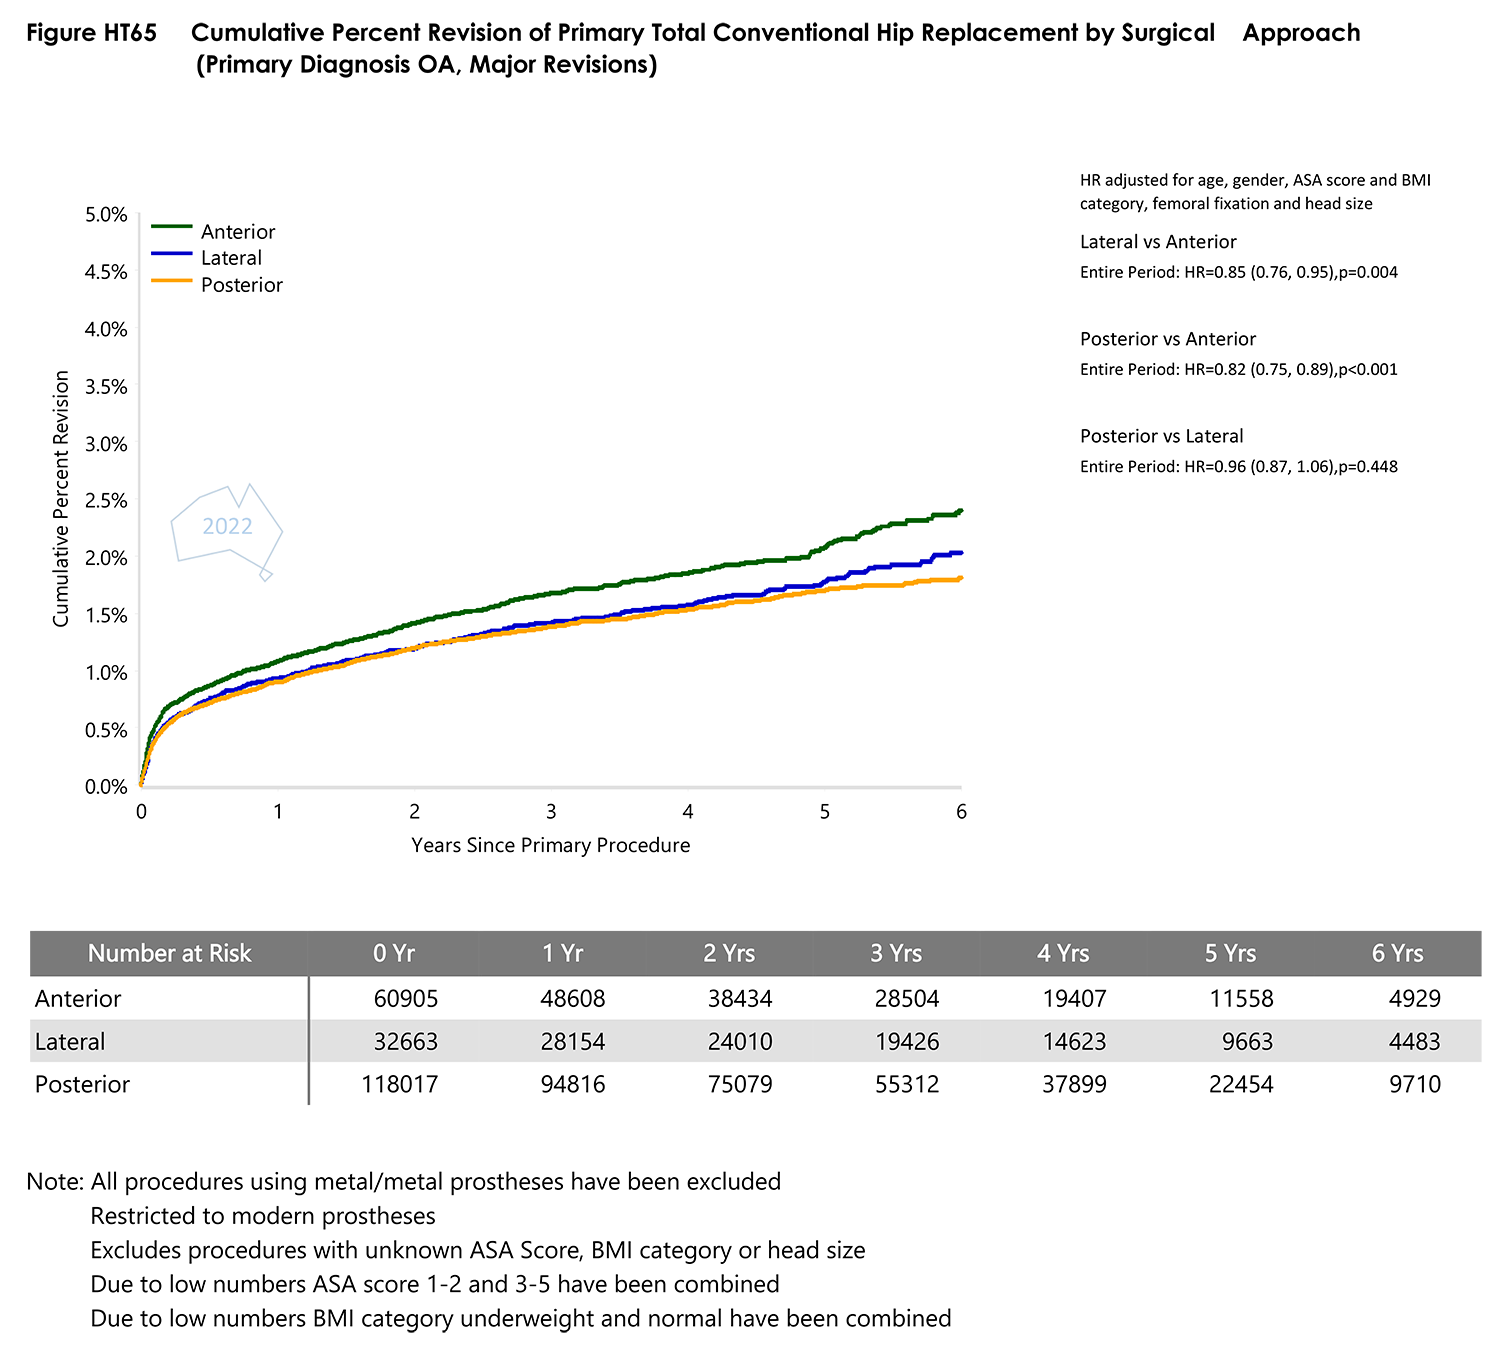
- Figure HT65 Cumulative Percent Revision of Primary Total Conventional Hip Replacement by Surgical ApproachPDF · 176 KB
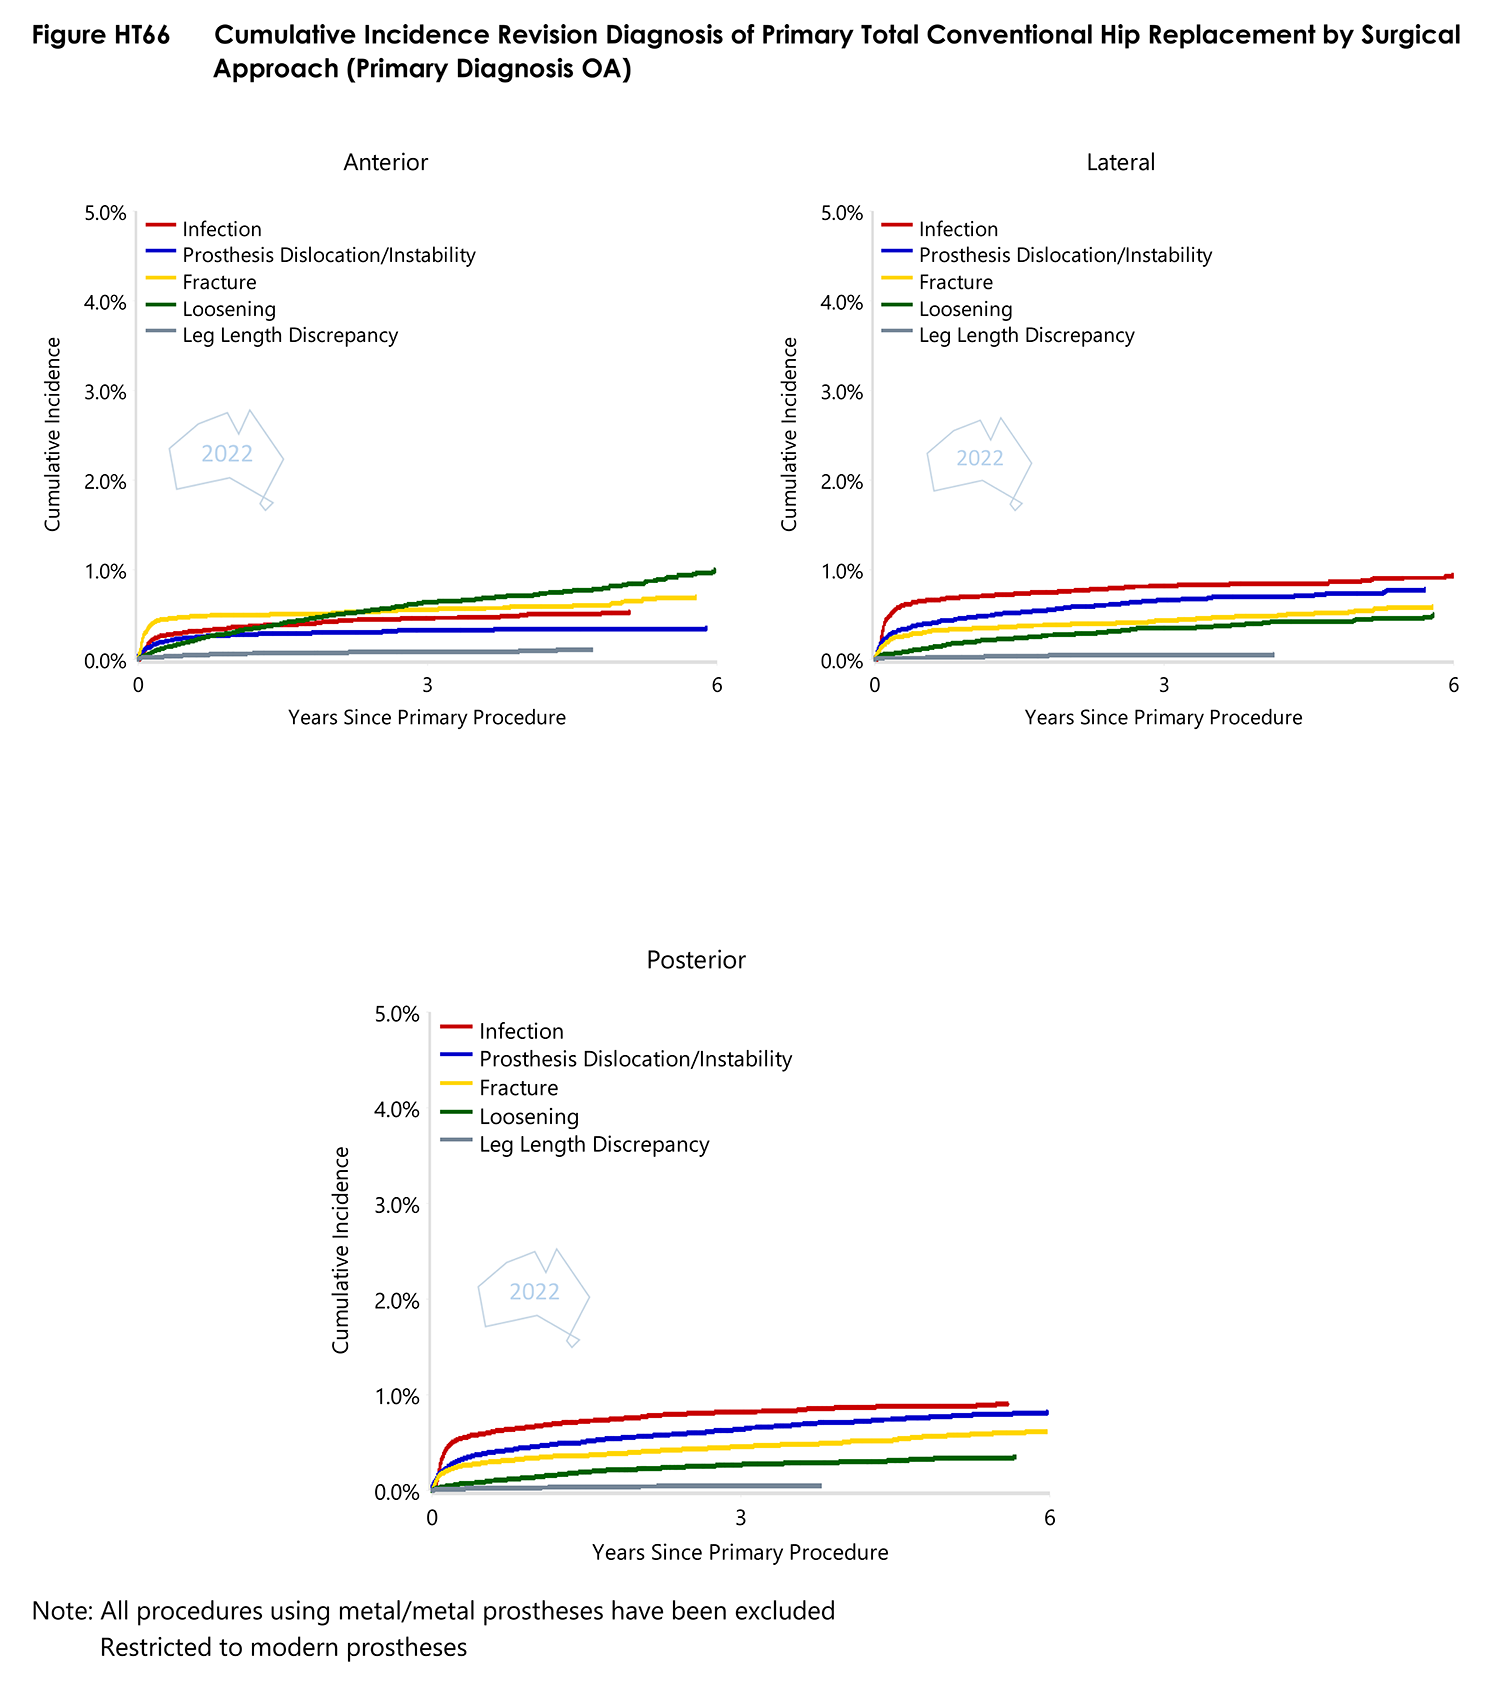
- Figure HT66 Cumulative Incidence Revision Diagnosis of Primary Total Conventional Hip Replacement by Surgical ApproachPDF · 174 KB
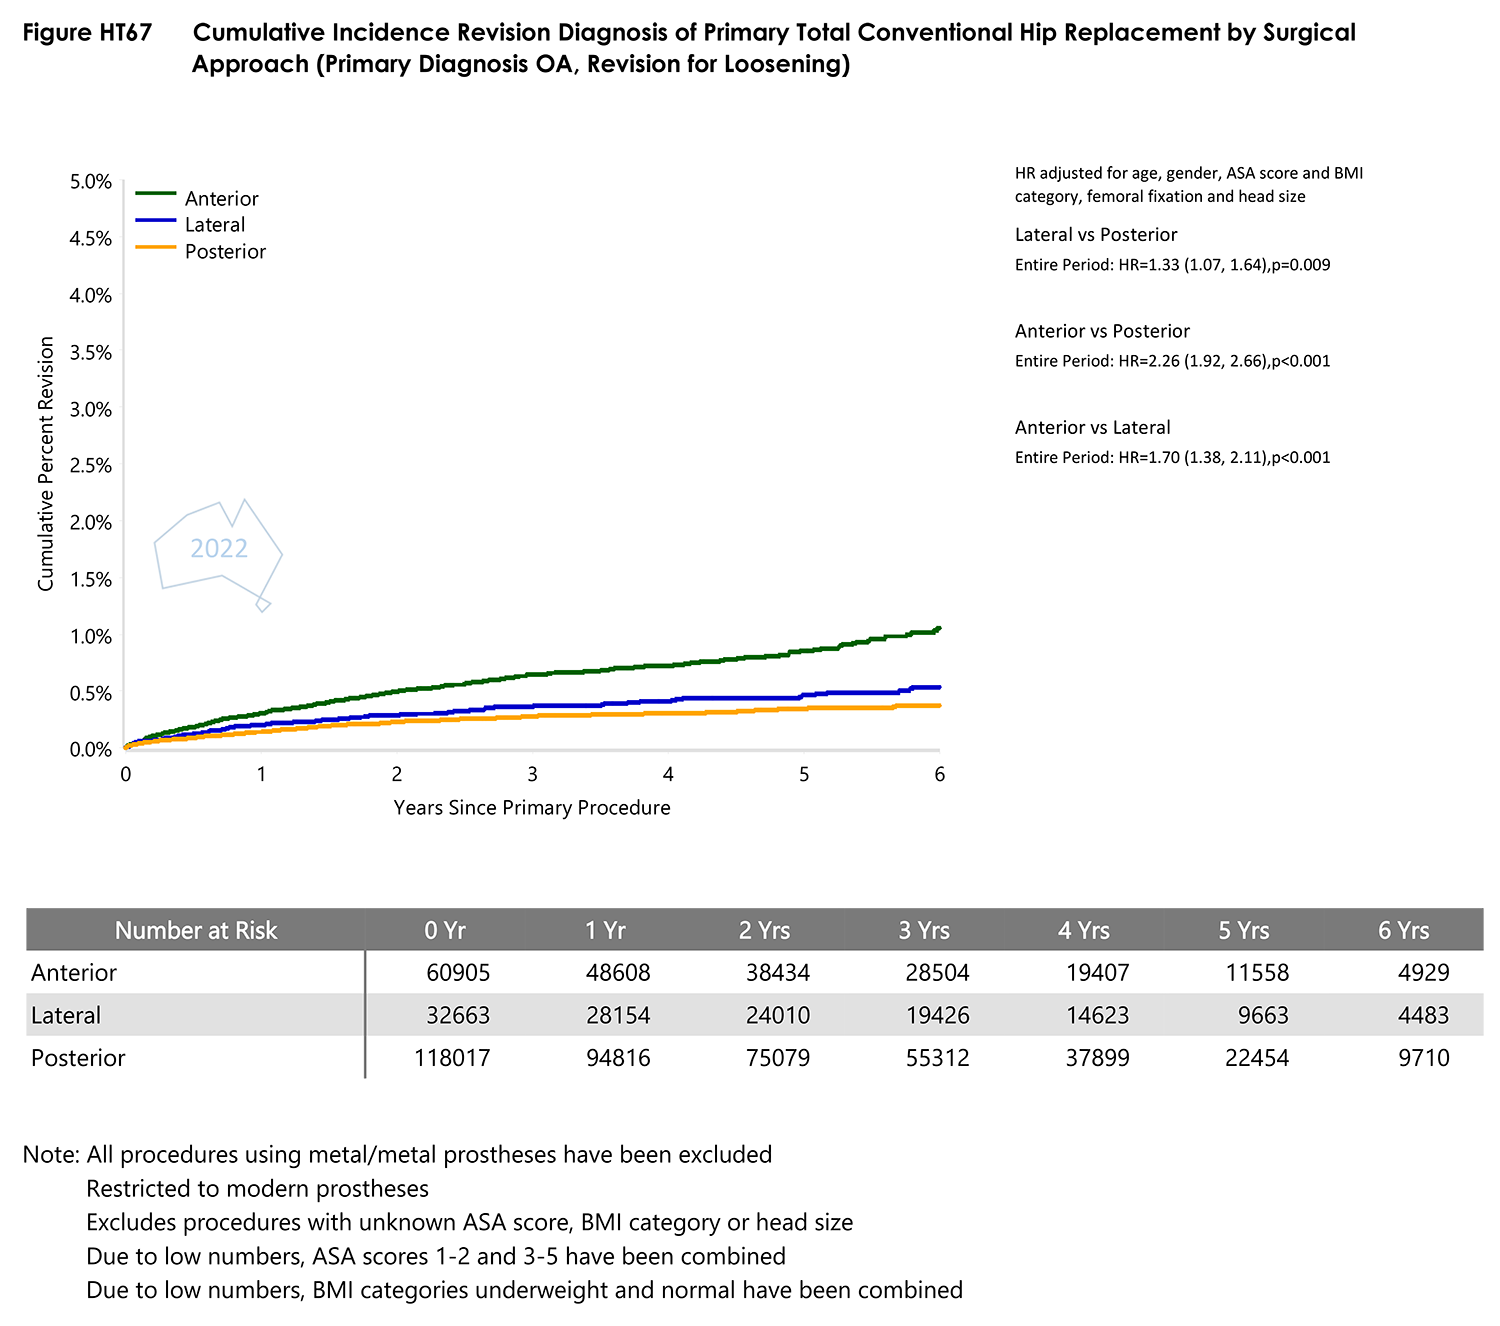
- Figure HT67 Cumulative Incidence Revision Diagnosis of Primary Total Conventional Hip Replacement by Surgical ApproachPDF · 157 KB
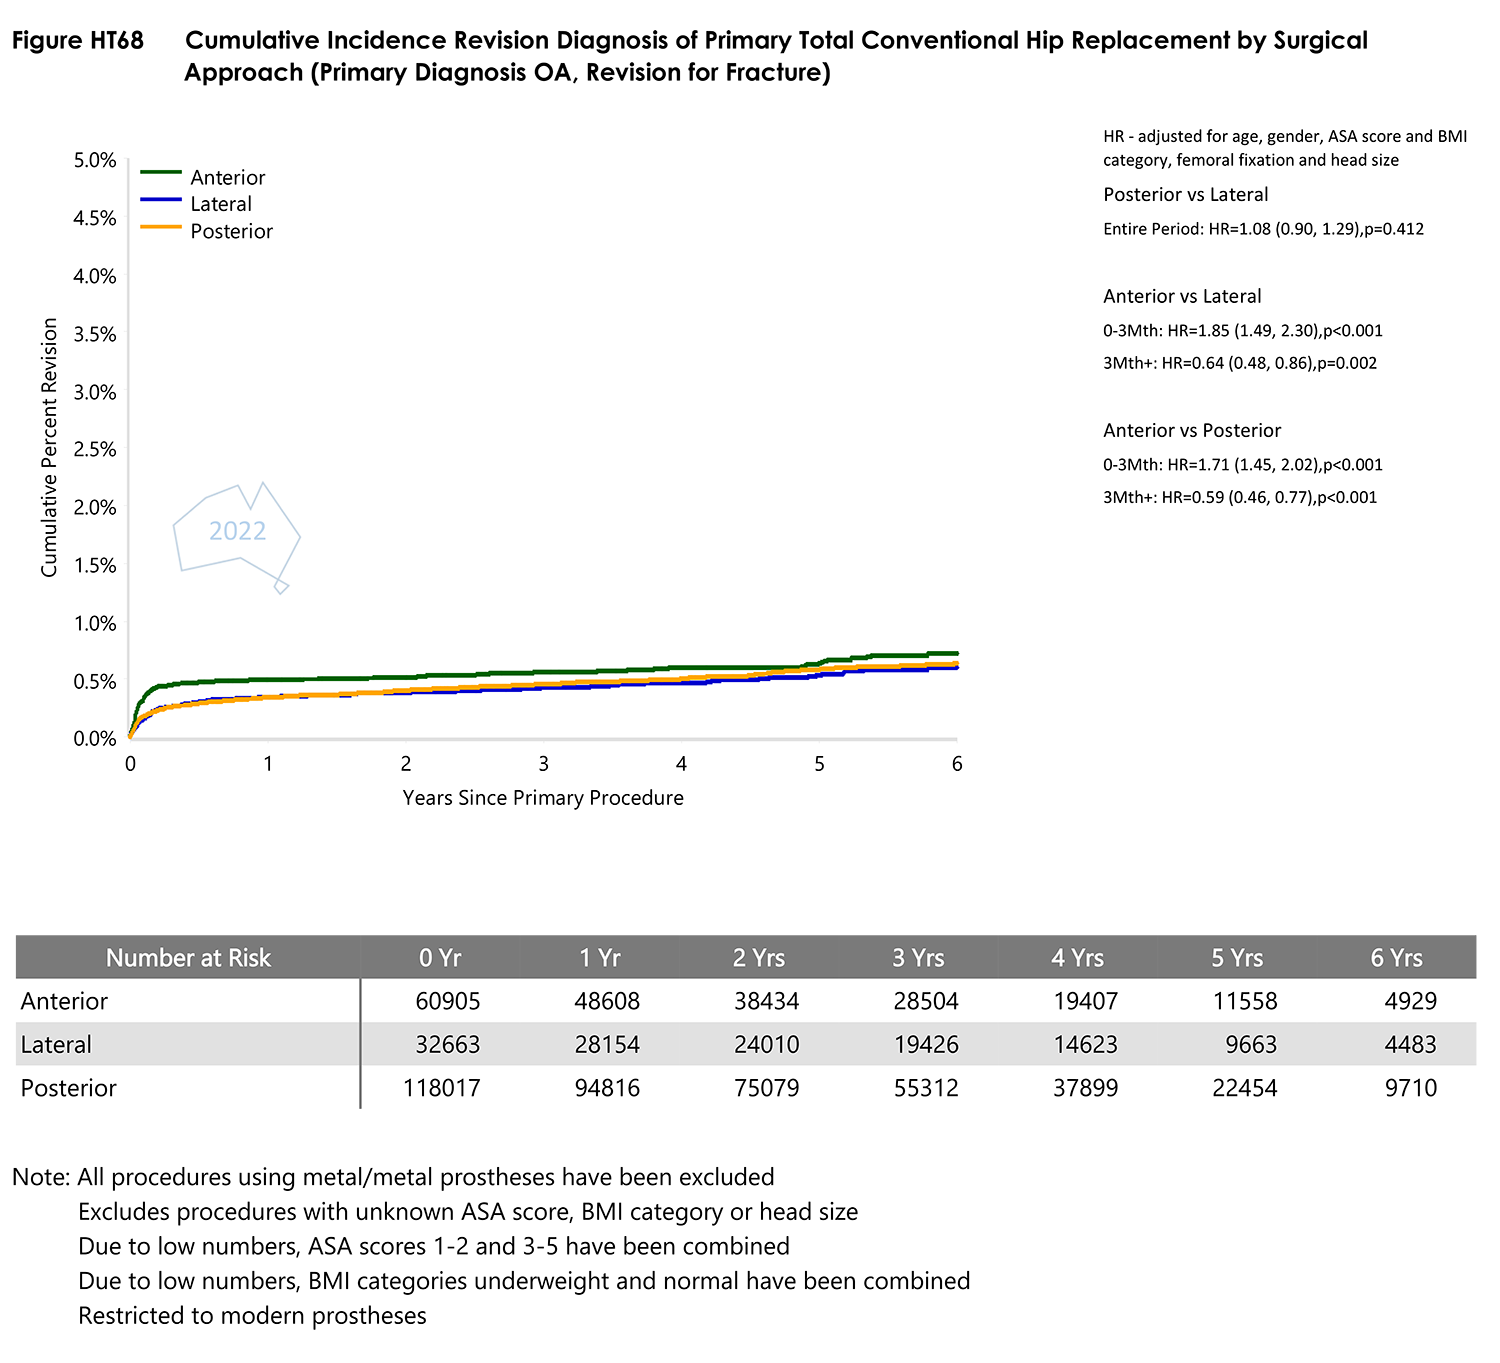
- Figure HT68 Cumulative Incidence Revision Diagnosis of Primary Total Conventional Hip Replacement by Surgical ApproachPDF · 164 KB
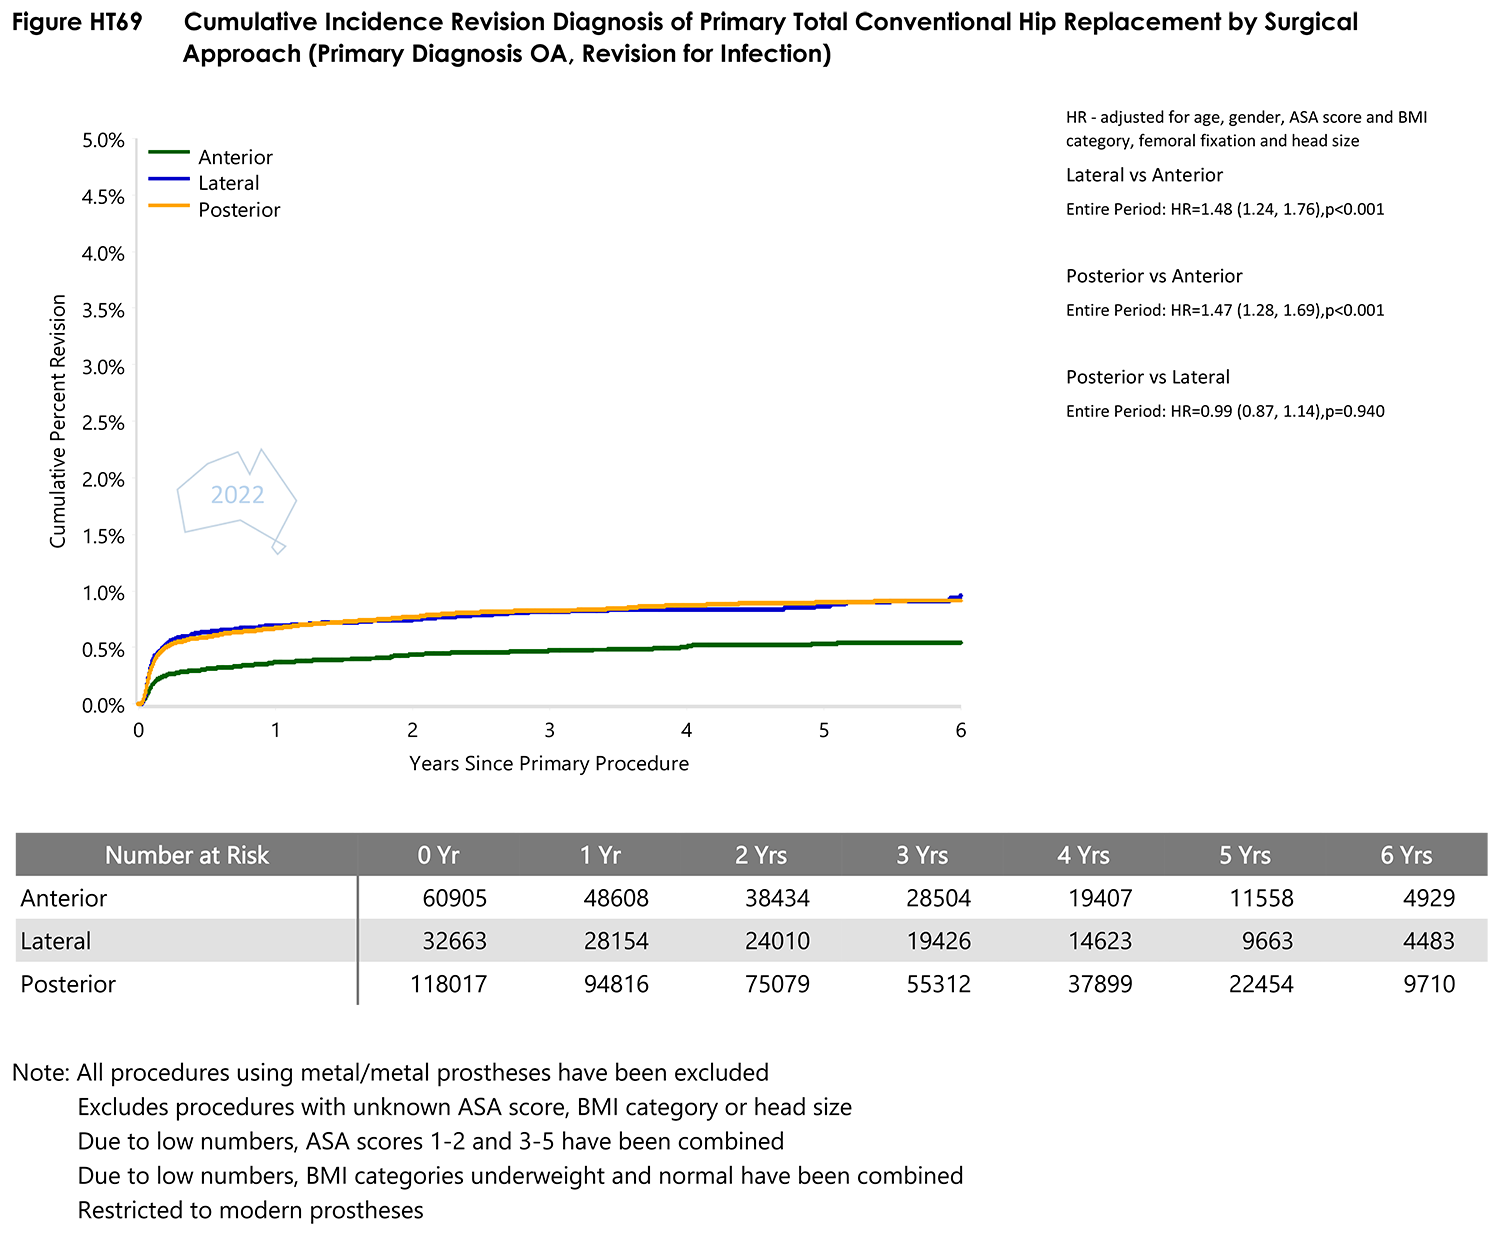
- Figure HT69 Cumulative Incidence Revision Diagnosis of Primary Total Conventional Hip Replacement by Surgical ApproachPDF · 164 KB
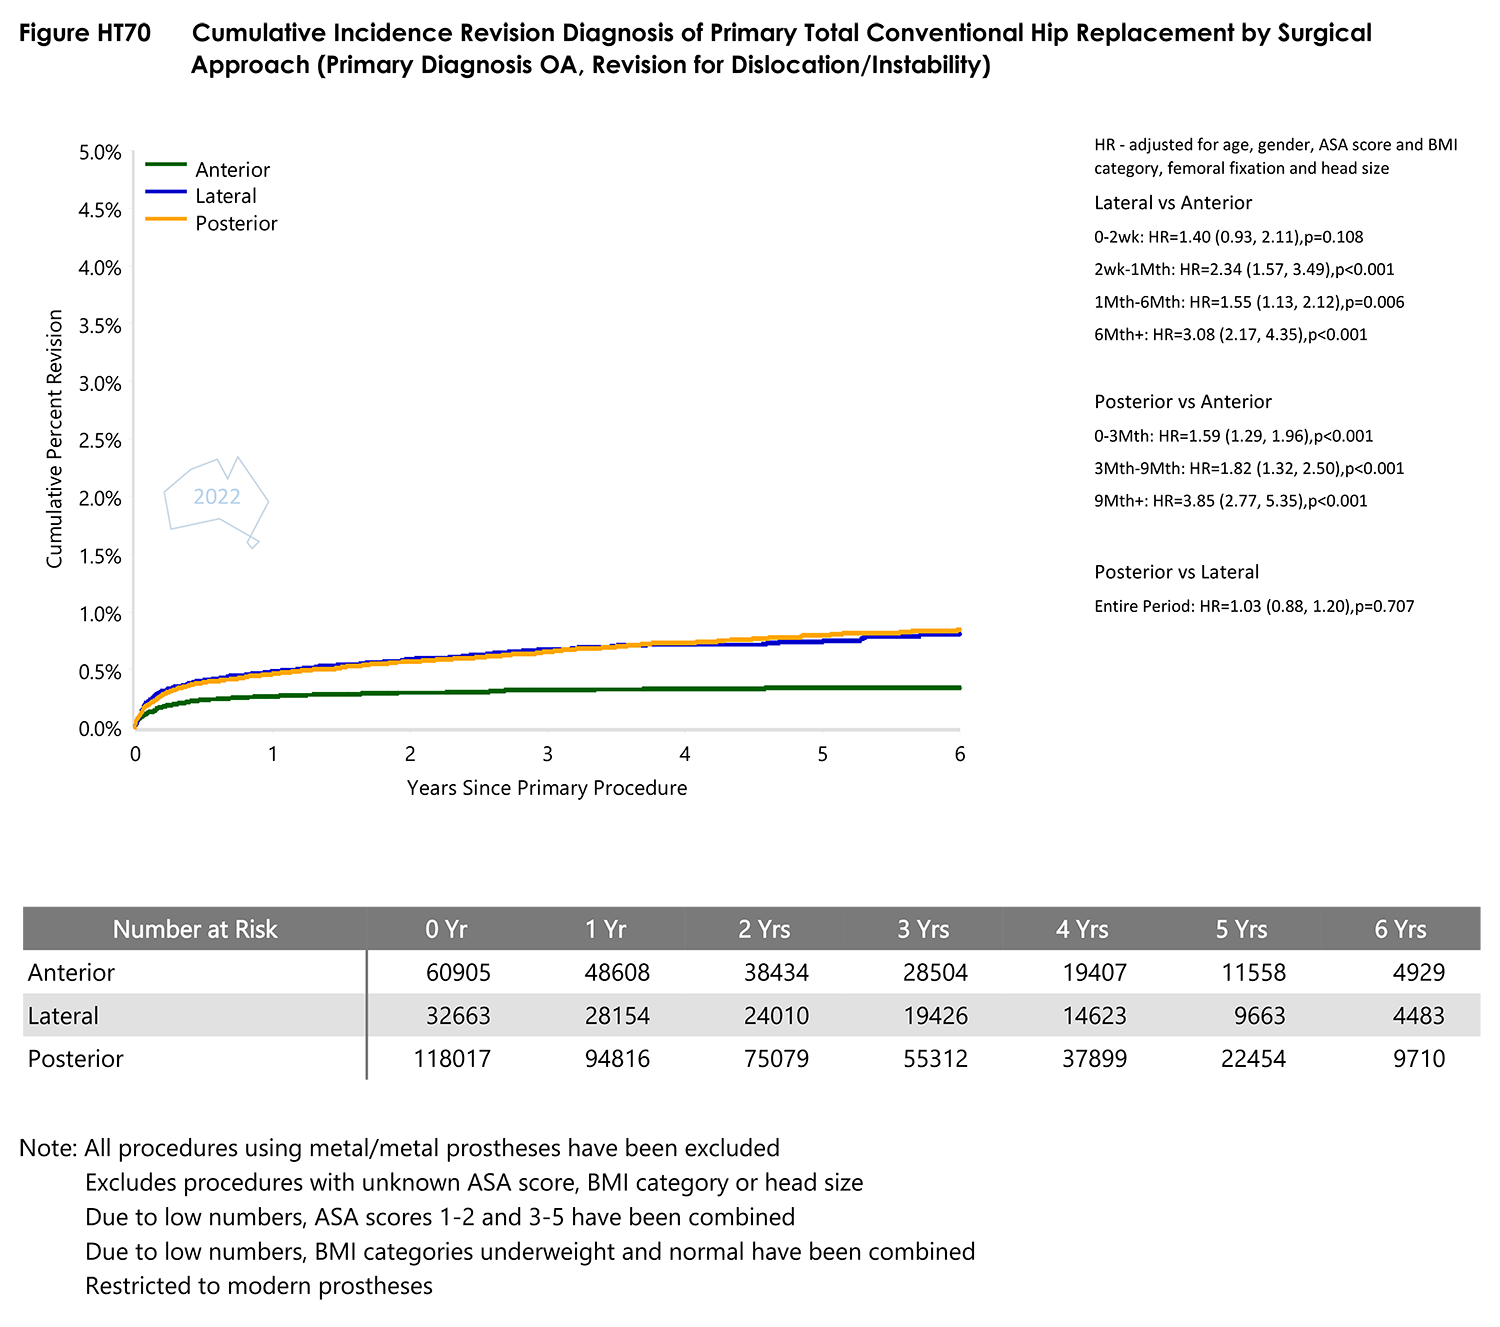
- Figure HT70 Cumulative Incidence Revision Diagnosis of Primary Total Conventional Hip Replacement by Surgical ApproachPDF · 170 KB
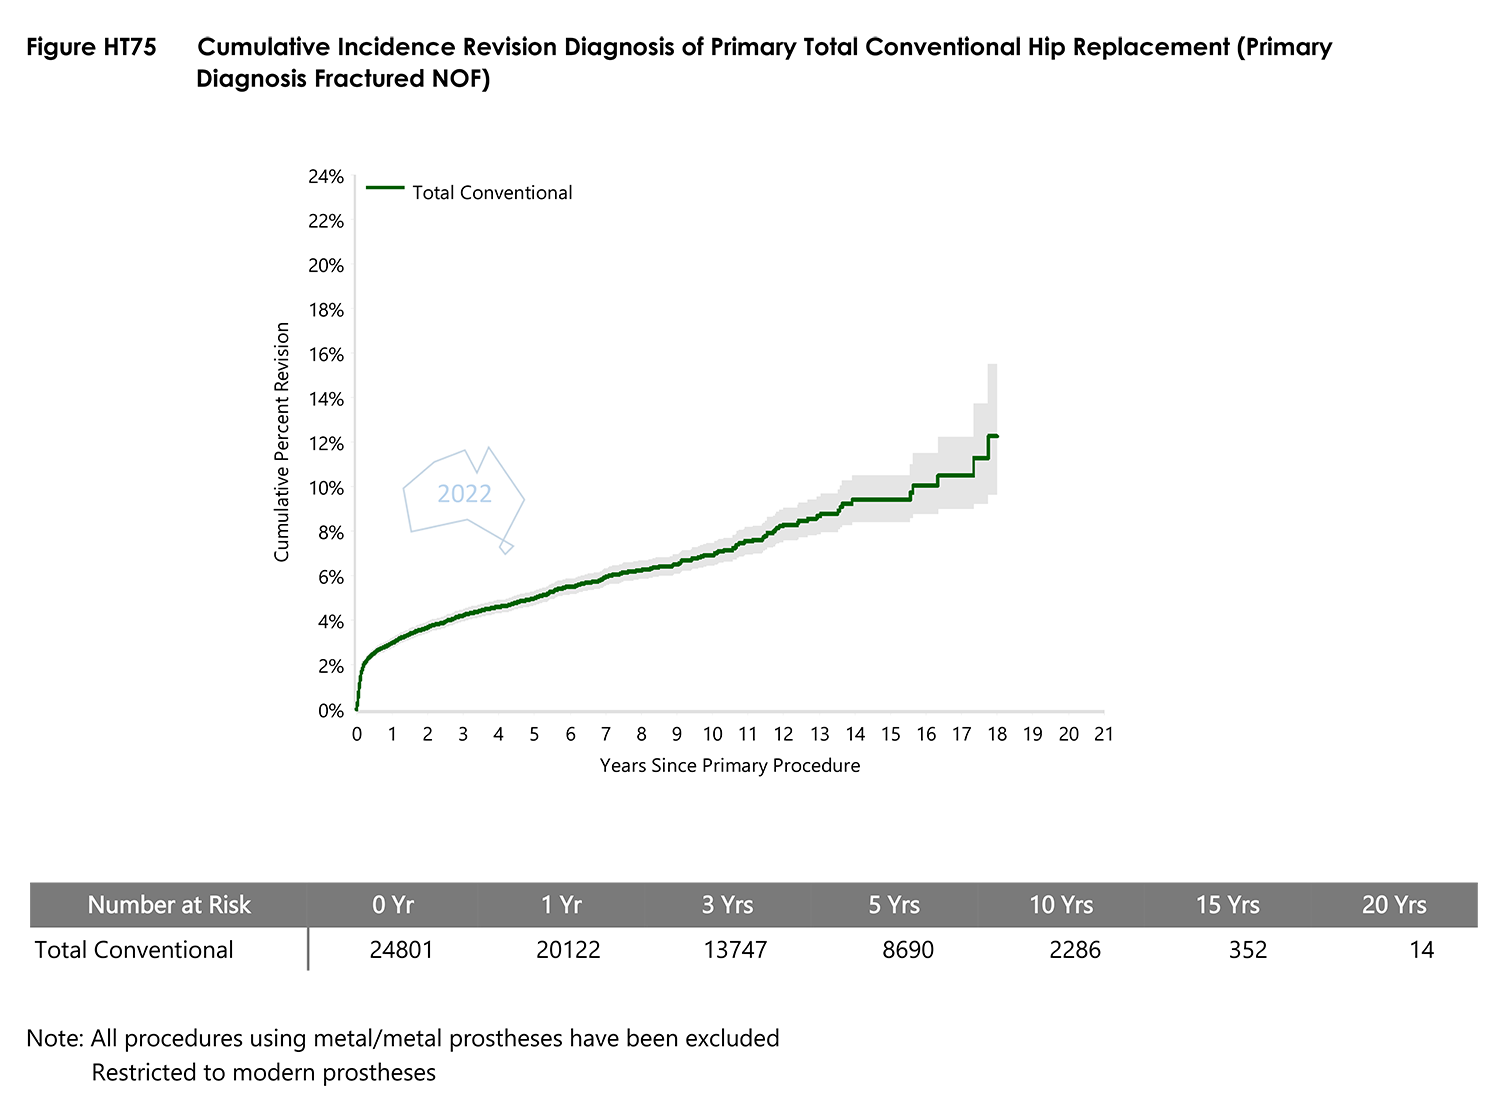
- Figure HT75 Cumulative Incidence Revision Diagnosis of Primary Total Conventional Hip ReplacementPDF · 83 KB
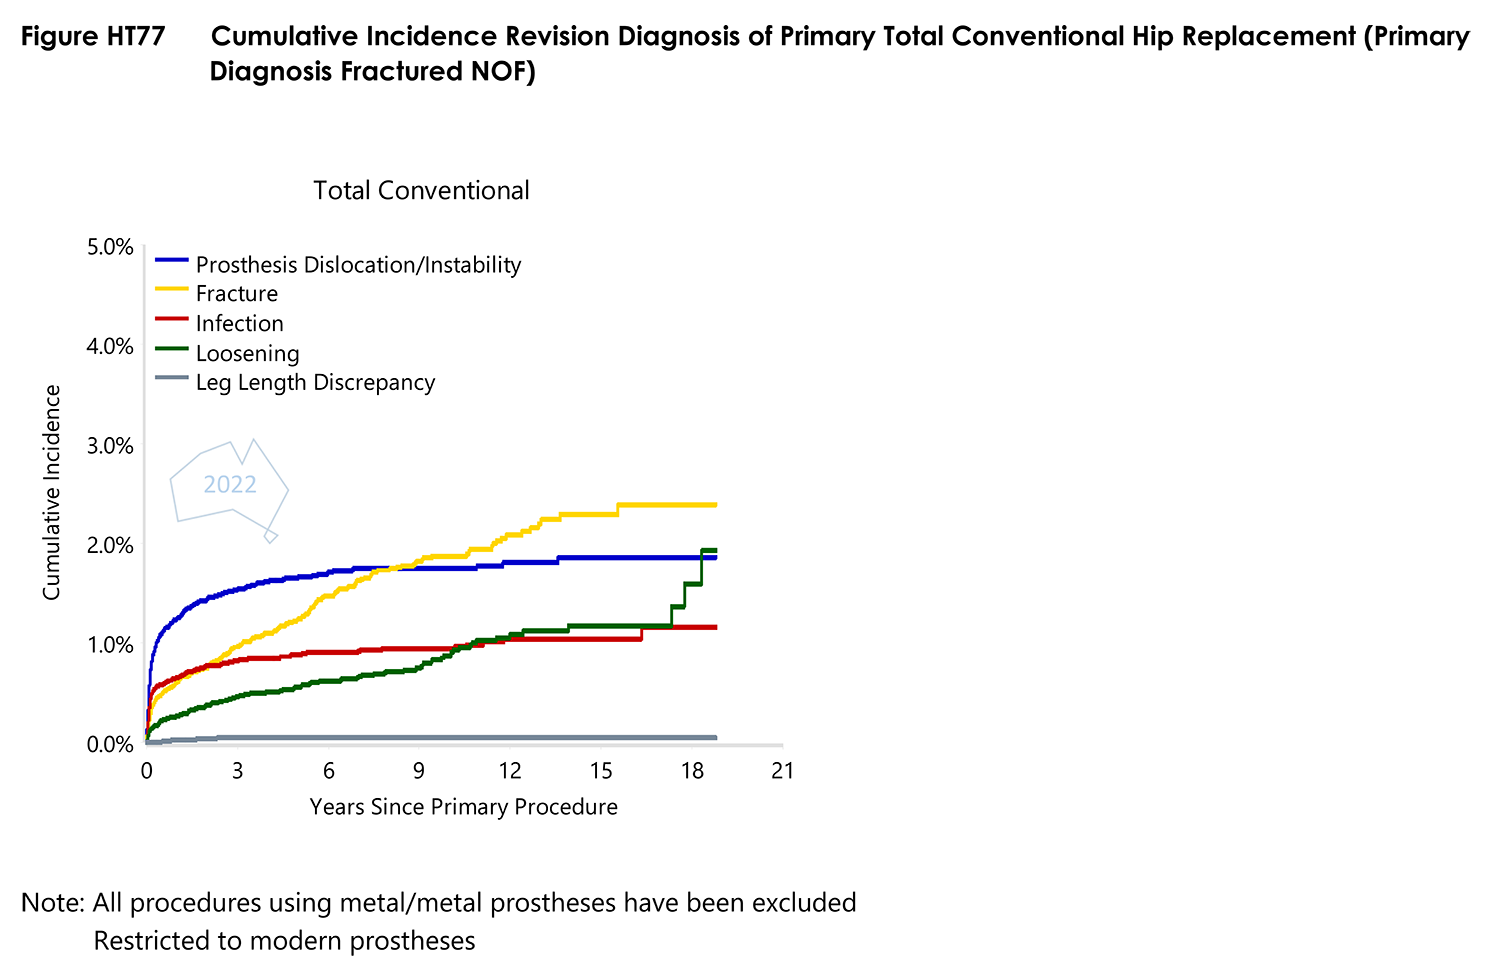
- Figure HT77 Cumulative Incidence Revision Diagnosis of Primary Total Conventional Hip ReplacementPDF · 78 KB
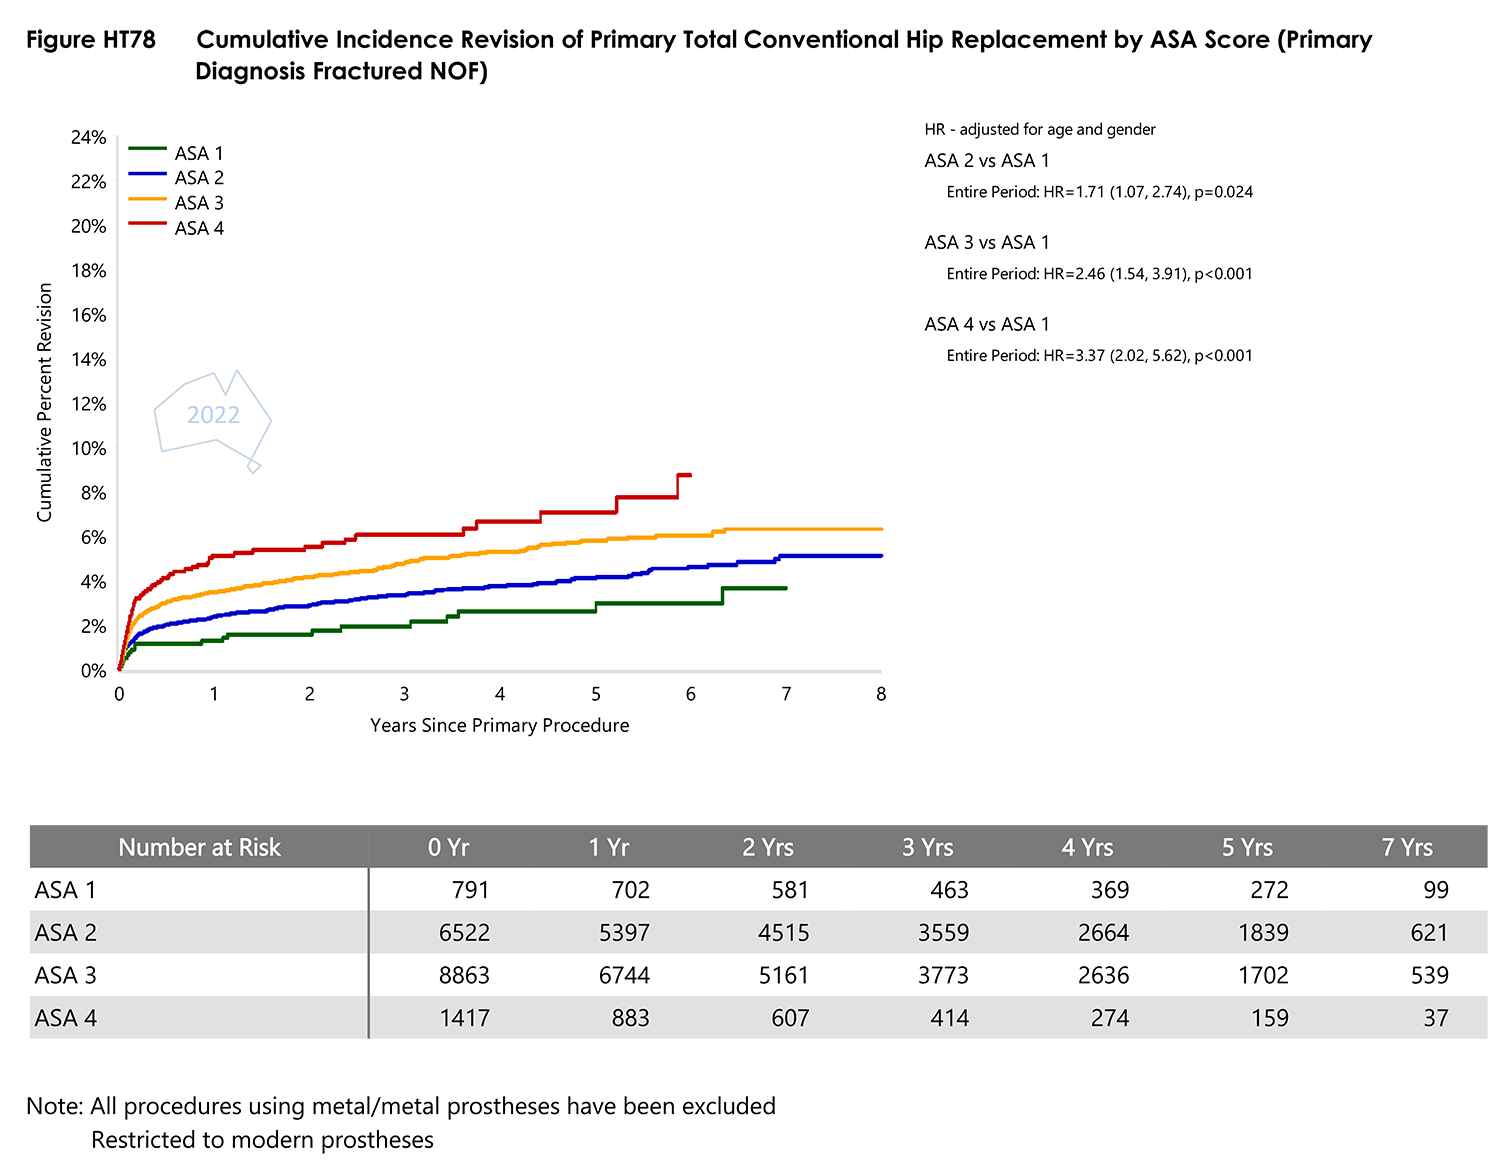
- Figure HT78 Cumulative Incidence Revision of Primary Total Conventional Hip Replacement by ASA ScorePDF · 116 KB
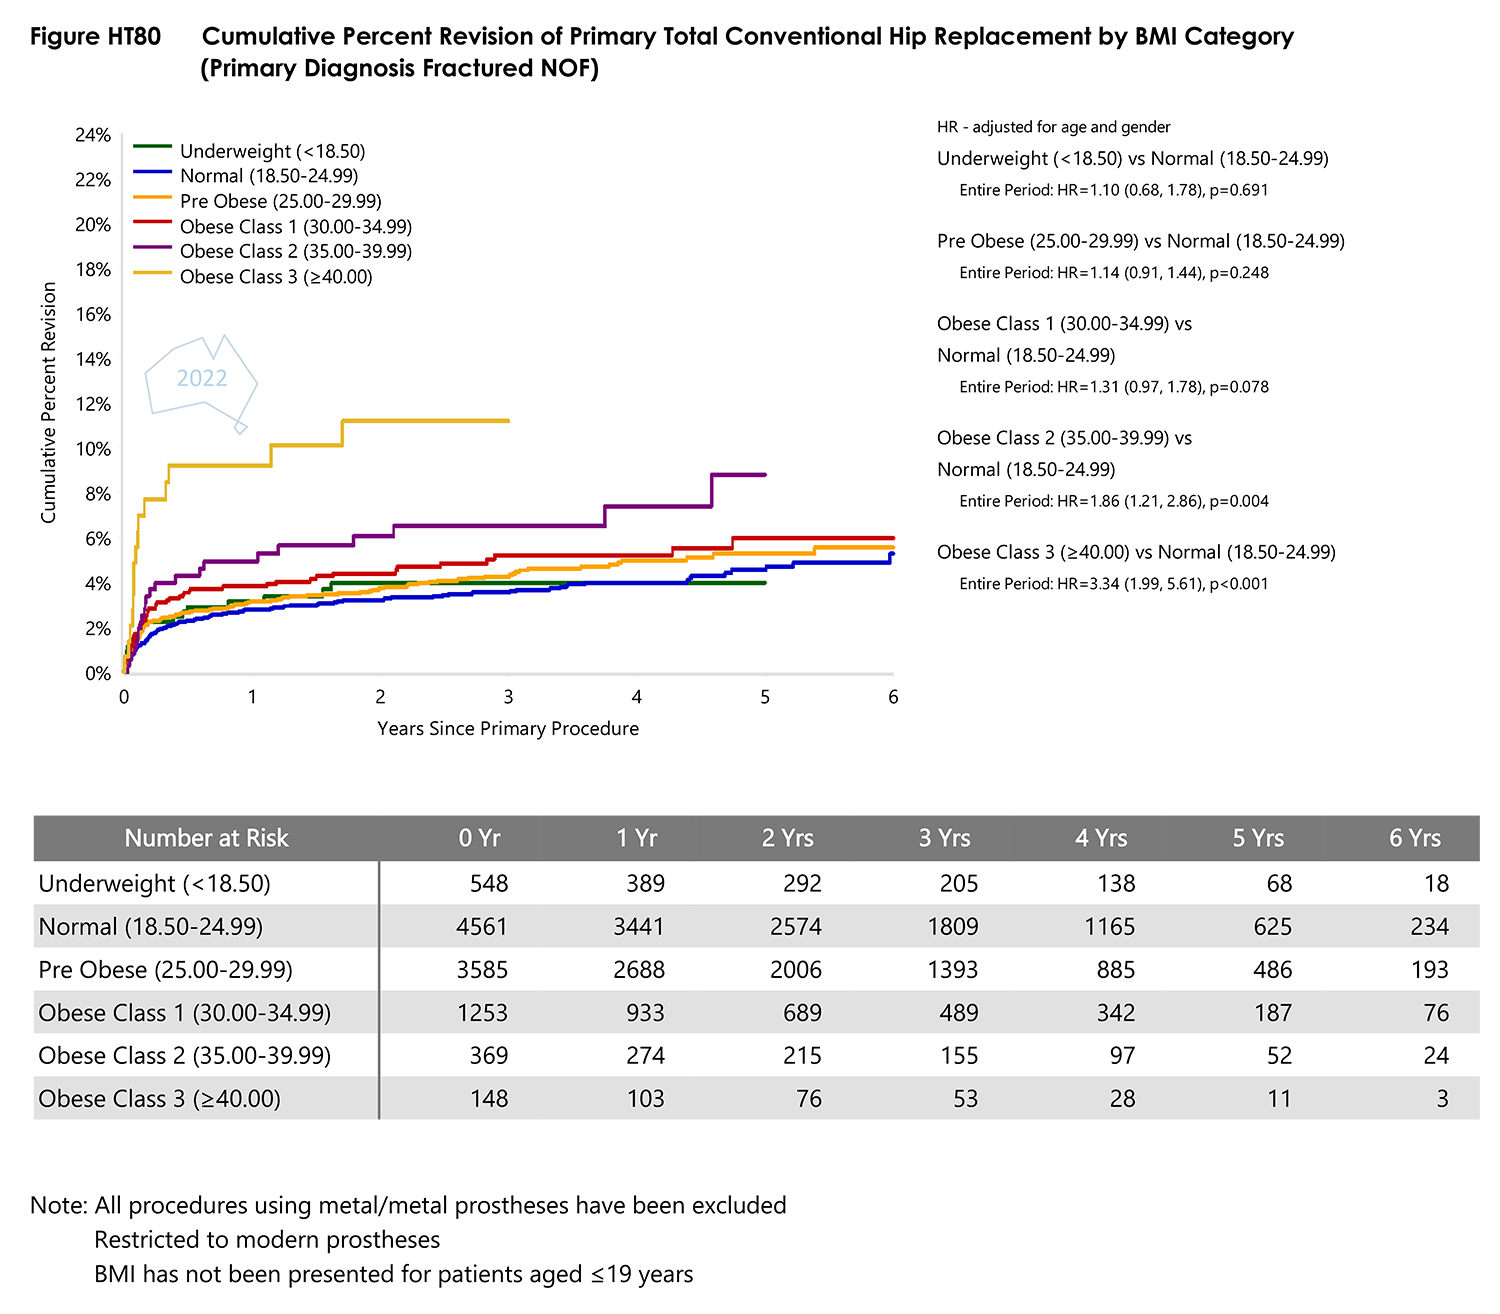
- Figure HT80 Cumulative Percent Revision of Primary Total Conventional Hip Replacement by BMI CategoryPDF · 79 KB
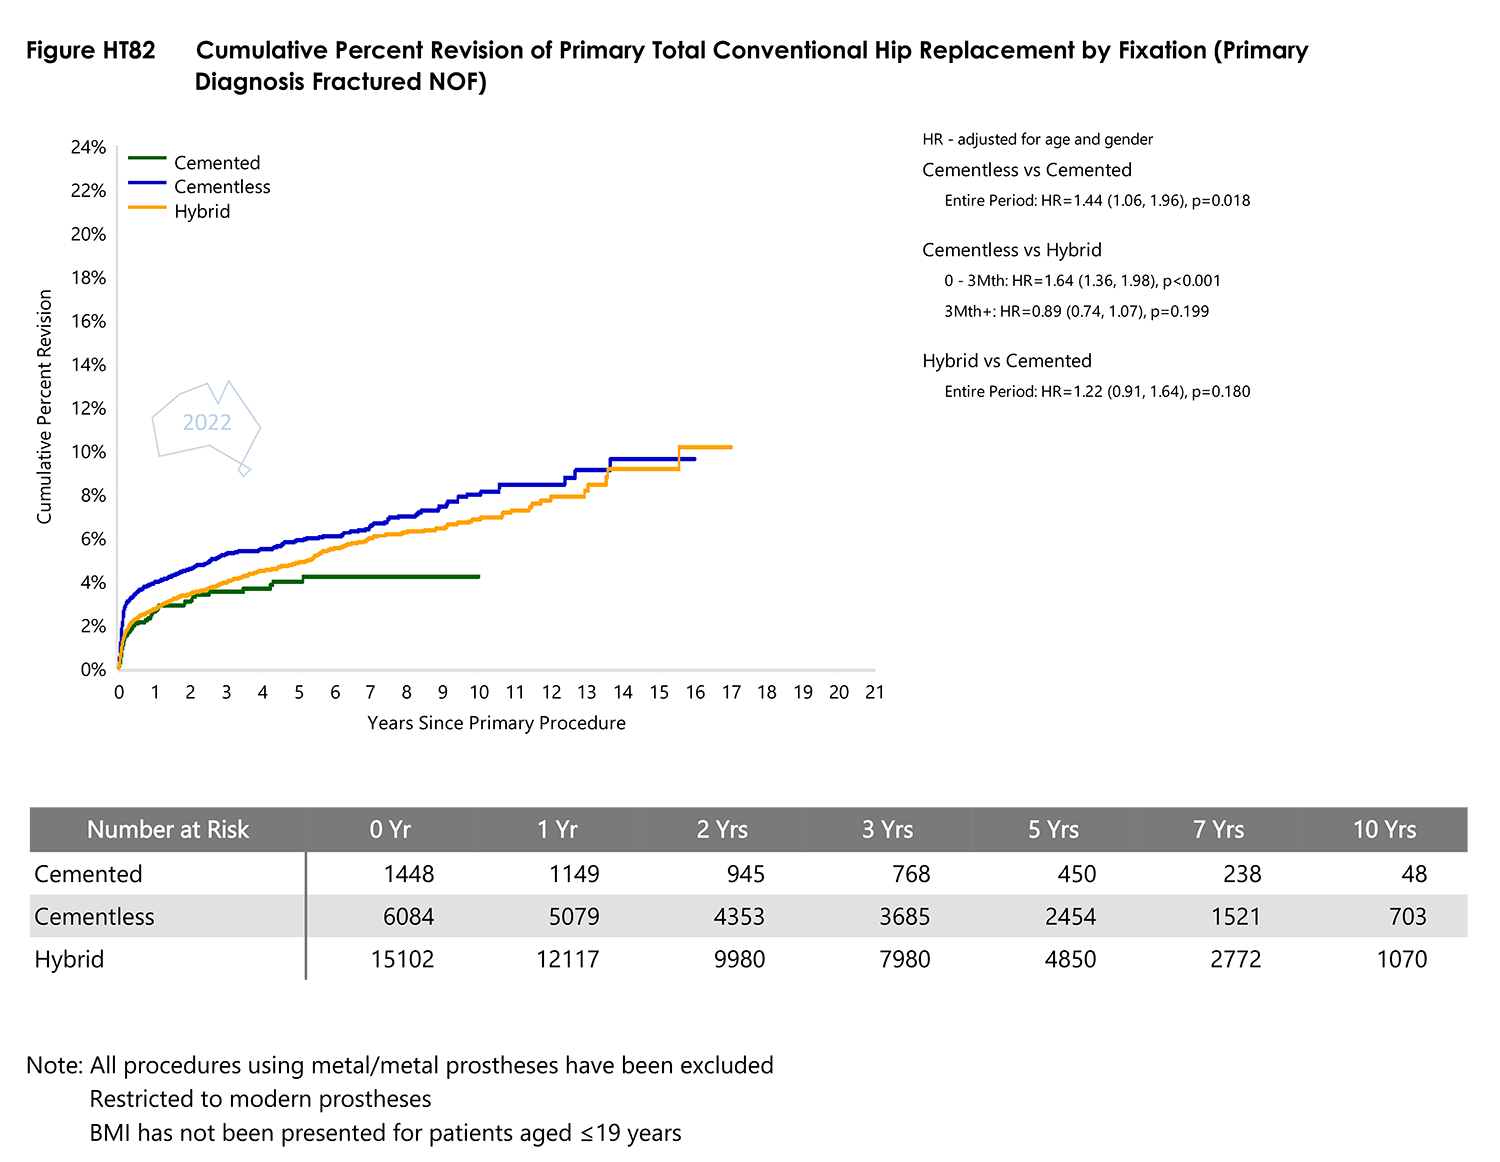
- Figure HT82 Cumulative Percent Revision of Primary Total Conventional Hip Replacement by FixationPDF · 85 KB
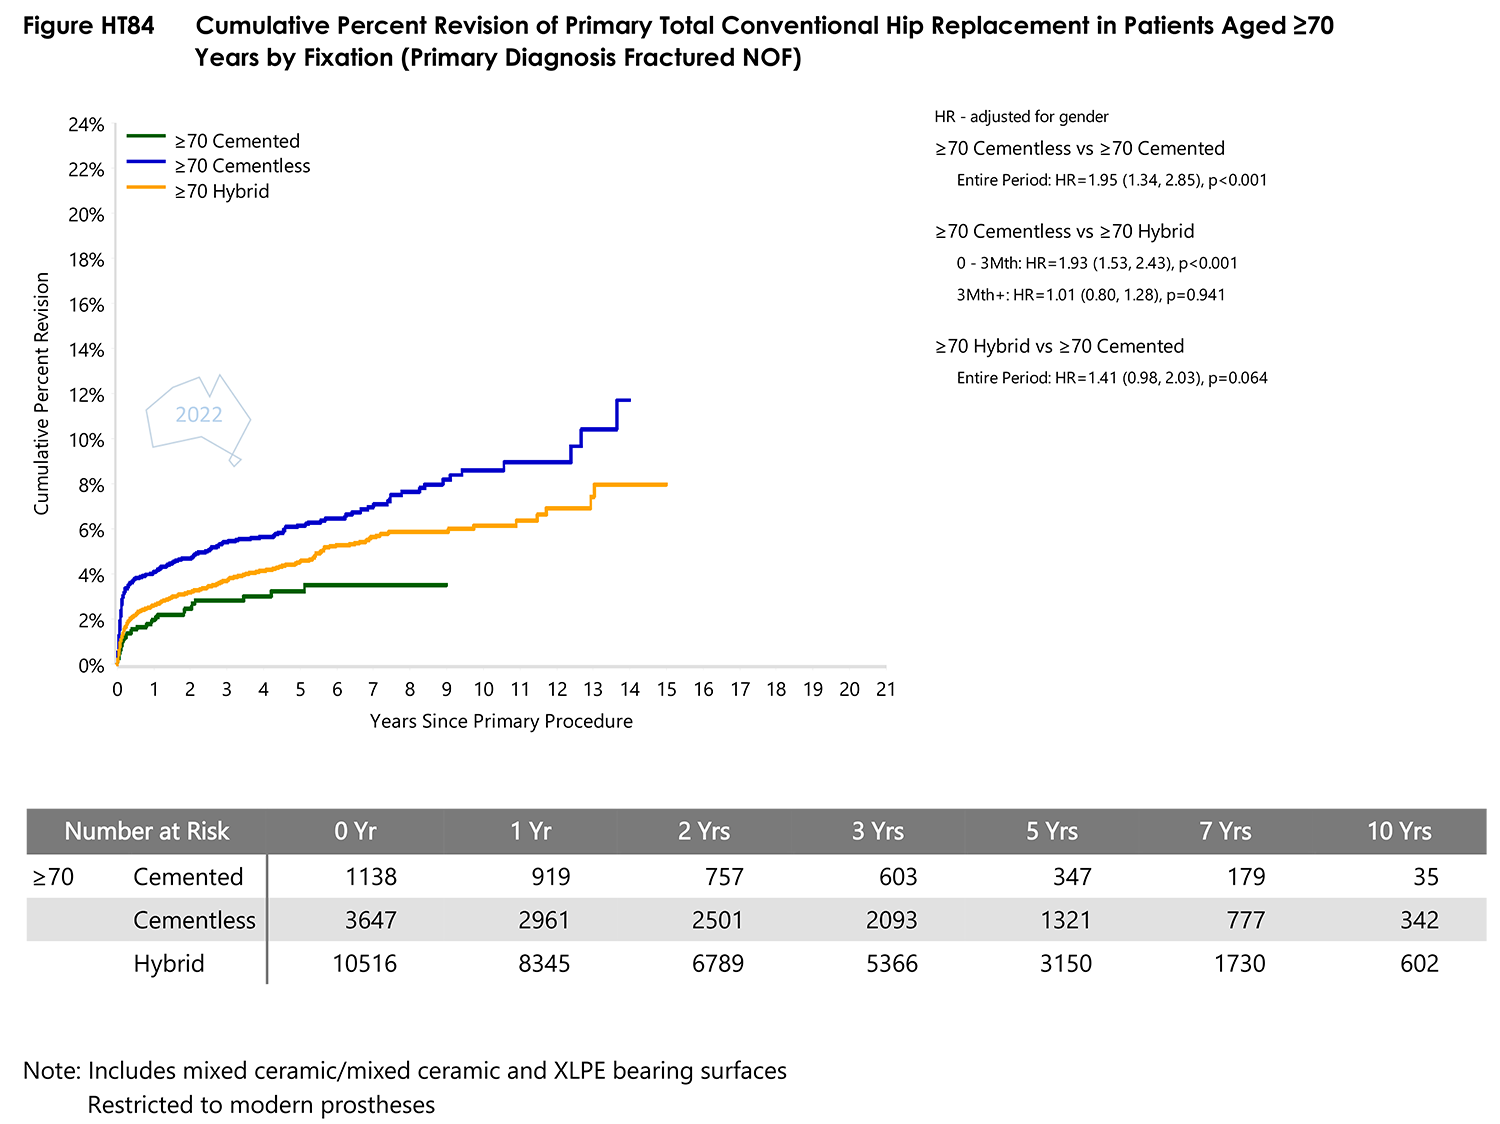
- Figure HT84 Cumulative Percent Revision of Primary Total Conventional Hip Replacement in Patients AgedPDF · 99 KB
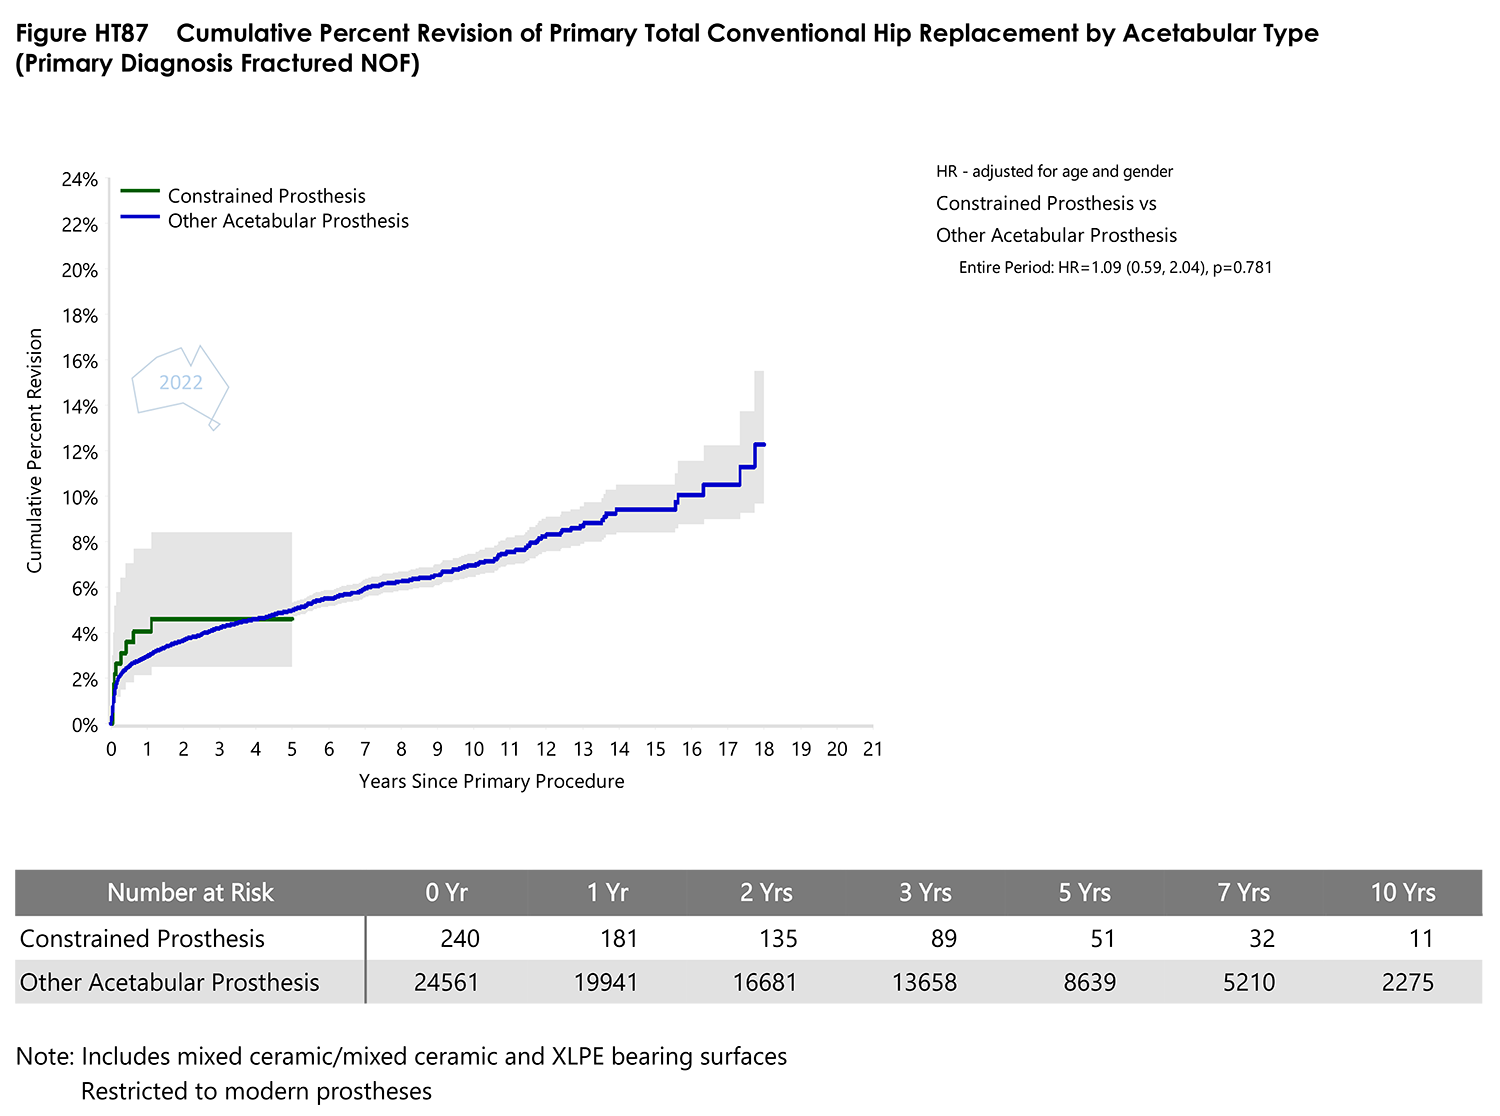
- Figure HT87 Cumulative Percent Revision of Primary Total Conventional Hip Replacement by Acetabular TypePDF · 78 KB
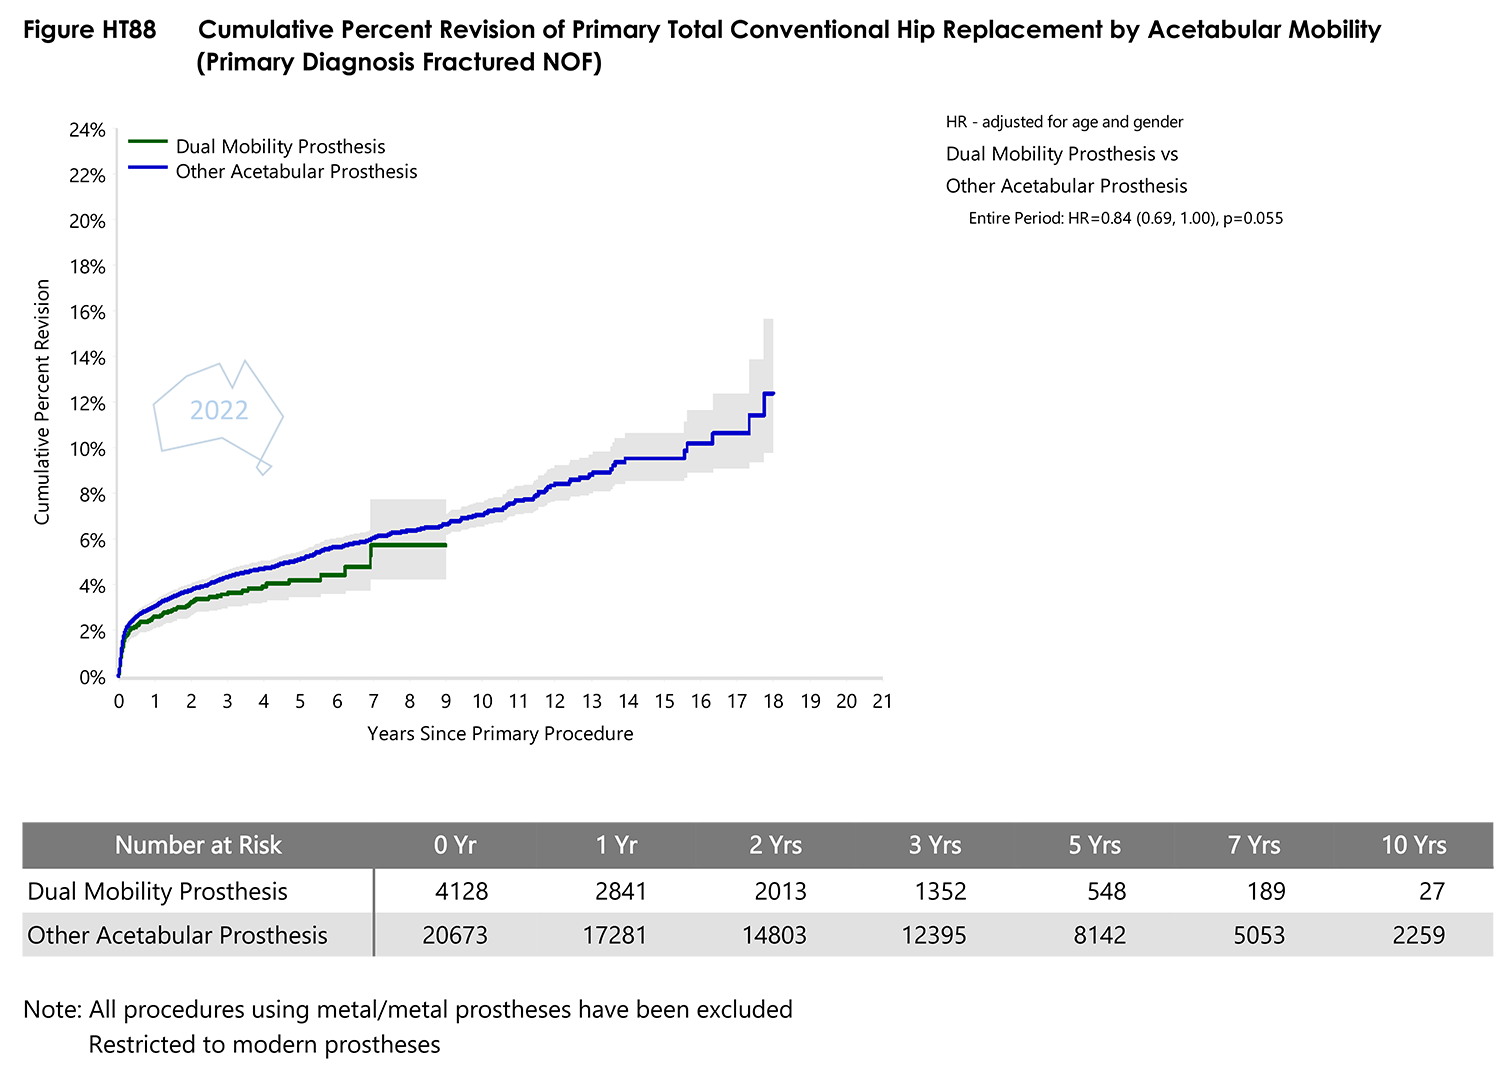
- Figure HT88 Cumulative Percent Revision of Primary Total Conventional Hip Replacement by Acetabular MobilityPDF · 82 KB
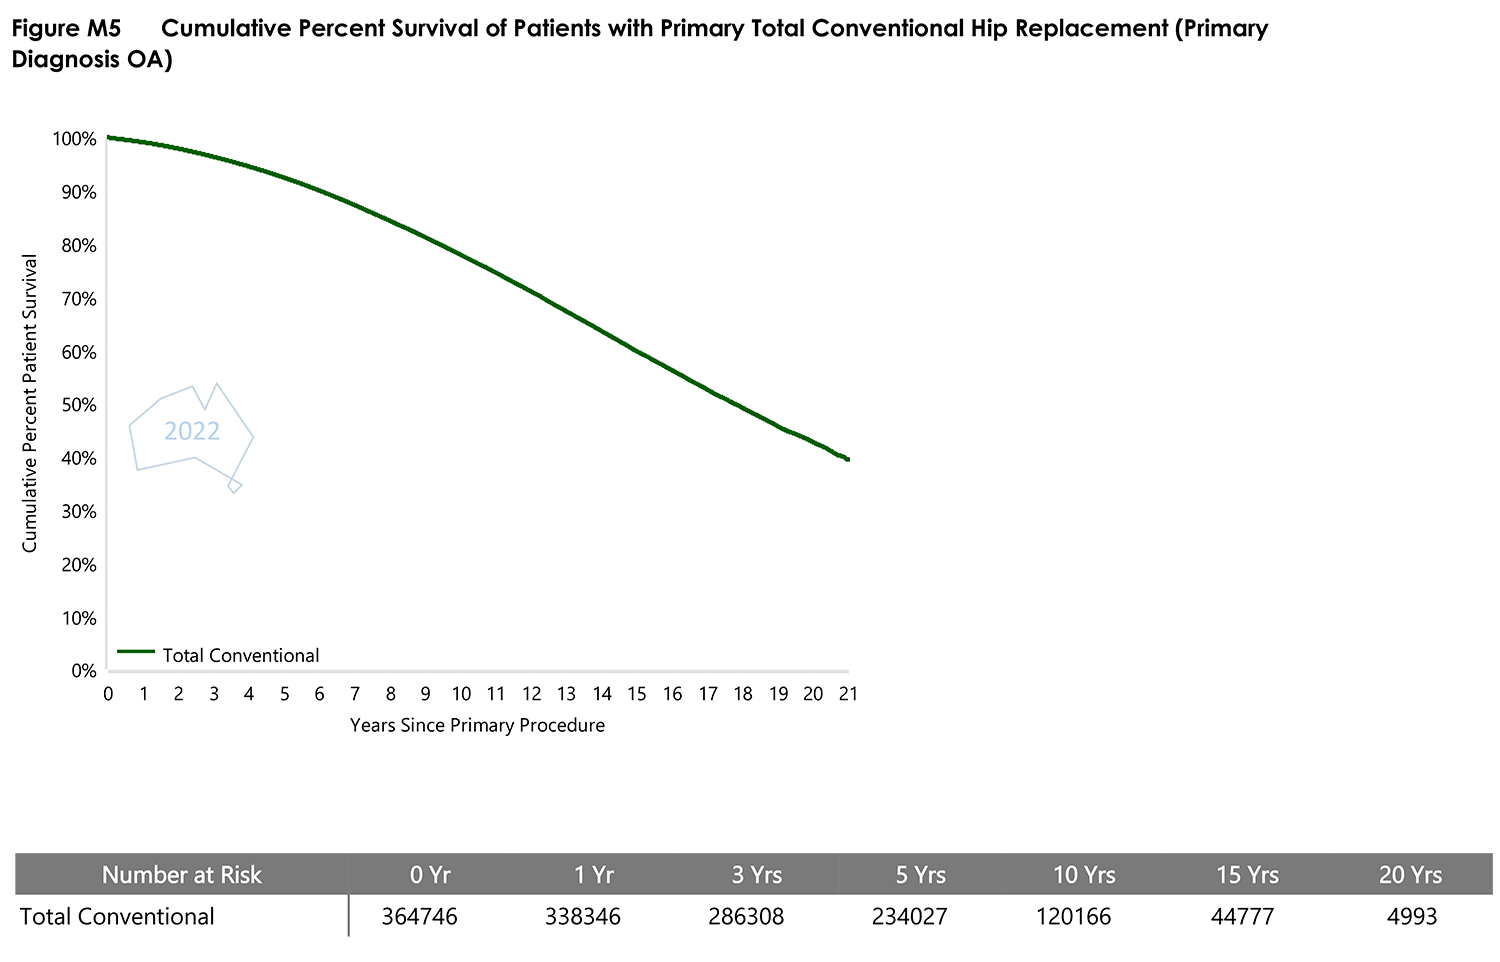
- Figure M5 Cumulative Percent Survival of Patients with Primary Total Conventional Hip ReplacementPDF · 196 KB
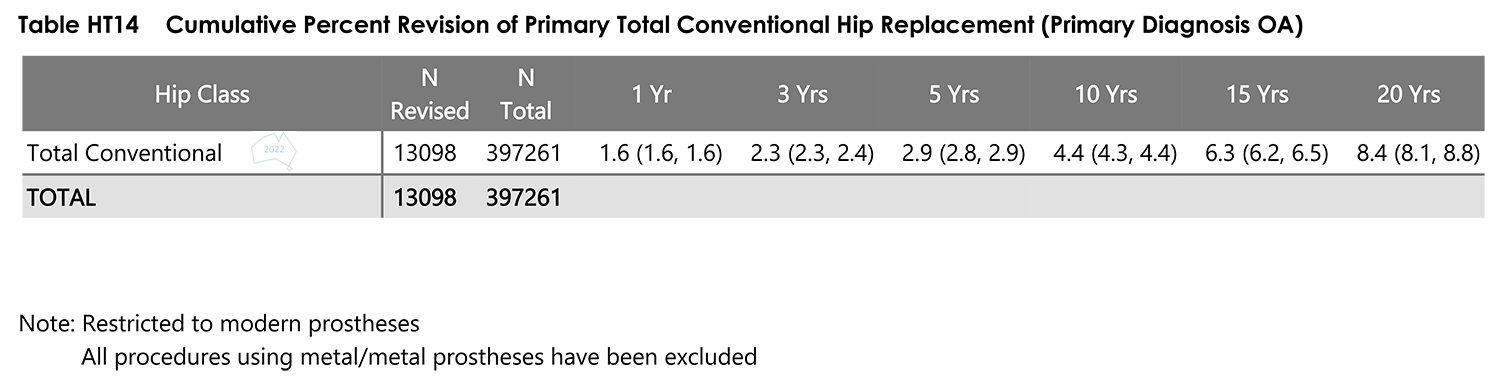
- Table HT14 Cumulative Percent Revision of Primary Total Conventional Hip ReplacementPDF · 46 KB
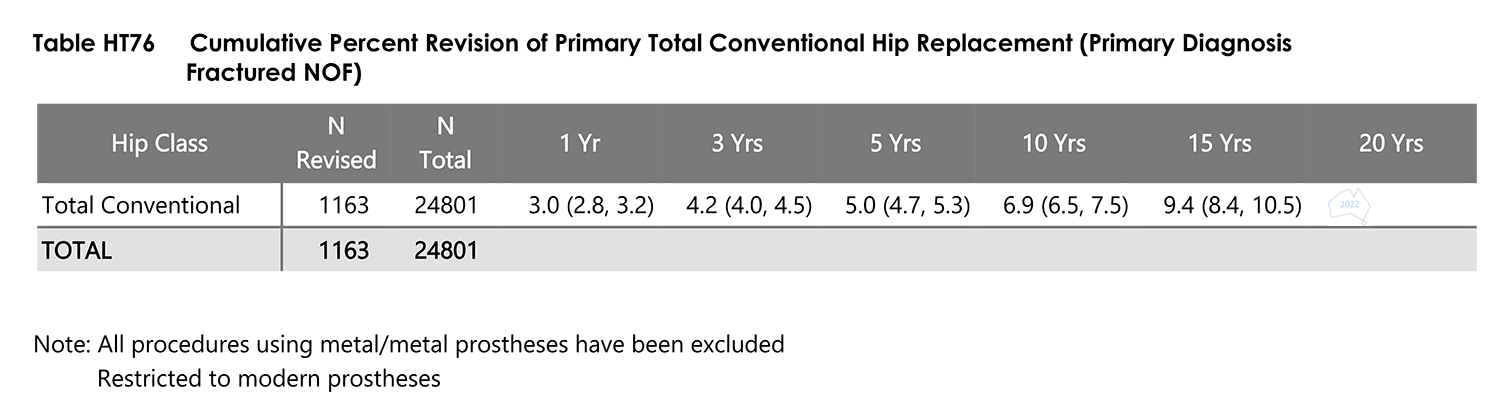
- Table HT76 Cumulative Percent Revision of Primary Total Conventional Hip ReplacementPDF · 46 KB
PNG
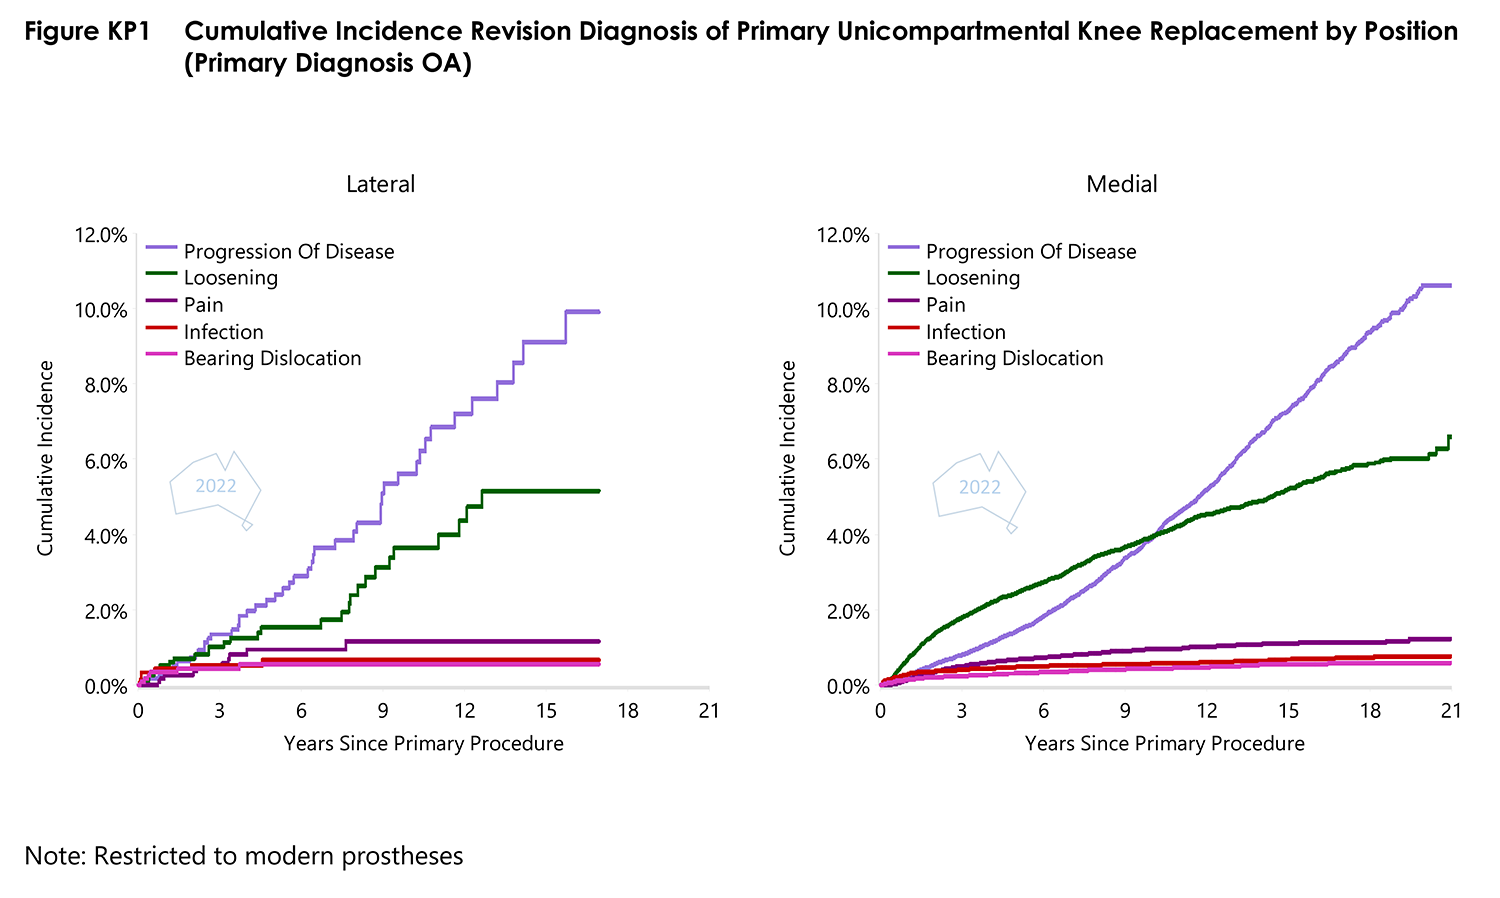
- Cumulative Incidence Revision Diagnosis of Primary Unicompartmental Knee Replacement by Position copyPNG · 292 KB
- Figure HT1 Primary Total Conventional Hip Replacement by Gender copyPNG · 224 KB
- Figure HT13 Cumulative Percent Revision of Primary Total Conventional Hip Replacement by ASA Score (Primary Diagnosis OA) copyPNG · 324 KB
- Figure HT15 Cumulative Percent Revision of Primary Total Conventional Hip Replacement by BMI Category copyPNG · 547 KB
- Figure HT2 Primary Total Conventional Hip Replacement by AgePNG · 328 KB
- Figure HT29 Cumulative Percent Revision of Primary Total Conventional Hip Replacement by Fixation copyPNG · 325 KB
- Figure HT3 Primary Total Conventional Hip Replacement by Fixation copyPNG · 281 KB
- Figure HT30 Cumulative Percent Revision of Primary Total Conventional Hip Replacement in Patients Aged copyPNG · 274 KB
- Figure HT33 Cumulative Percent Revision of Primary Total Conventional Hip Replacement in Patients Aged copyPNG · 303 KB
- Figure HT38 Cumulative Percent Revision of Primary Total Conventional Hip Replacement by Stem Type copyPNG · 298 KB
- Figure HT40 Cumulative Percent Revision of Primary Total Conventional Hip Replacement by Bearing Surface copyPNG · 783 KB
- Figure HT41 Primary Total Conventional Hip Replacement by Polyethylene Type copyPNG · 180 KB
- Figure HT42 Primary Total Conventional Hip Replacement by Polyethylene Type copyPNG · 344 KB
- Figure HT43 Cumulative Incidence Revision Diagnosis of Primary Total Conventional Hip Replacement by Polyethylene Type copyPNG · 289 KB
- Figure HT45 Cumulative Percent Revision of Primary Total Conventional Hip Replacement using XLPE by Head Size copyPNG · 313 KB
- Figure HT5 Cumulative Percent Revision of Primary Total Conventional Hip Replacement copyPNG · 219 KB
- Figure HT54 Cumulative Percent Revision of Primary Total Conventional Hip Replacement by Acetabular Type copyPNG · 314 KB
- Figure HT58 Cumulative Percent Revision of Primary Total Conventional Hip Replacement by Acetabular Mobility copyPNG · 325 KB
- Figure HT6 Cumulative Incidence Revision Diagnosis of Primary Total Conventional Hip Replacement copyPNG · 217 KB
- Figure HT64 Cumulative Percent Revision of Primary Total Conventional Hip Replacement by Surgical Approach-1 copyPNG · 412 KB
- Figure HT65 Cumulative Percent Revision of Primary Total Conventional Hip Replacement by Surgical Approach-1 copyPNG · 404 KB
- Figure HT66 Cumulative Incidence Revision Diagnosis of Primary Total Conventional Hip Replacement by Surgical Approach copyPNG · 415 KB
- Figure HT67 Cumulative Incidence Revision Diagnosis of Primary Total Conventional Hip Replacement by Surgical Approach copyPNG · 386 KB
- Figure HT68 Cumulative Incidence Revision Diagnosis of Primary Total Conventional Hip Replacement by Surgical Approach copyPNG · 398 KB
- Figure HT69 Cumulative Incidence Revision Diagnosis of Primary Total Conventional Hip Replacement by Surgical Approach copyPNG · 376 KB
- Figure HT70 Cumulative Incidence Revision Diagnosis of Primary Total Conventional Hip Replacement by Surgical Approach copyPNG · 415 KB
- Figure HT75 Cumulative Incidence Revision Diagnosis of Primary Total Conventional Hip Replacement copyPNG · 233 KB
- Figure HT77 Cumulative Incidence Revision Diagnosis of Primary Total Conventional Hip Replacement copyPNG · 212 KB
- Figure HT78 Cumulative Incidence Revision of Primary Total Conventional Hip Replacement by ASA Score copyPNG · 308 KB
- Figure HT80 Cumulative Percent Revision of Primary Total Conventional Hip Replacement by BMI Category copyPNG · 484 KB
- Figure HT82 Cumulative Percent Revision of Primary Total Conventional Hip Replacement by Fixation copyPNG · 318 KB
- Figure HT84 Cumulative Percent Revision of Primary Total Conventional Hip Replacement in Patients Aged copyPNG · 315 KB
- Figure HT87 Cumulative Percent Revision of Primary Total Conventional Hip Replacement by Acetabular Type copyPNG · 300 KB
- Figure HT88 Cumulative Percent Revision of Primary Total Conventional Hip Replacement by Acetabular Mobility copyPNG · 323 KB
- Figure M5 Cumulative Percent Survival of Patients with Primary Total Conventional Hip Replacement copyPNG · 190 KB
- Table HT14 Cumulative Percent Revision of Primary Total Conventional Hip Replacement copyPNG · 139 KB
- Table HT76 Cumulative Percent Revision of Primary Total Conventional Hip Replacement copyPNG · 135 KB
Knees
Partial Knees
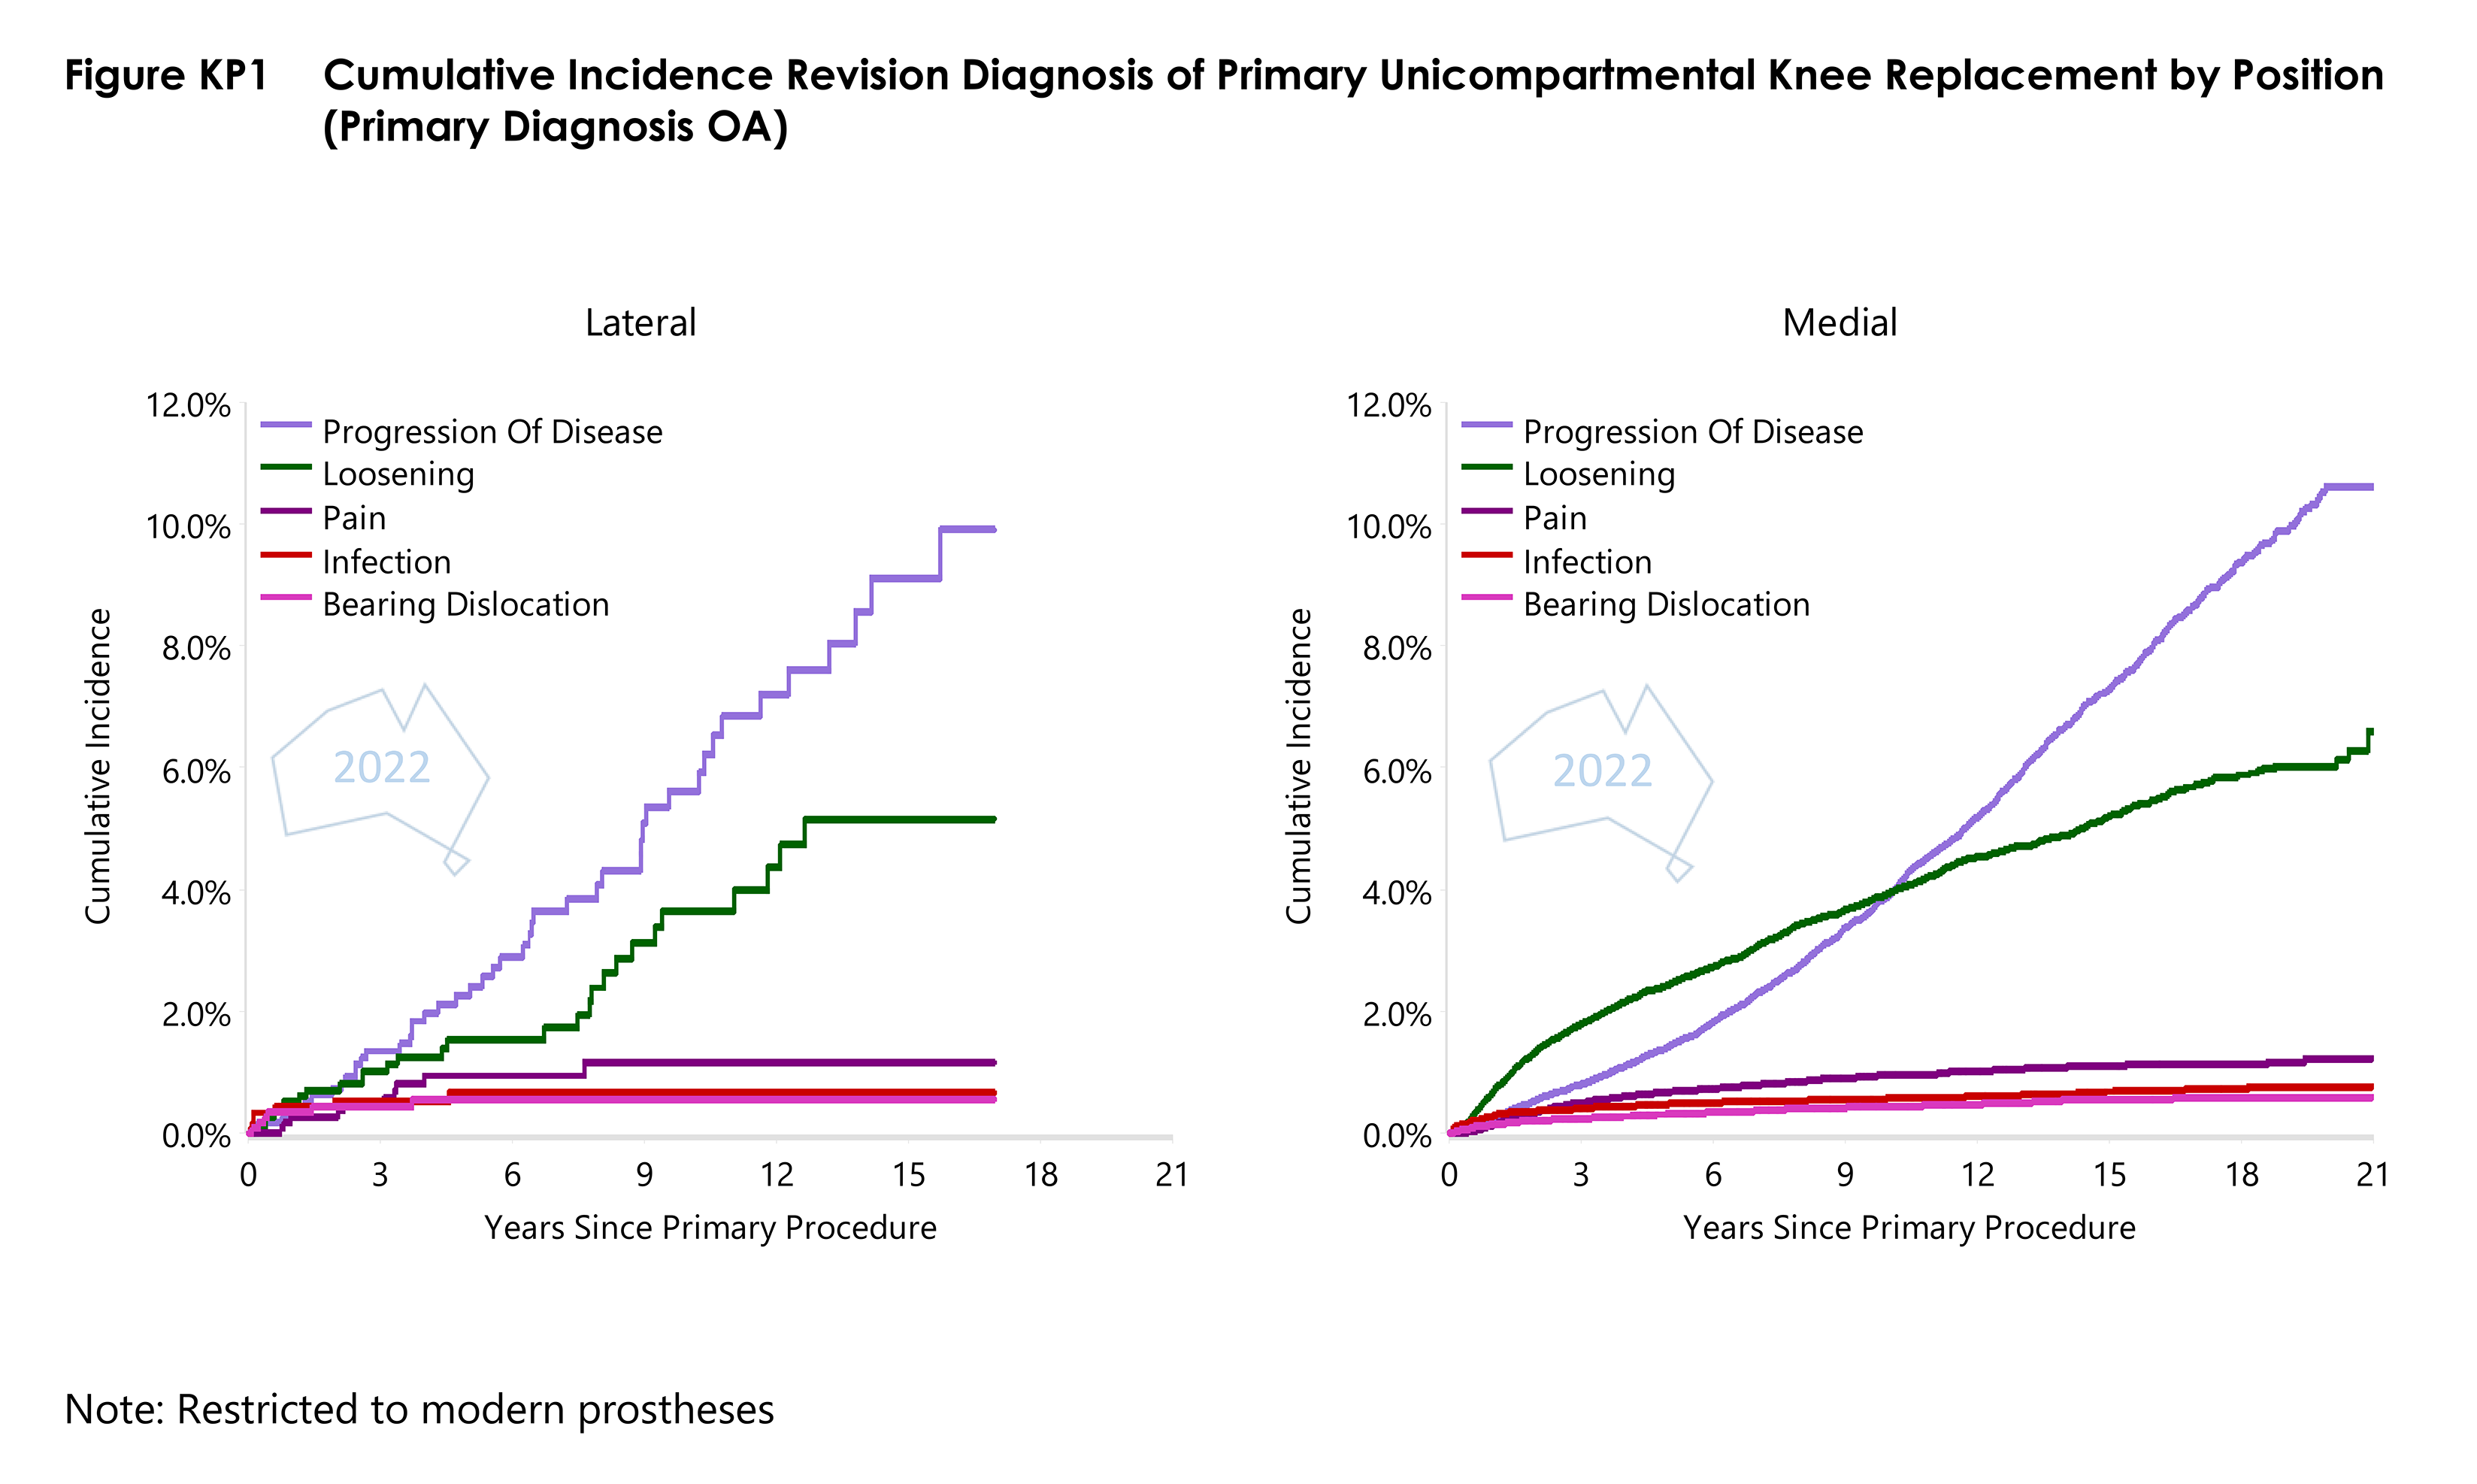
- Cumulative Incidence Revision Diagnosis of Primary Unicompartmental Knee Replacement by PositionPDF · 164 KB
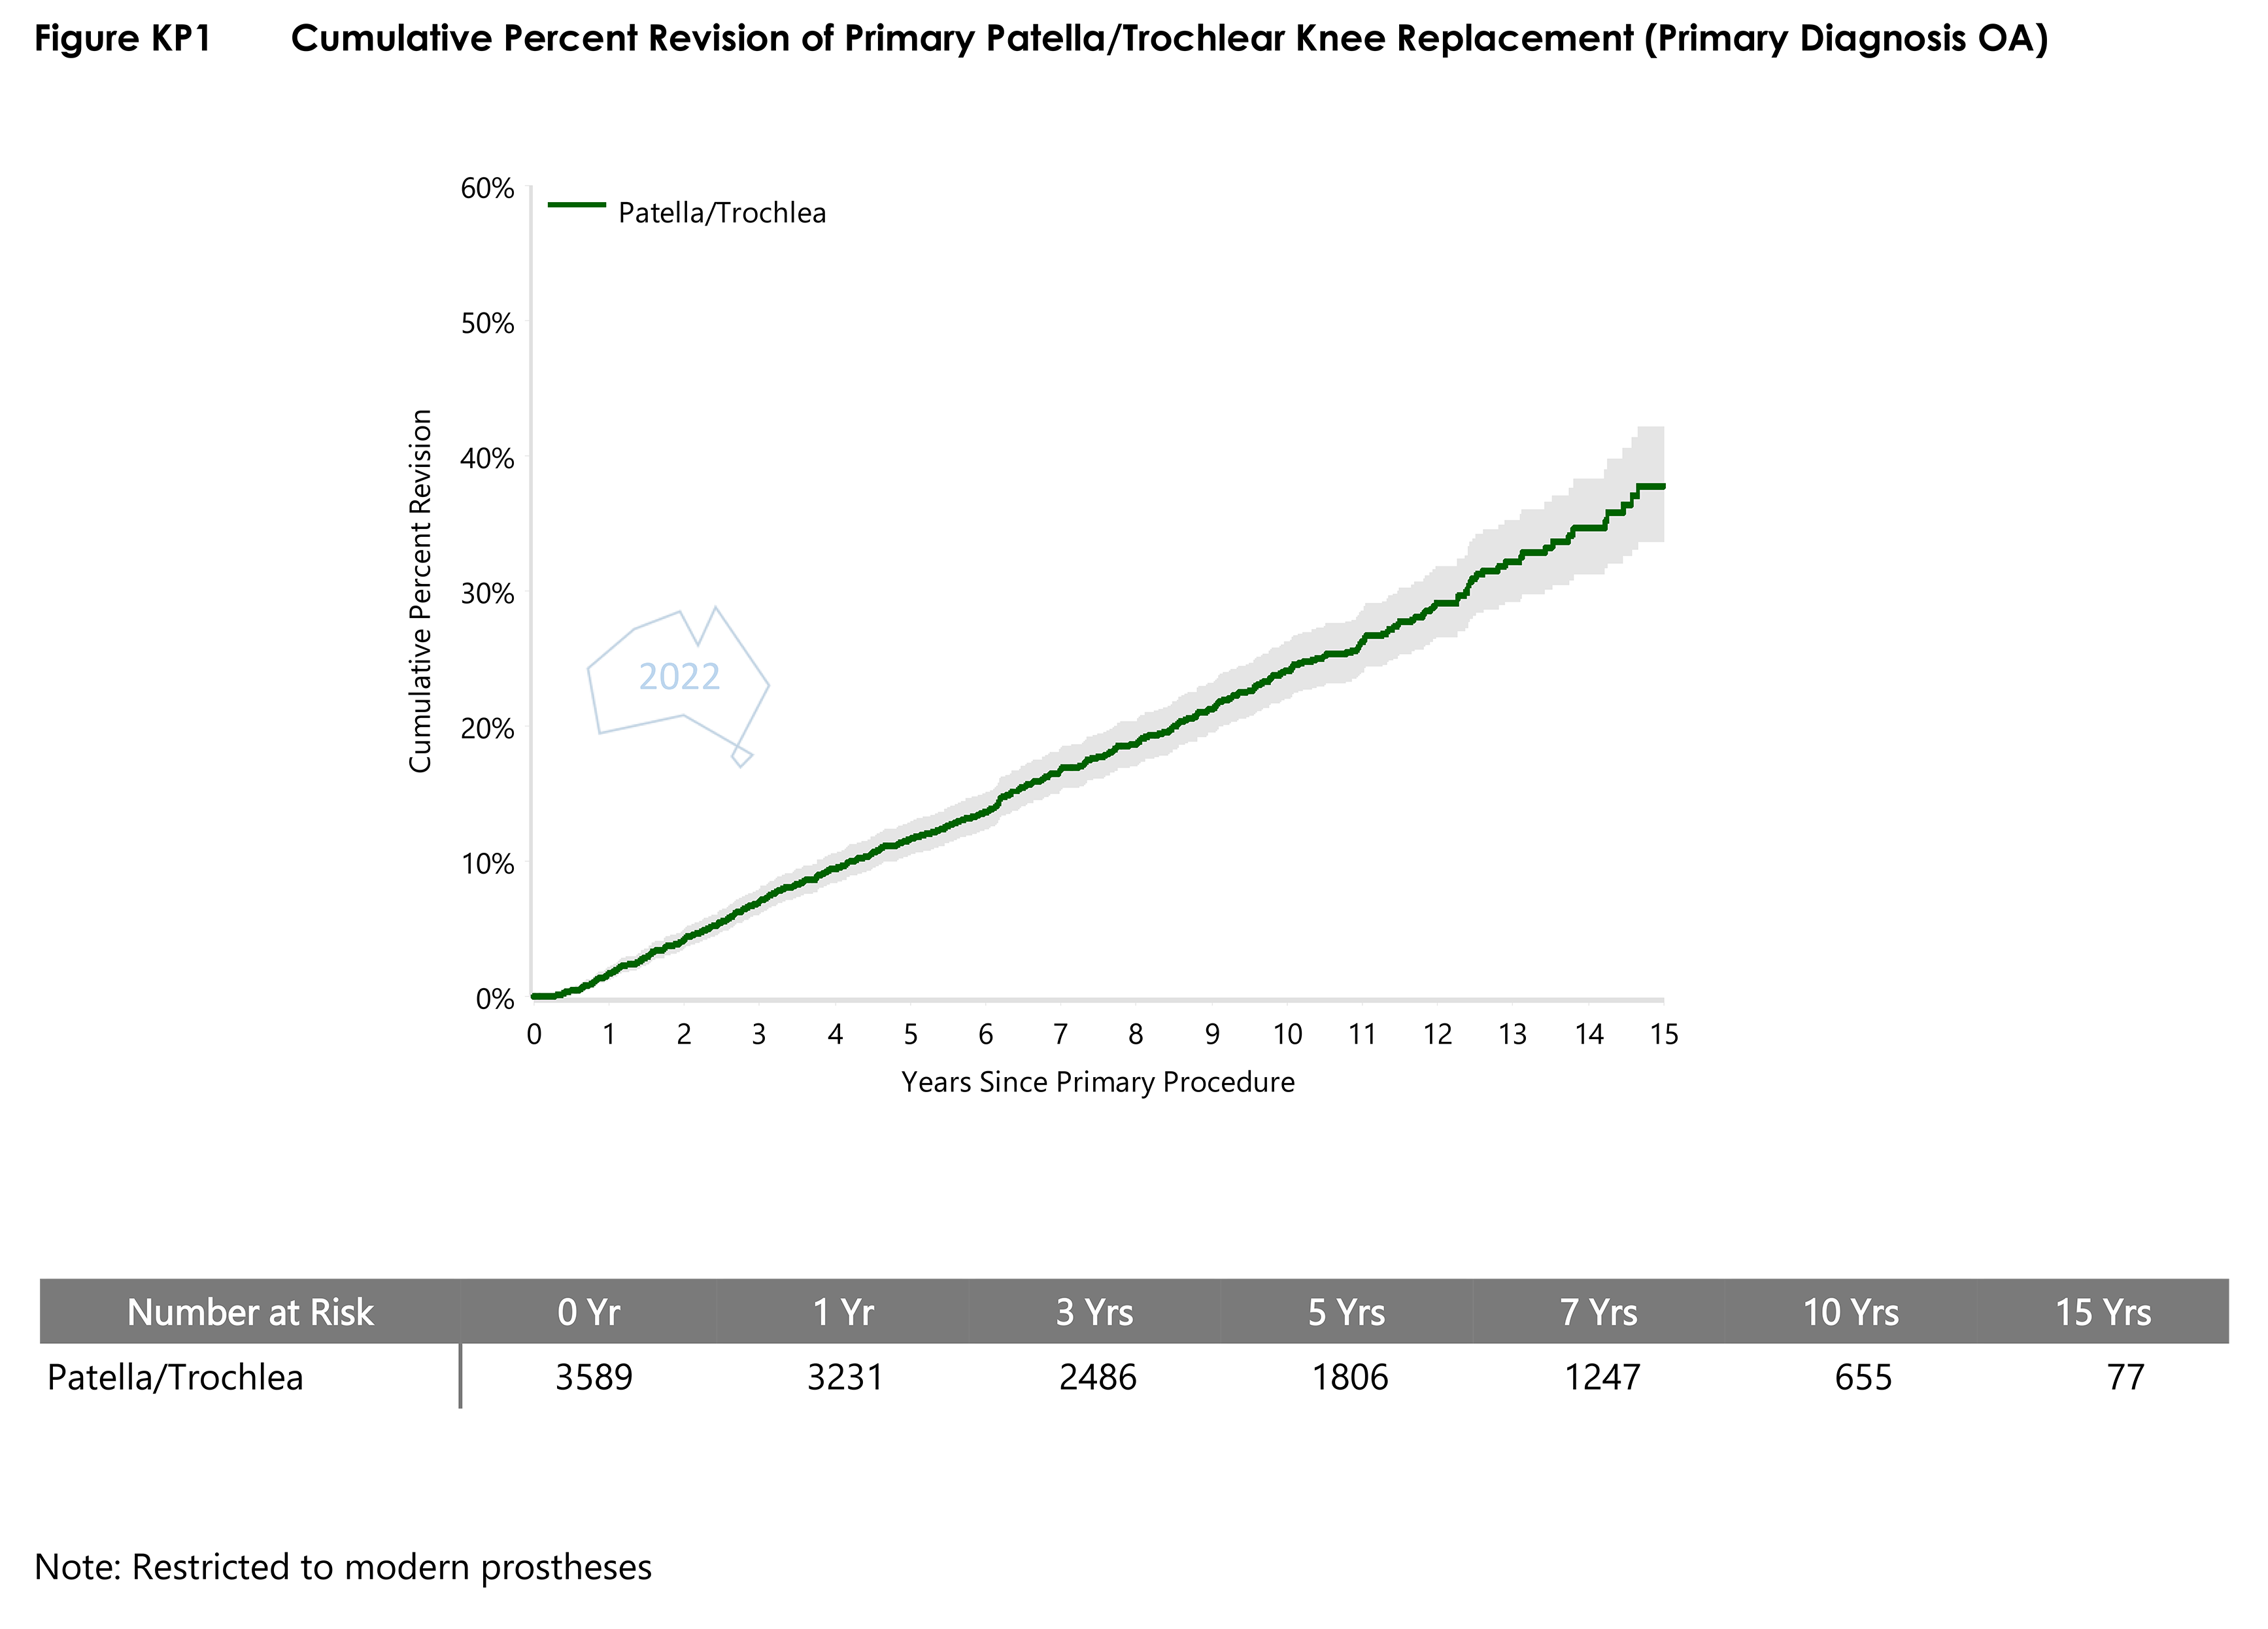
- Figure KP1 Cumulative Percent Revision of Primary PatellaPDF · 92 KB
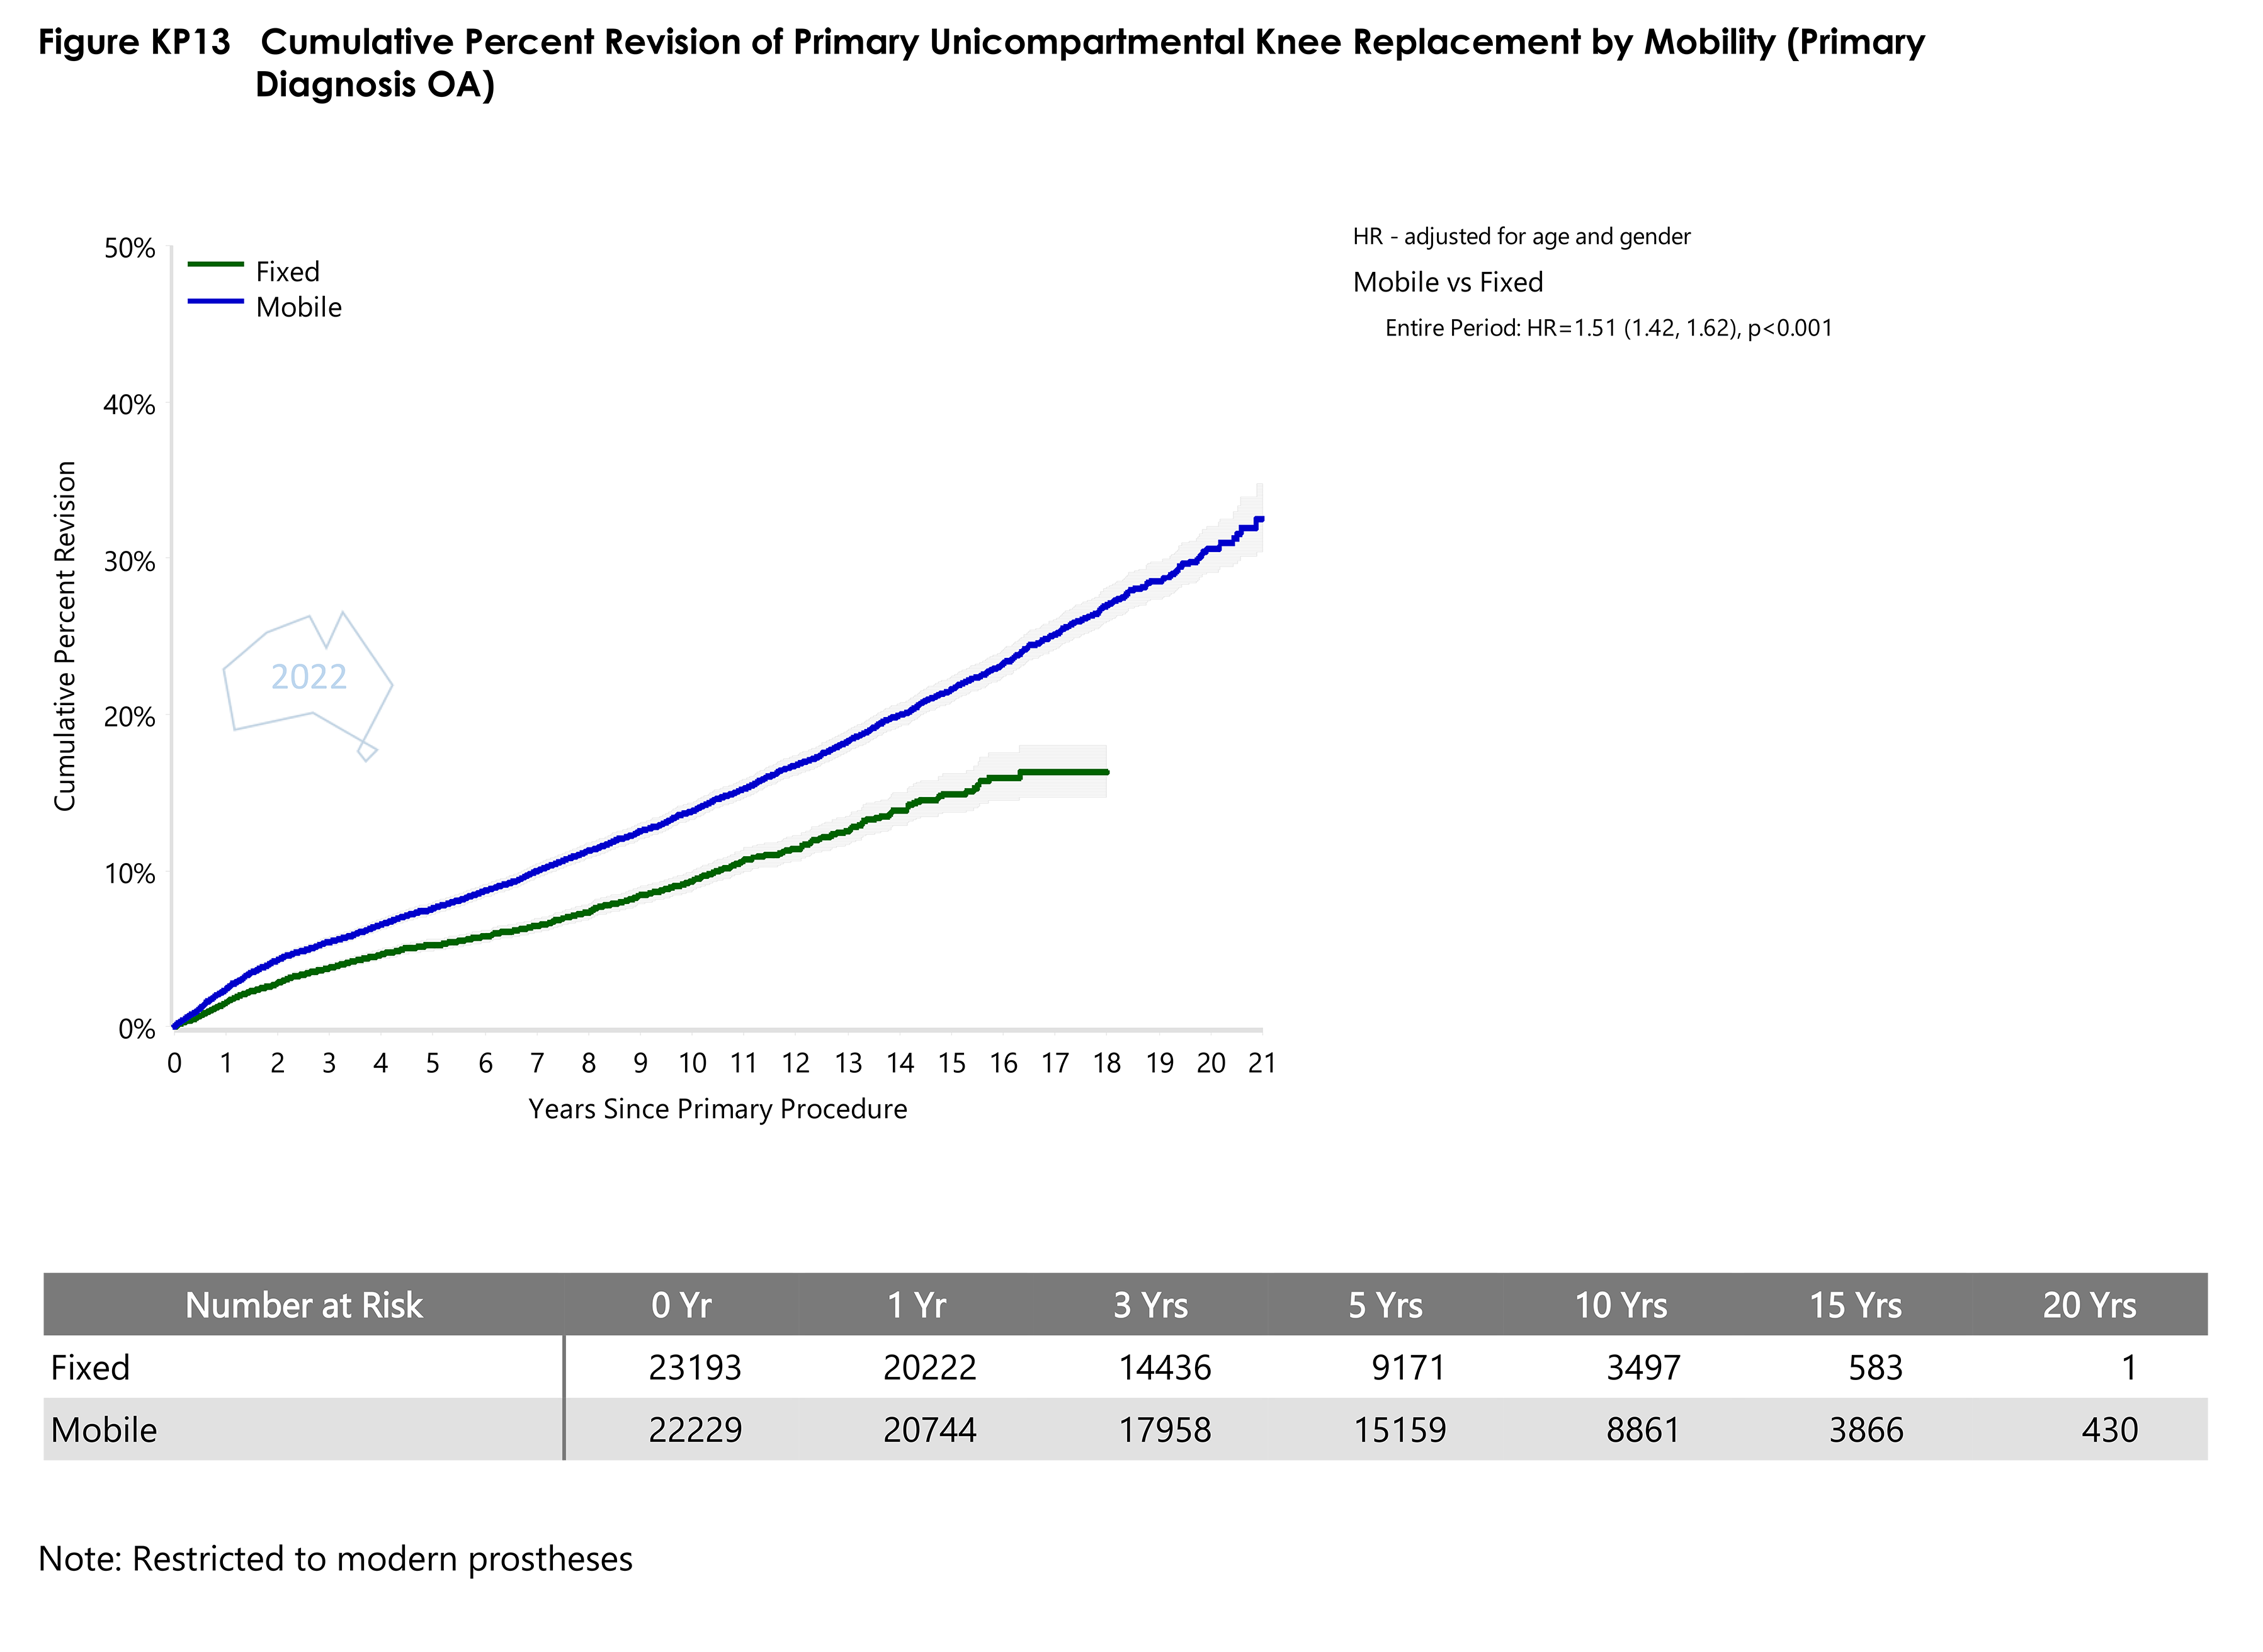
- Figure KP13 Cumulative Percent Revision of Primary Unicompartmental Knee Replacement by MobilityPDF · 175 KB
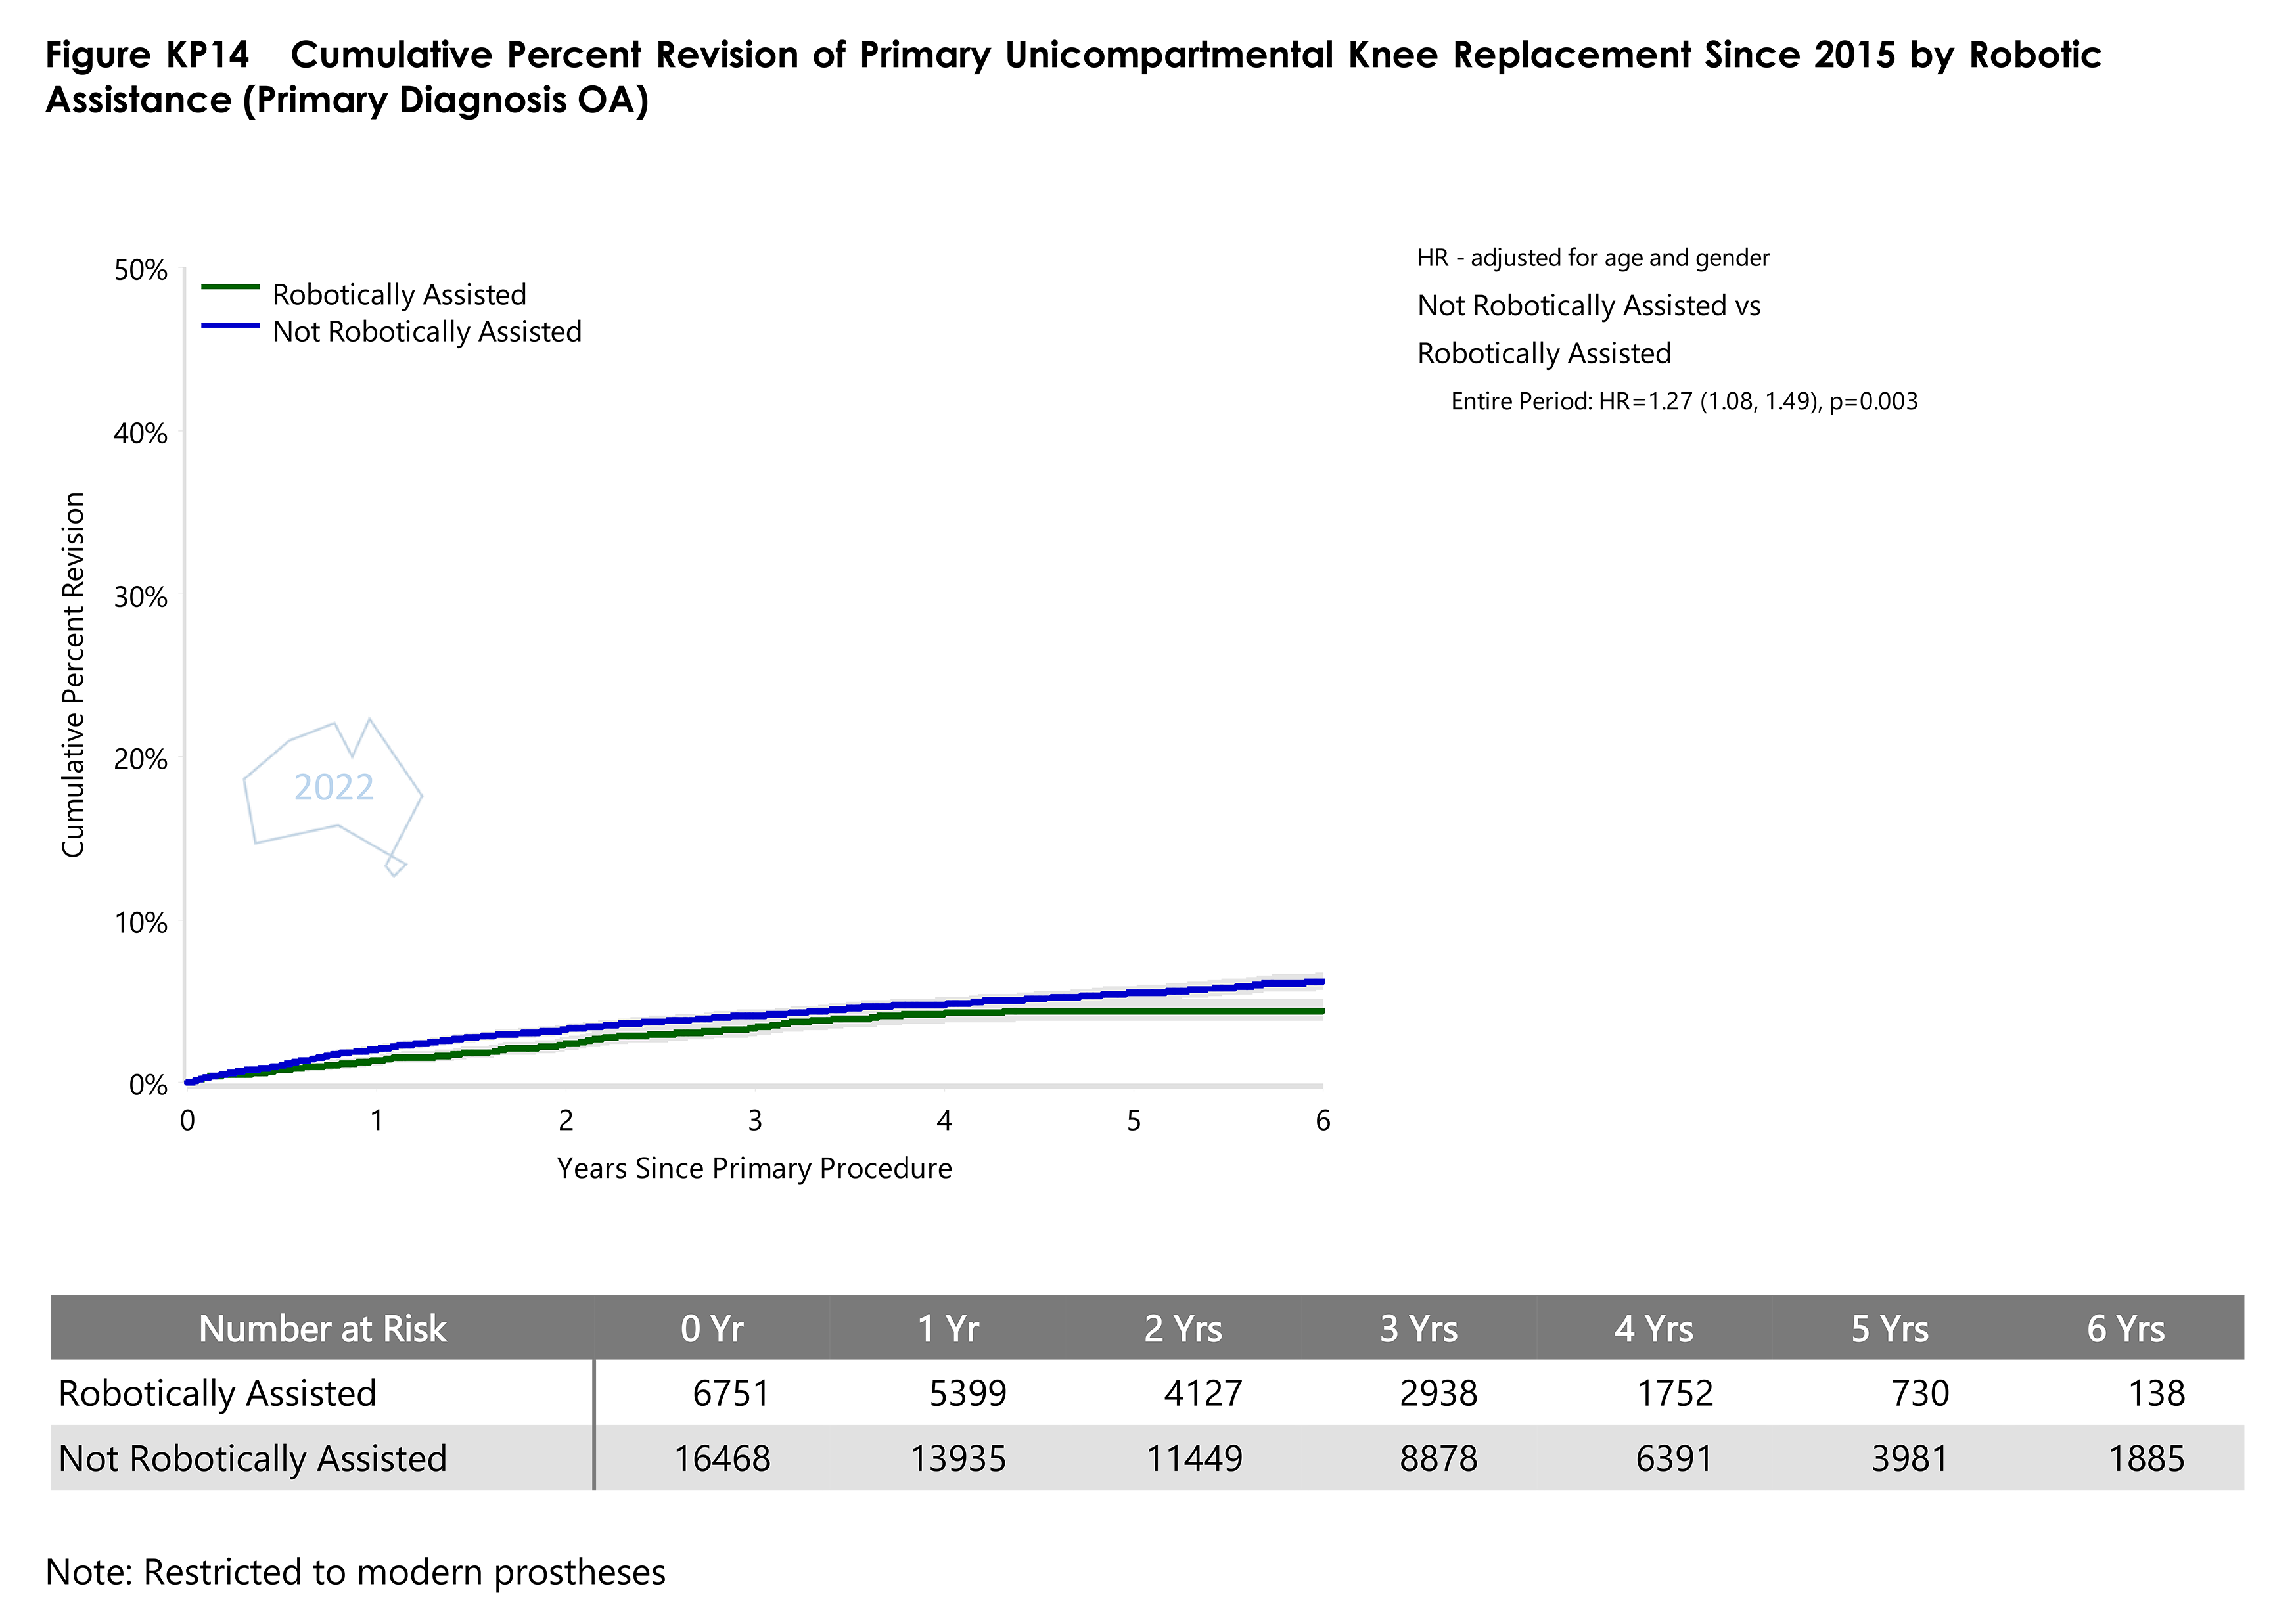
- Figure KP14 Cumulative Percent Revision of Primary Unicompartmental Knee Replacement Since 2015 by Robotic AssistancePDF · 81 KB
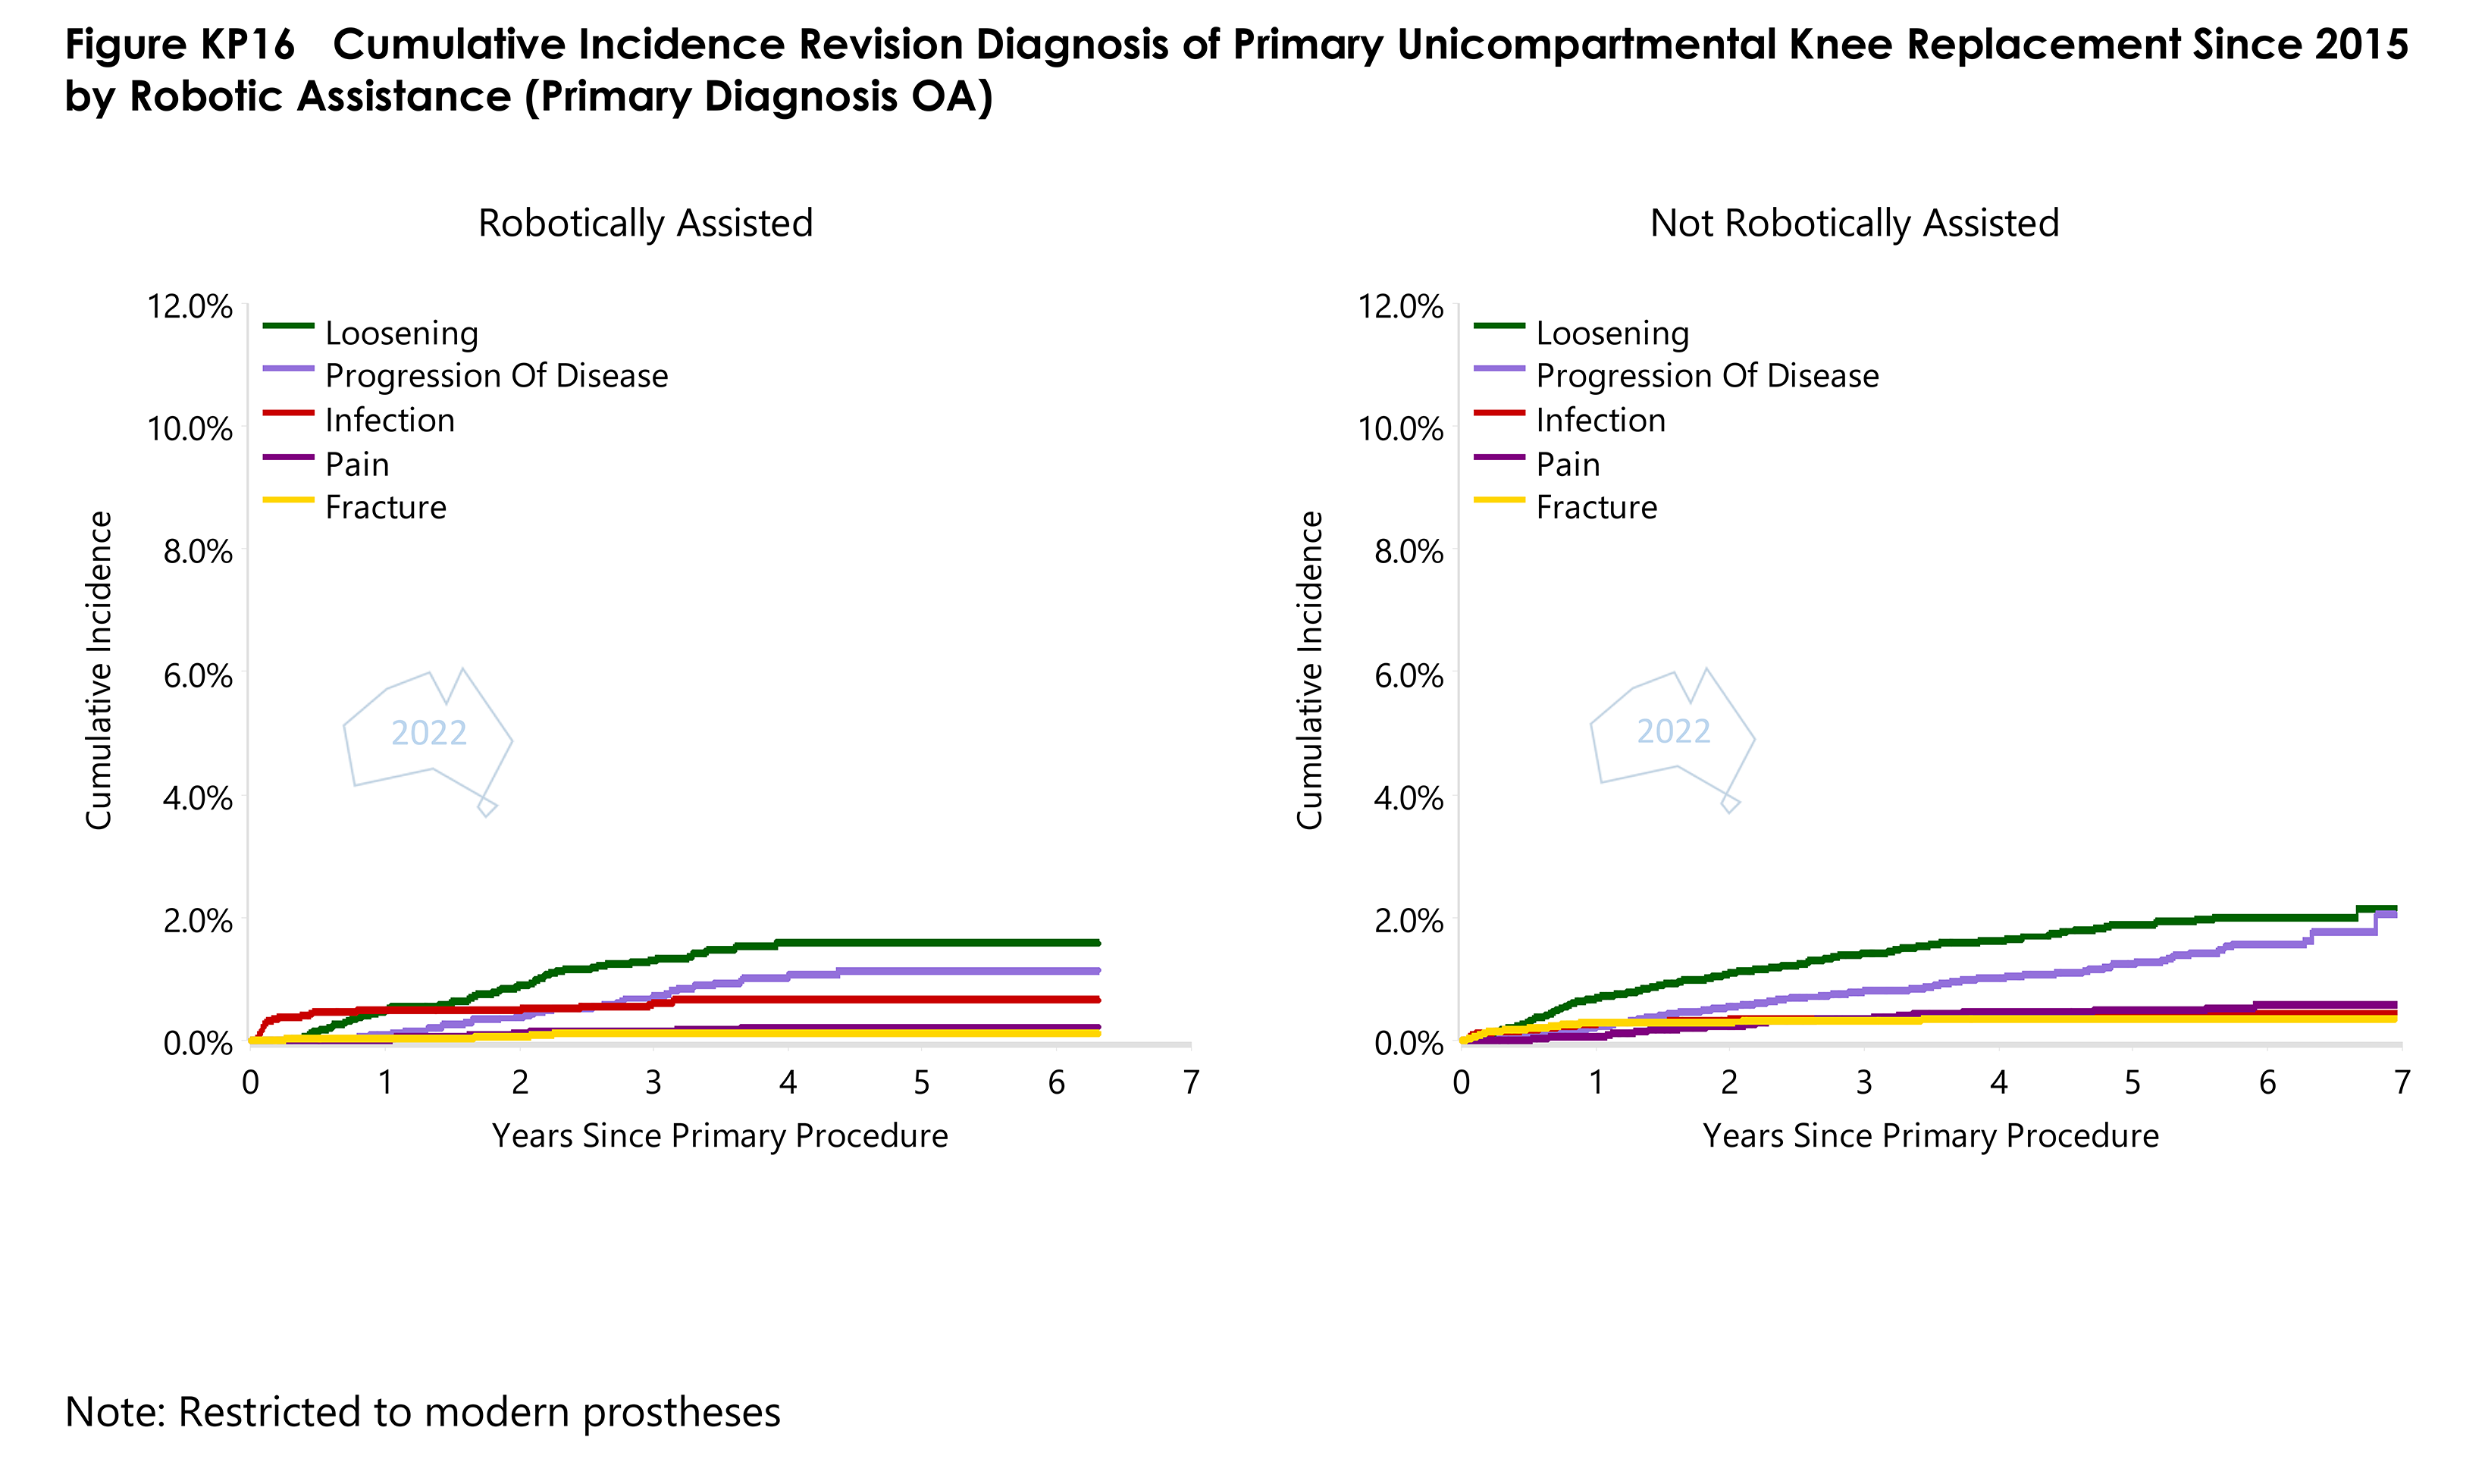
- Figure KP16 Cumulative Incidence Revision Diagnosis of Primary Unicompartmental Knee Replacement Since 2015 by Robotic AssistancePDF · 77 KB
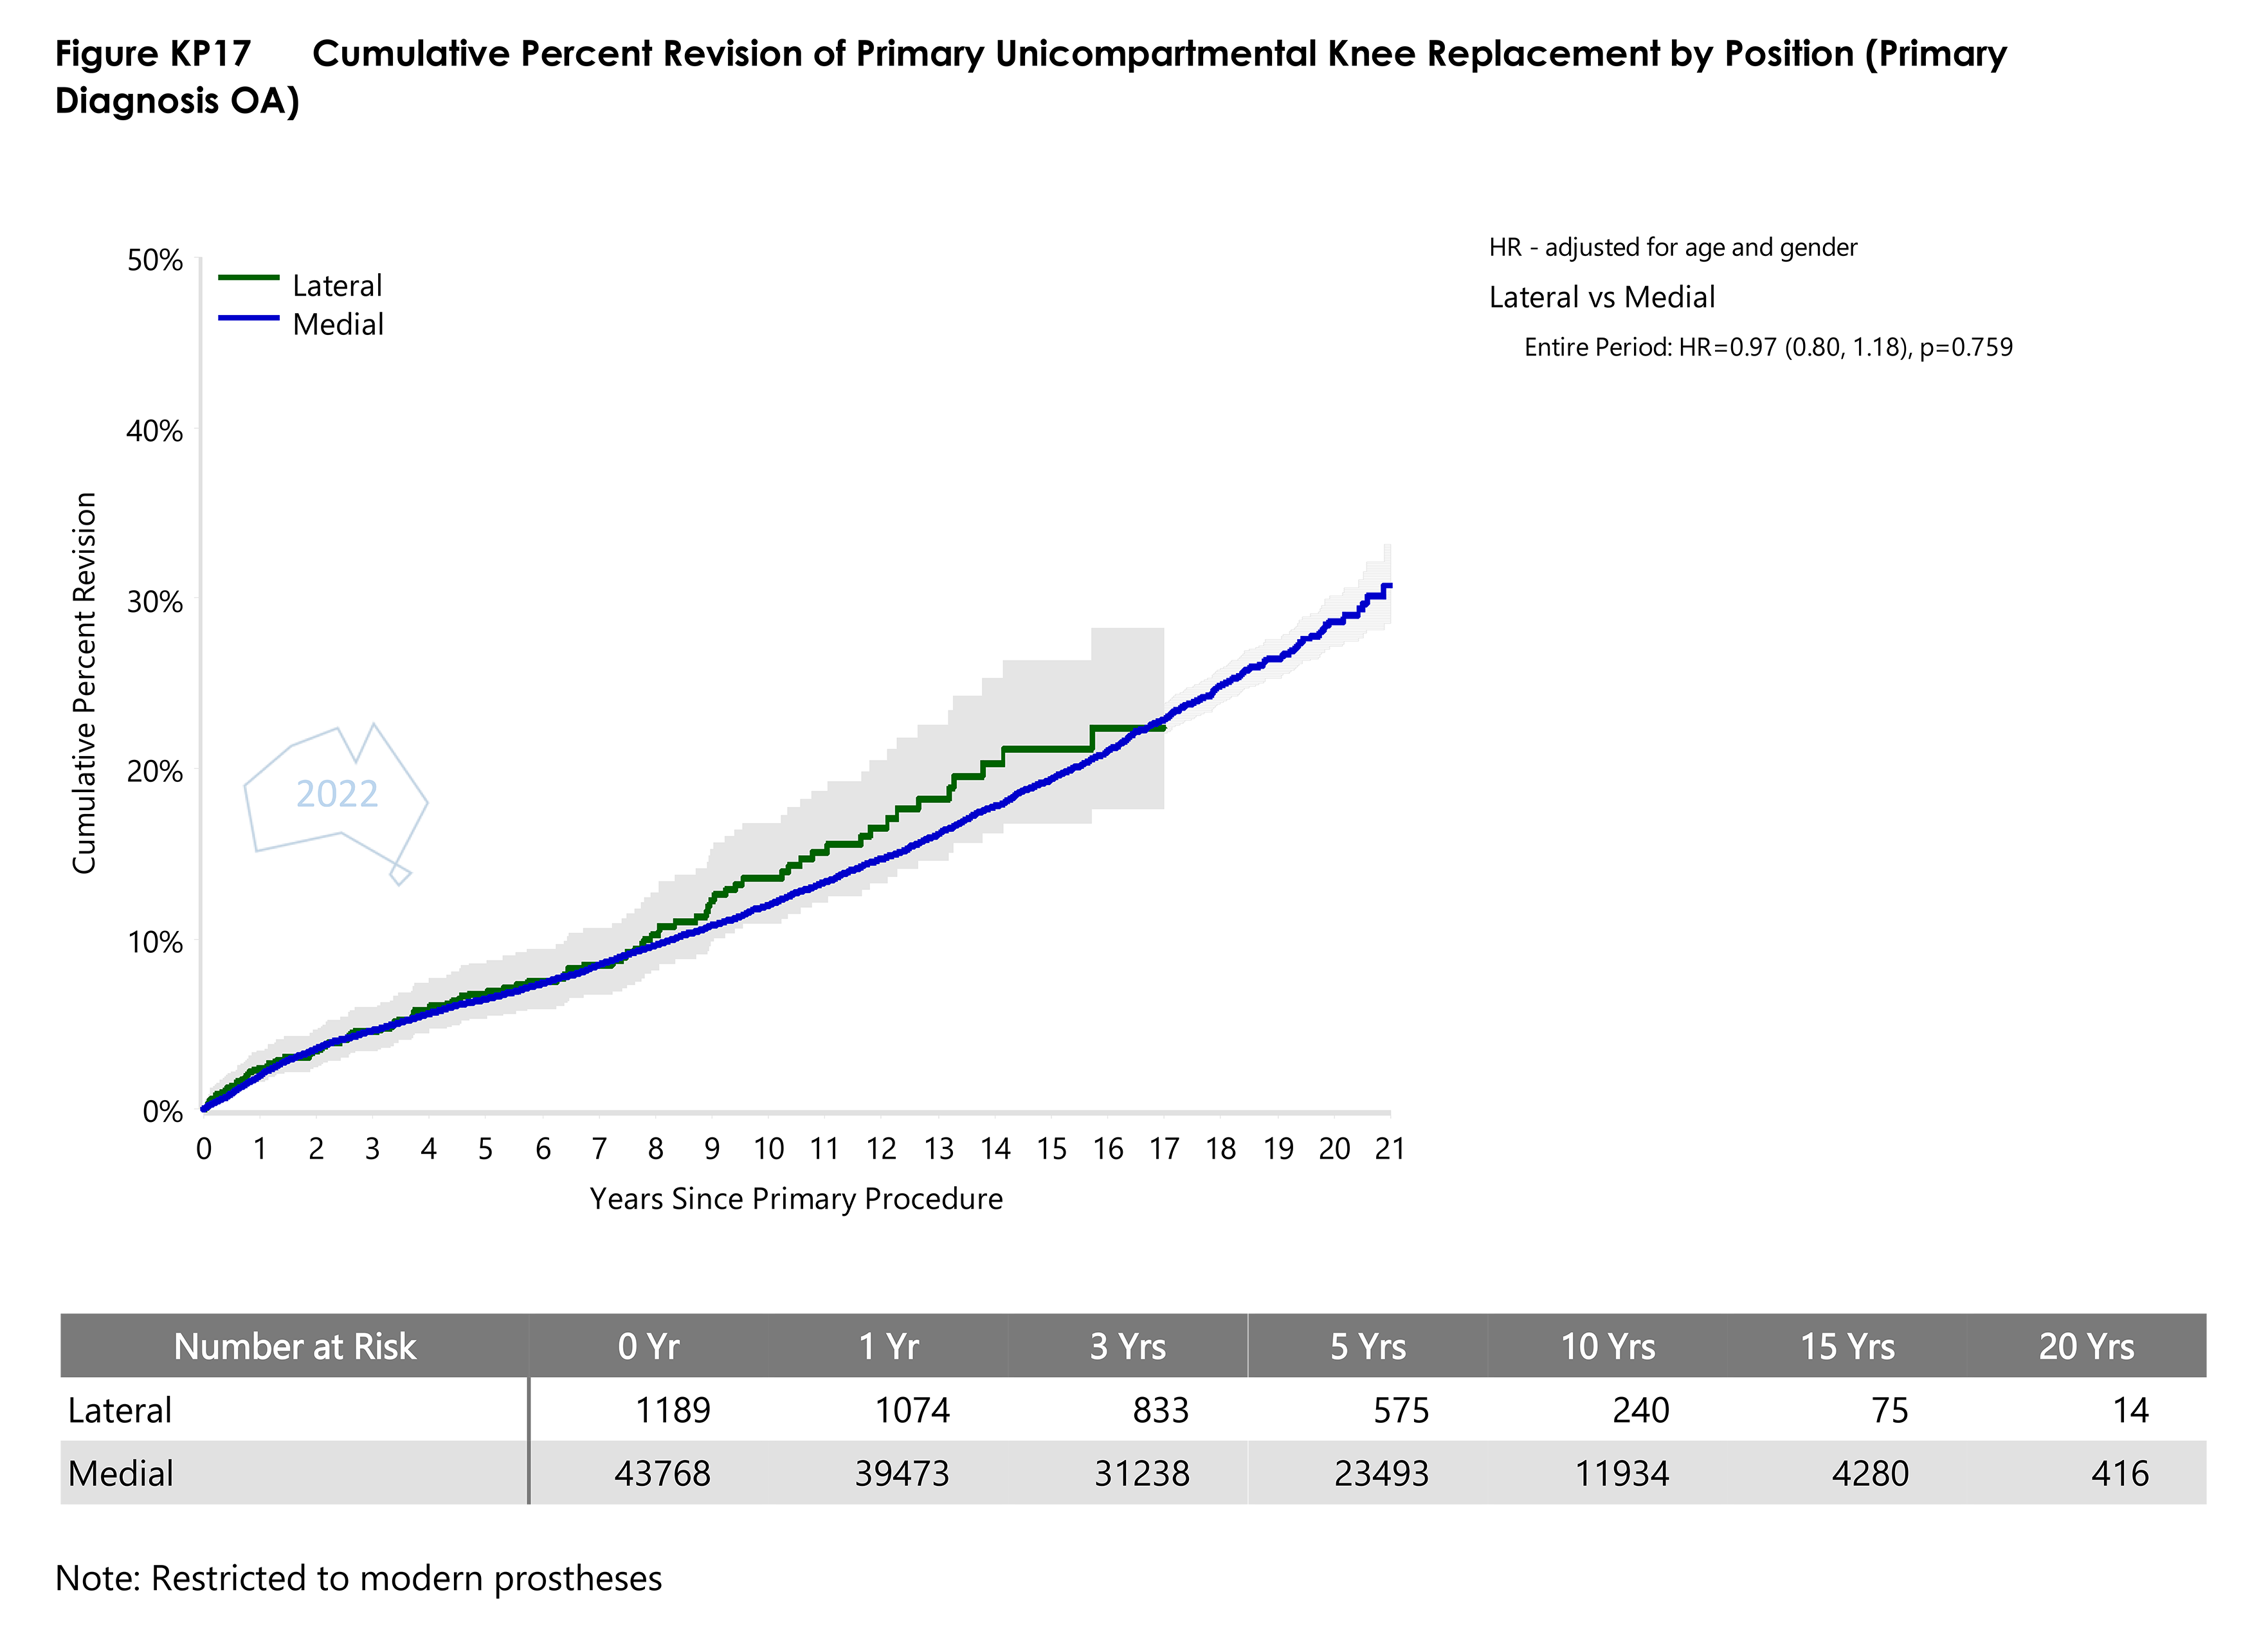
- Figure KP17 Cumulative Percent Revision of Primary Unicompartmental Knee Replacement by PositionPDF · 138 KB
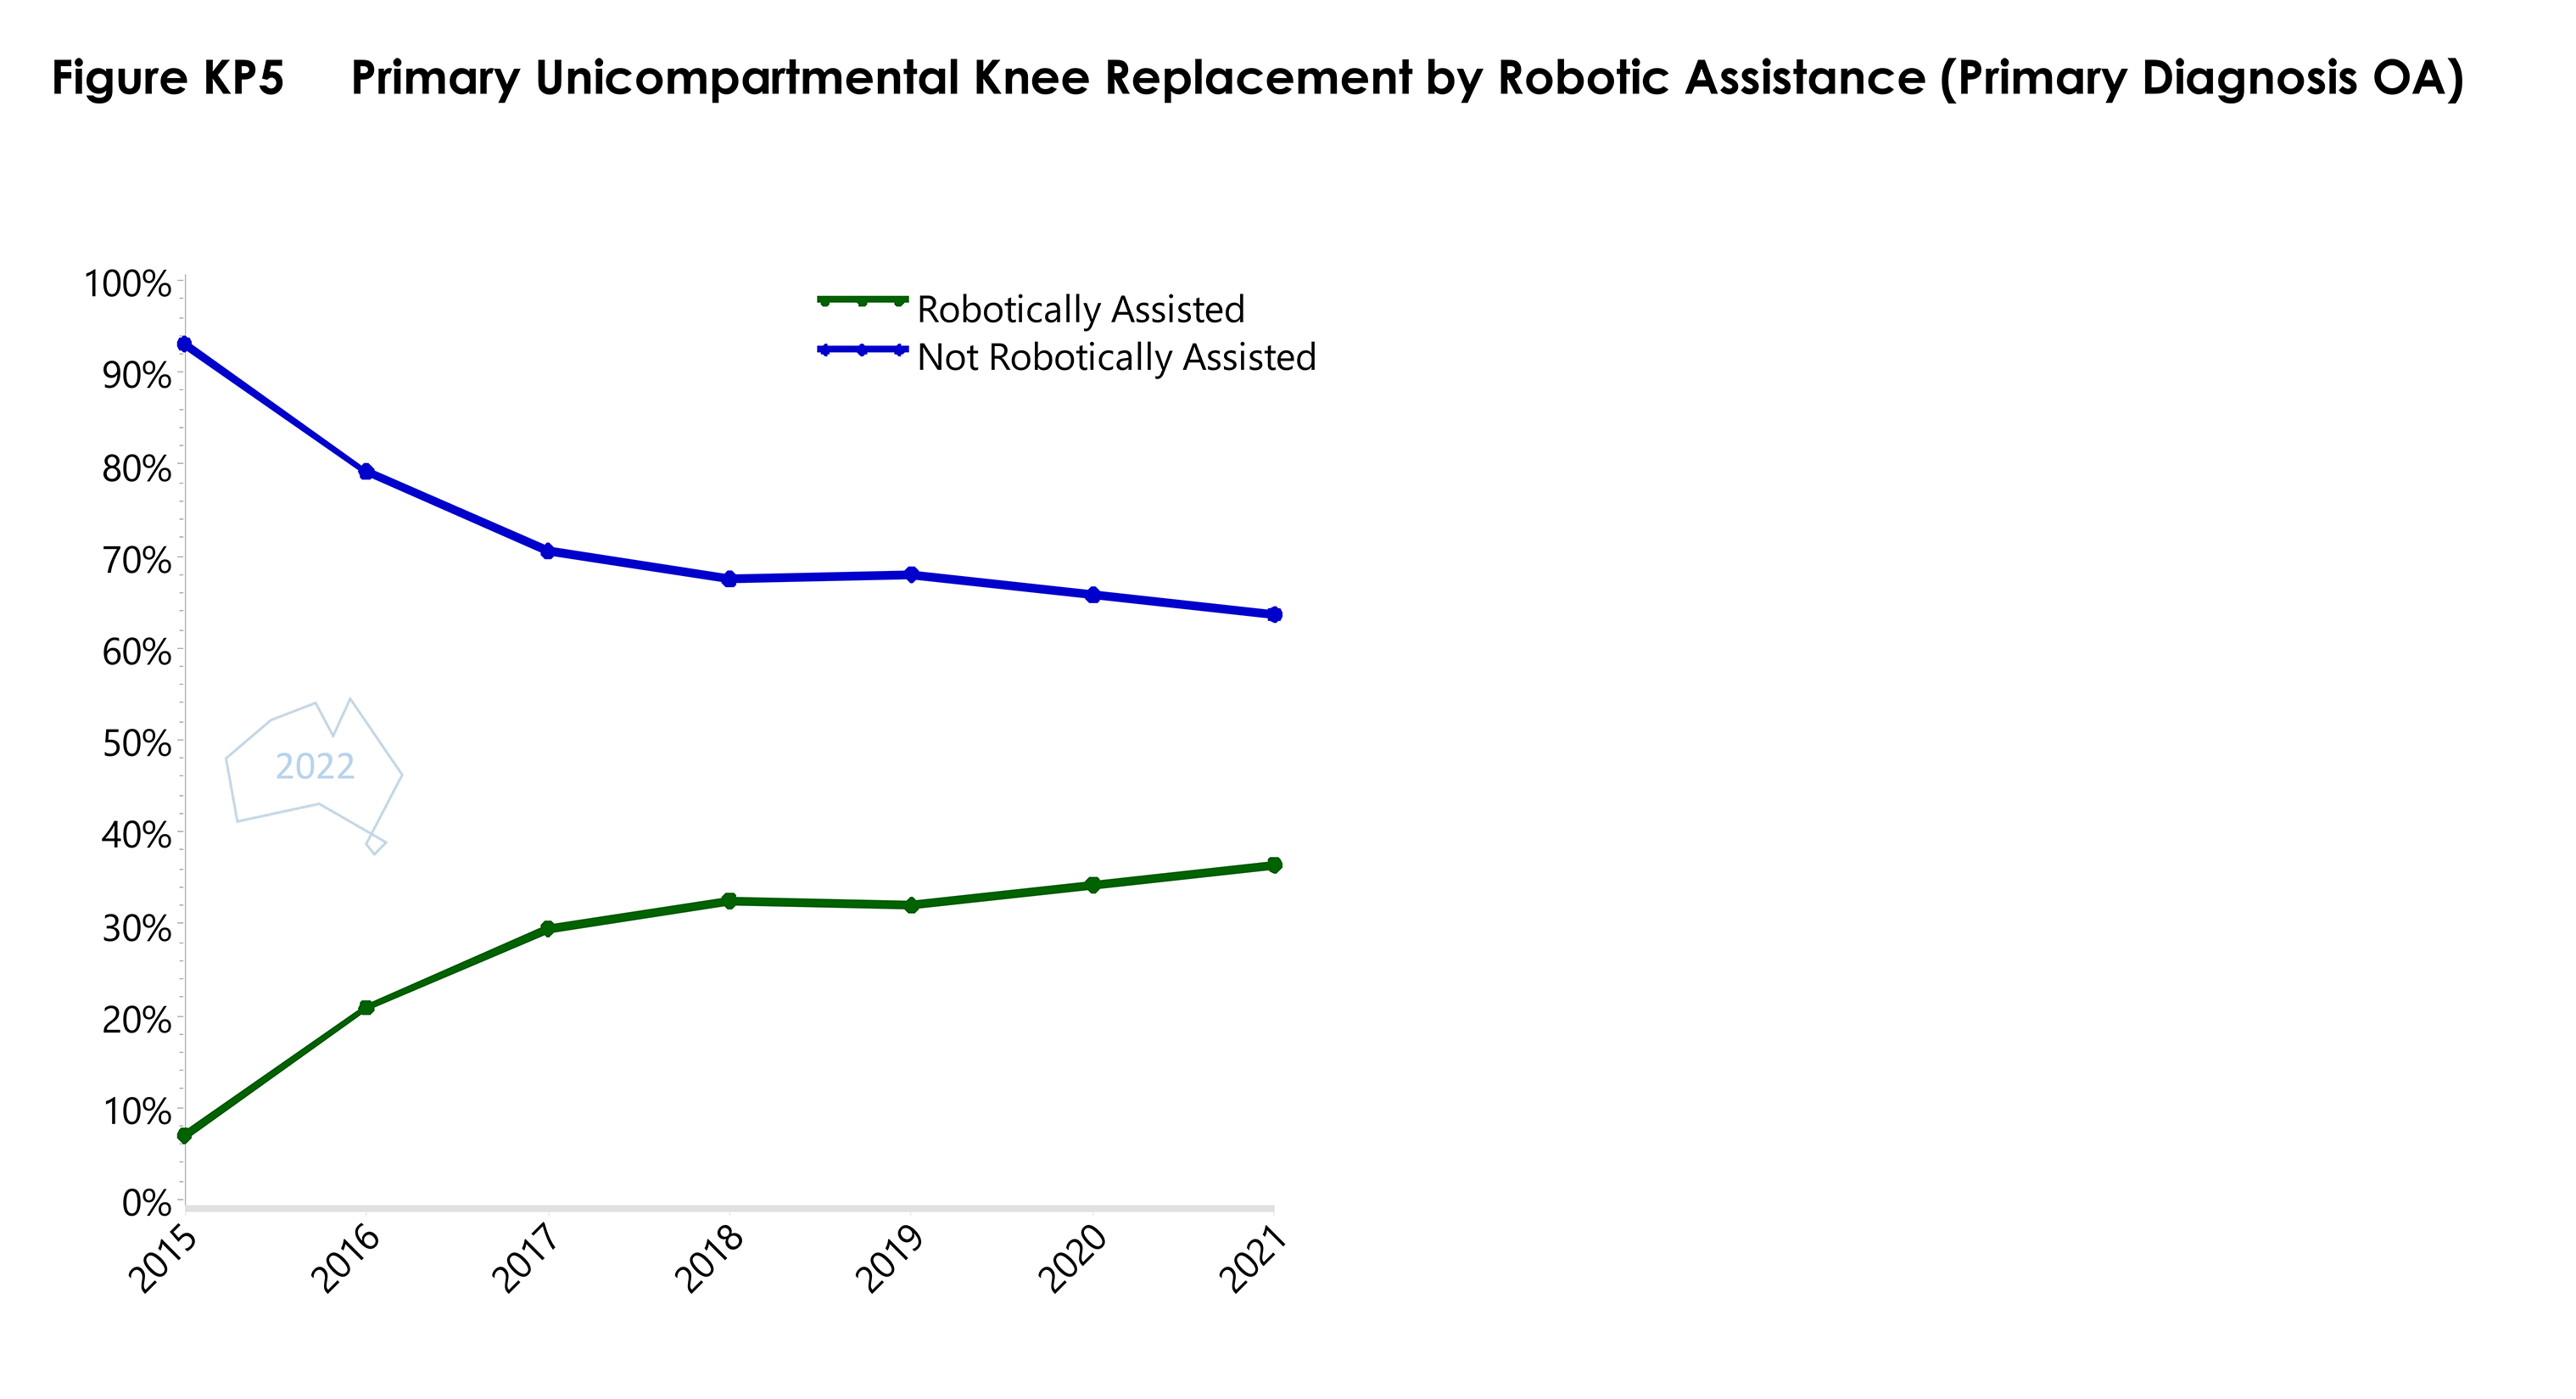
- Figure KP5 Primary Unicompartmental Knee Replacement by Robotic AssistancePDF · 41 KB
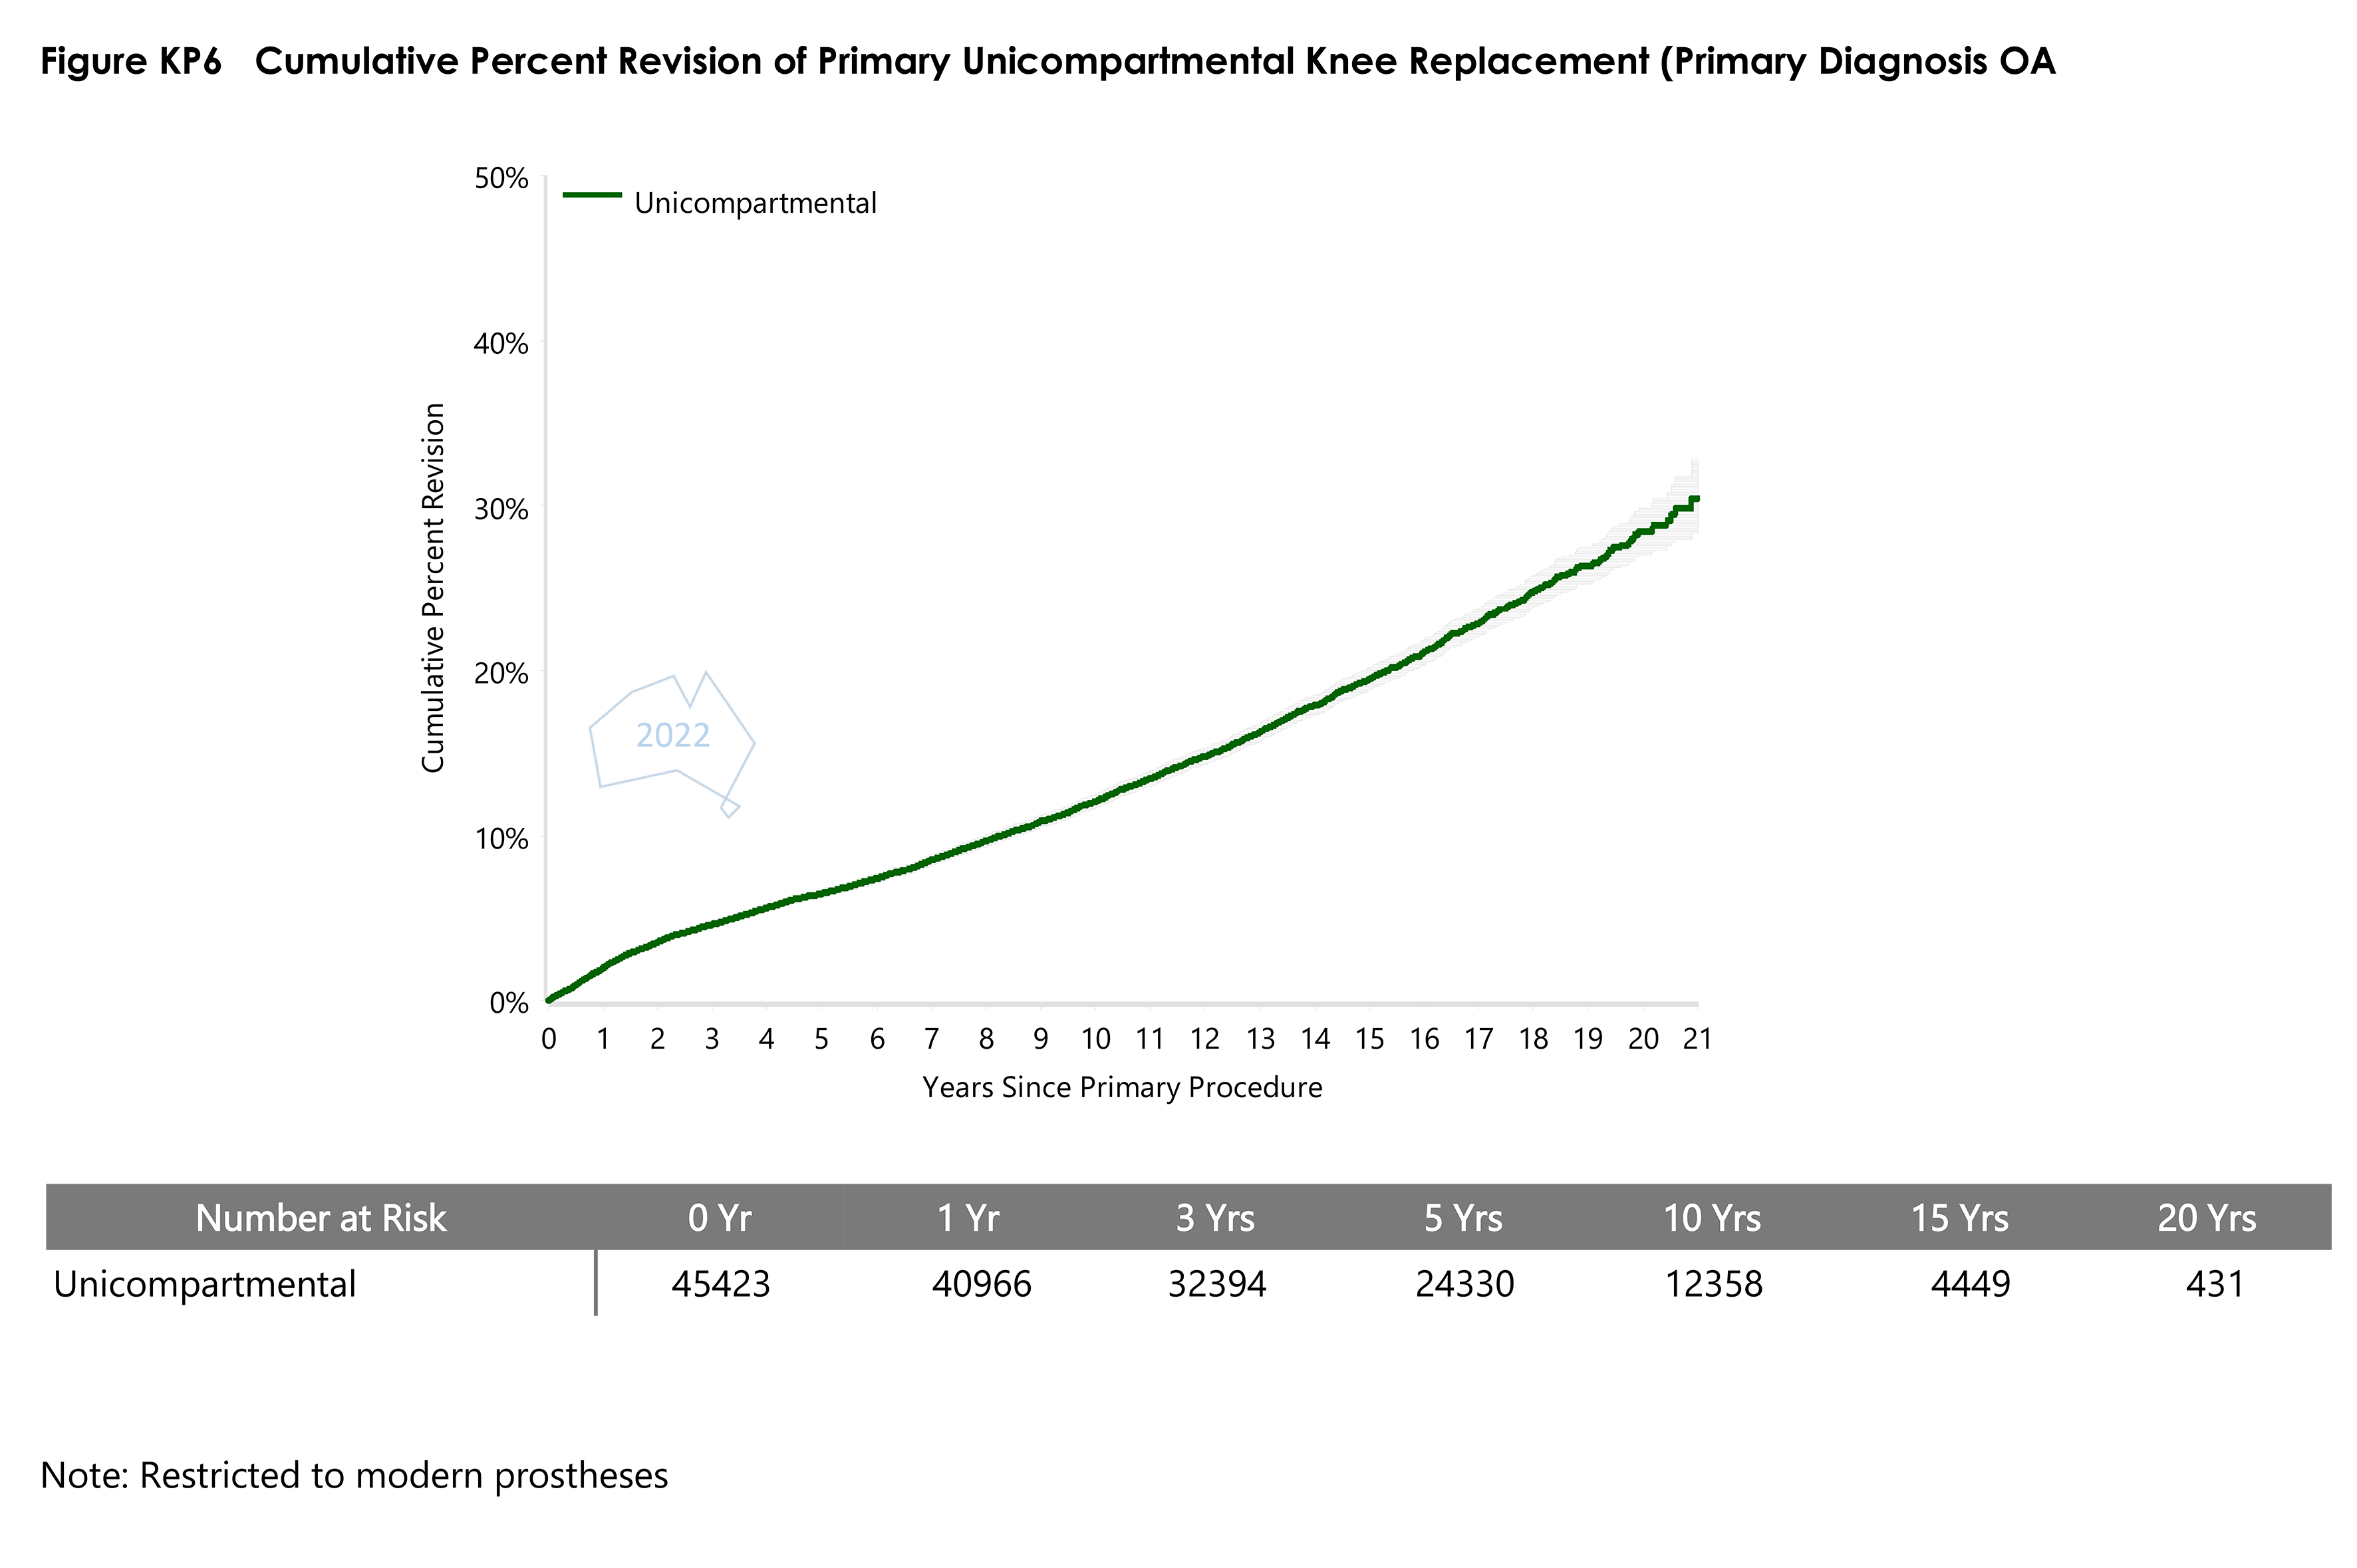
- Figure KP6 Cumulative Percent Revision of Primary Unicompartmental Knee ReplacementPDF · 146 KB
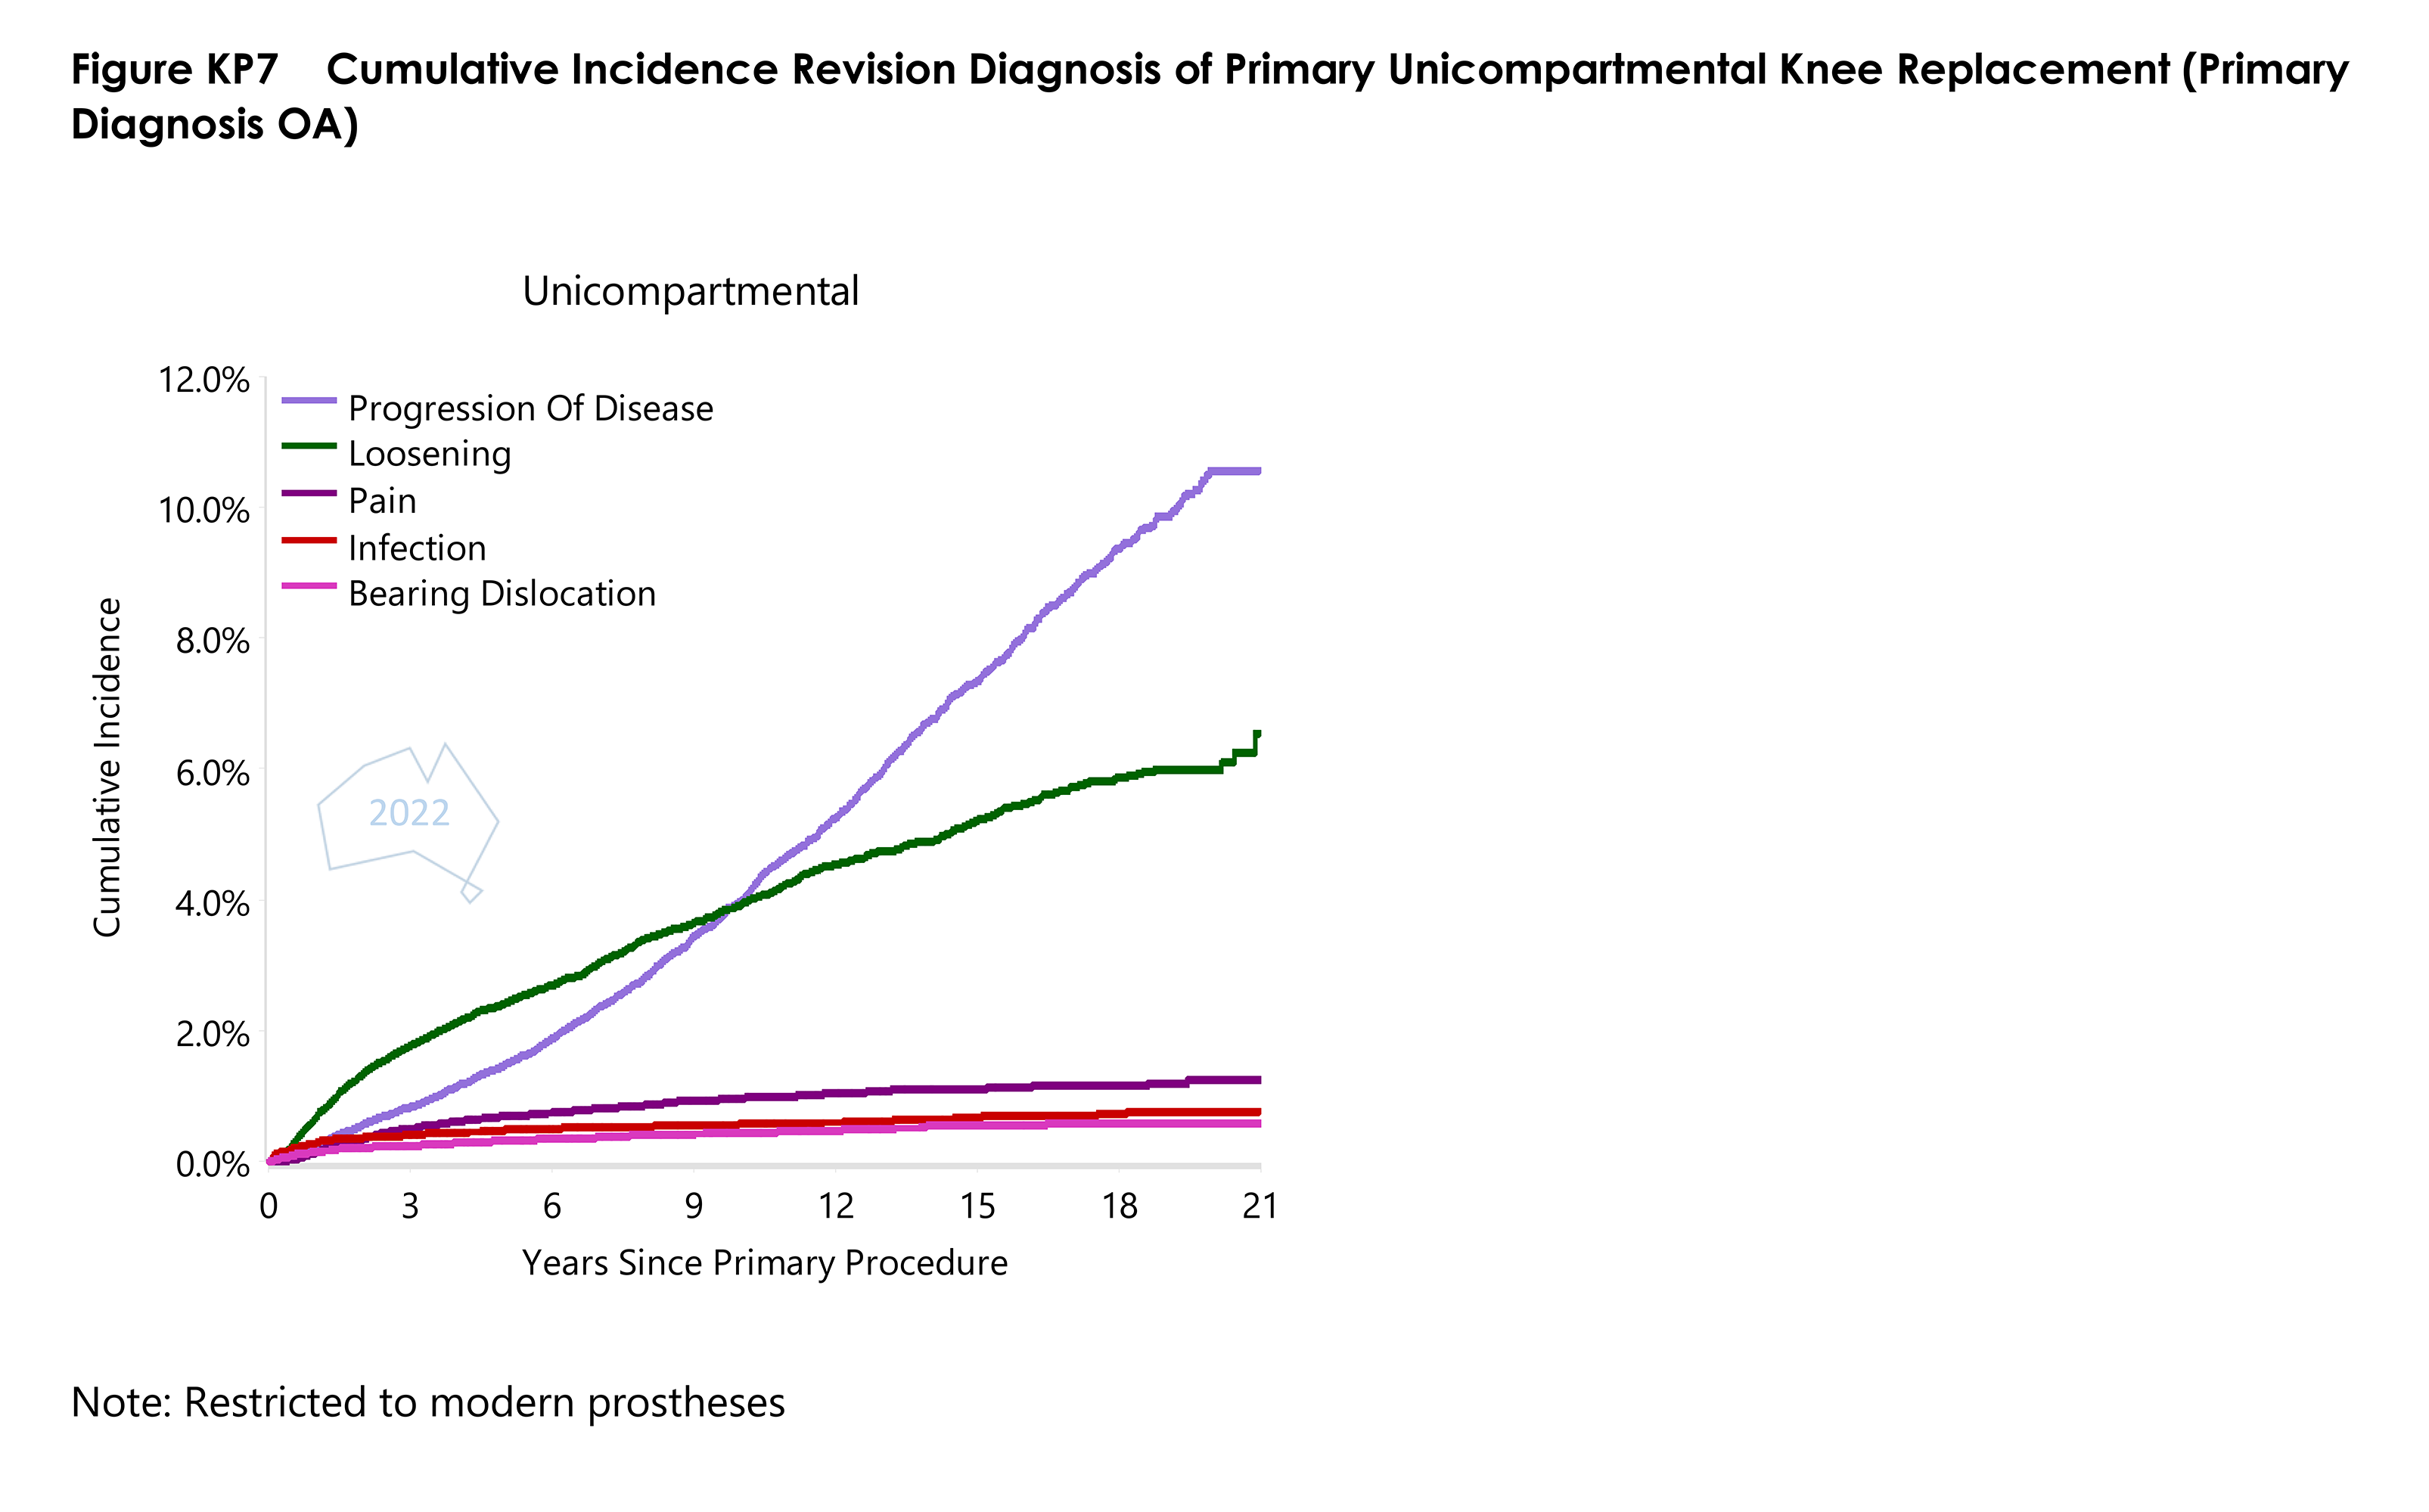
- Figure KP7 Cumulative Incidence Revision Diagnosis of Primary Unicompartmental Knee ReplacementPDF · 170 KB
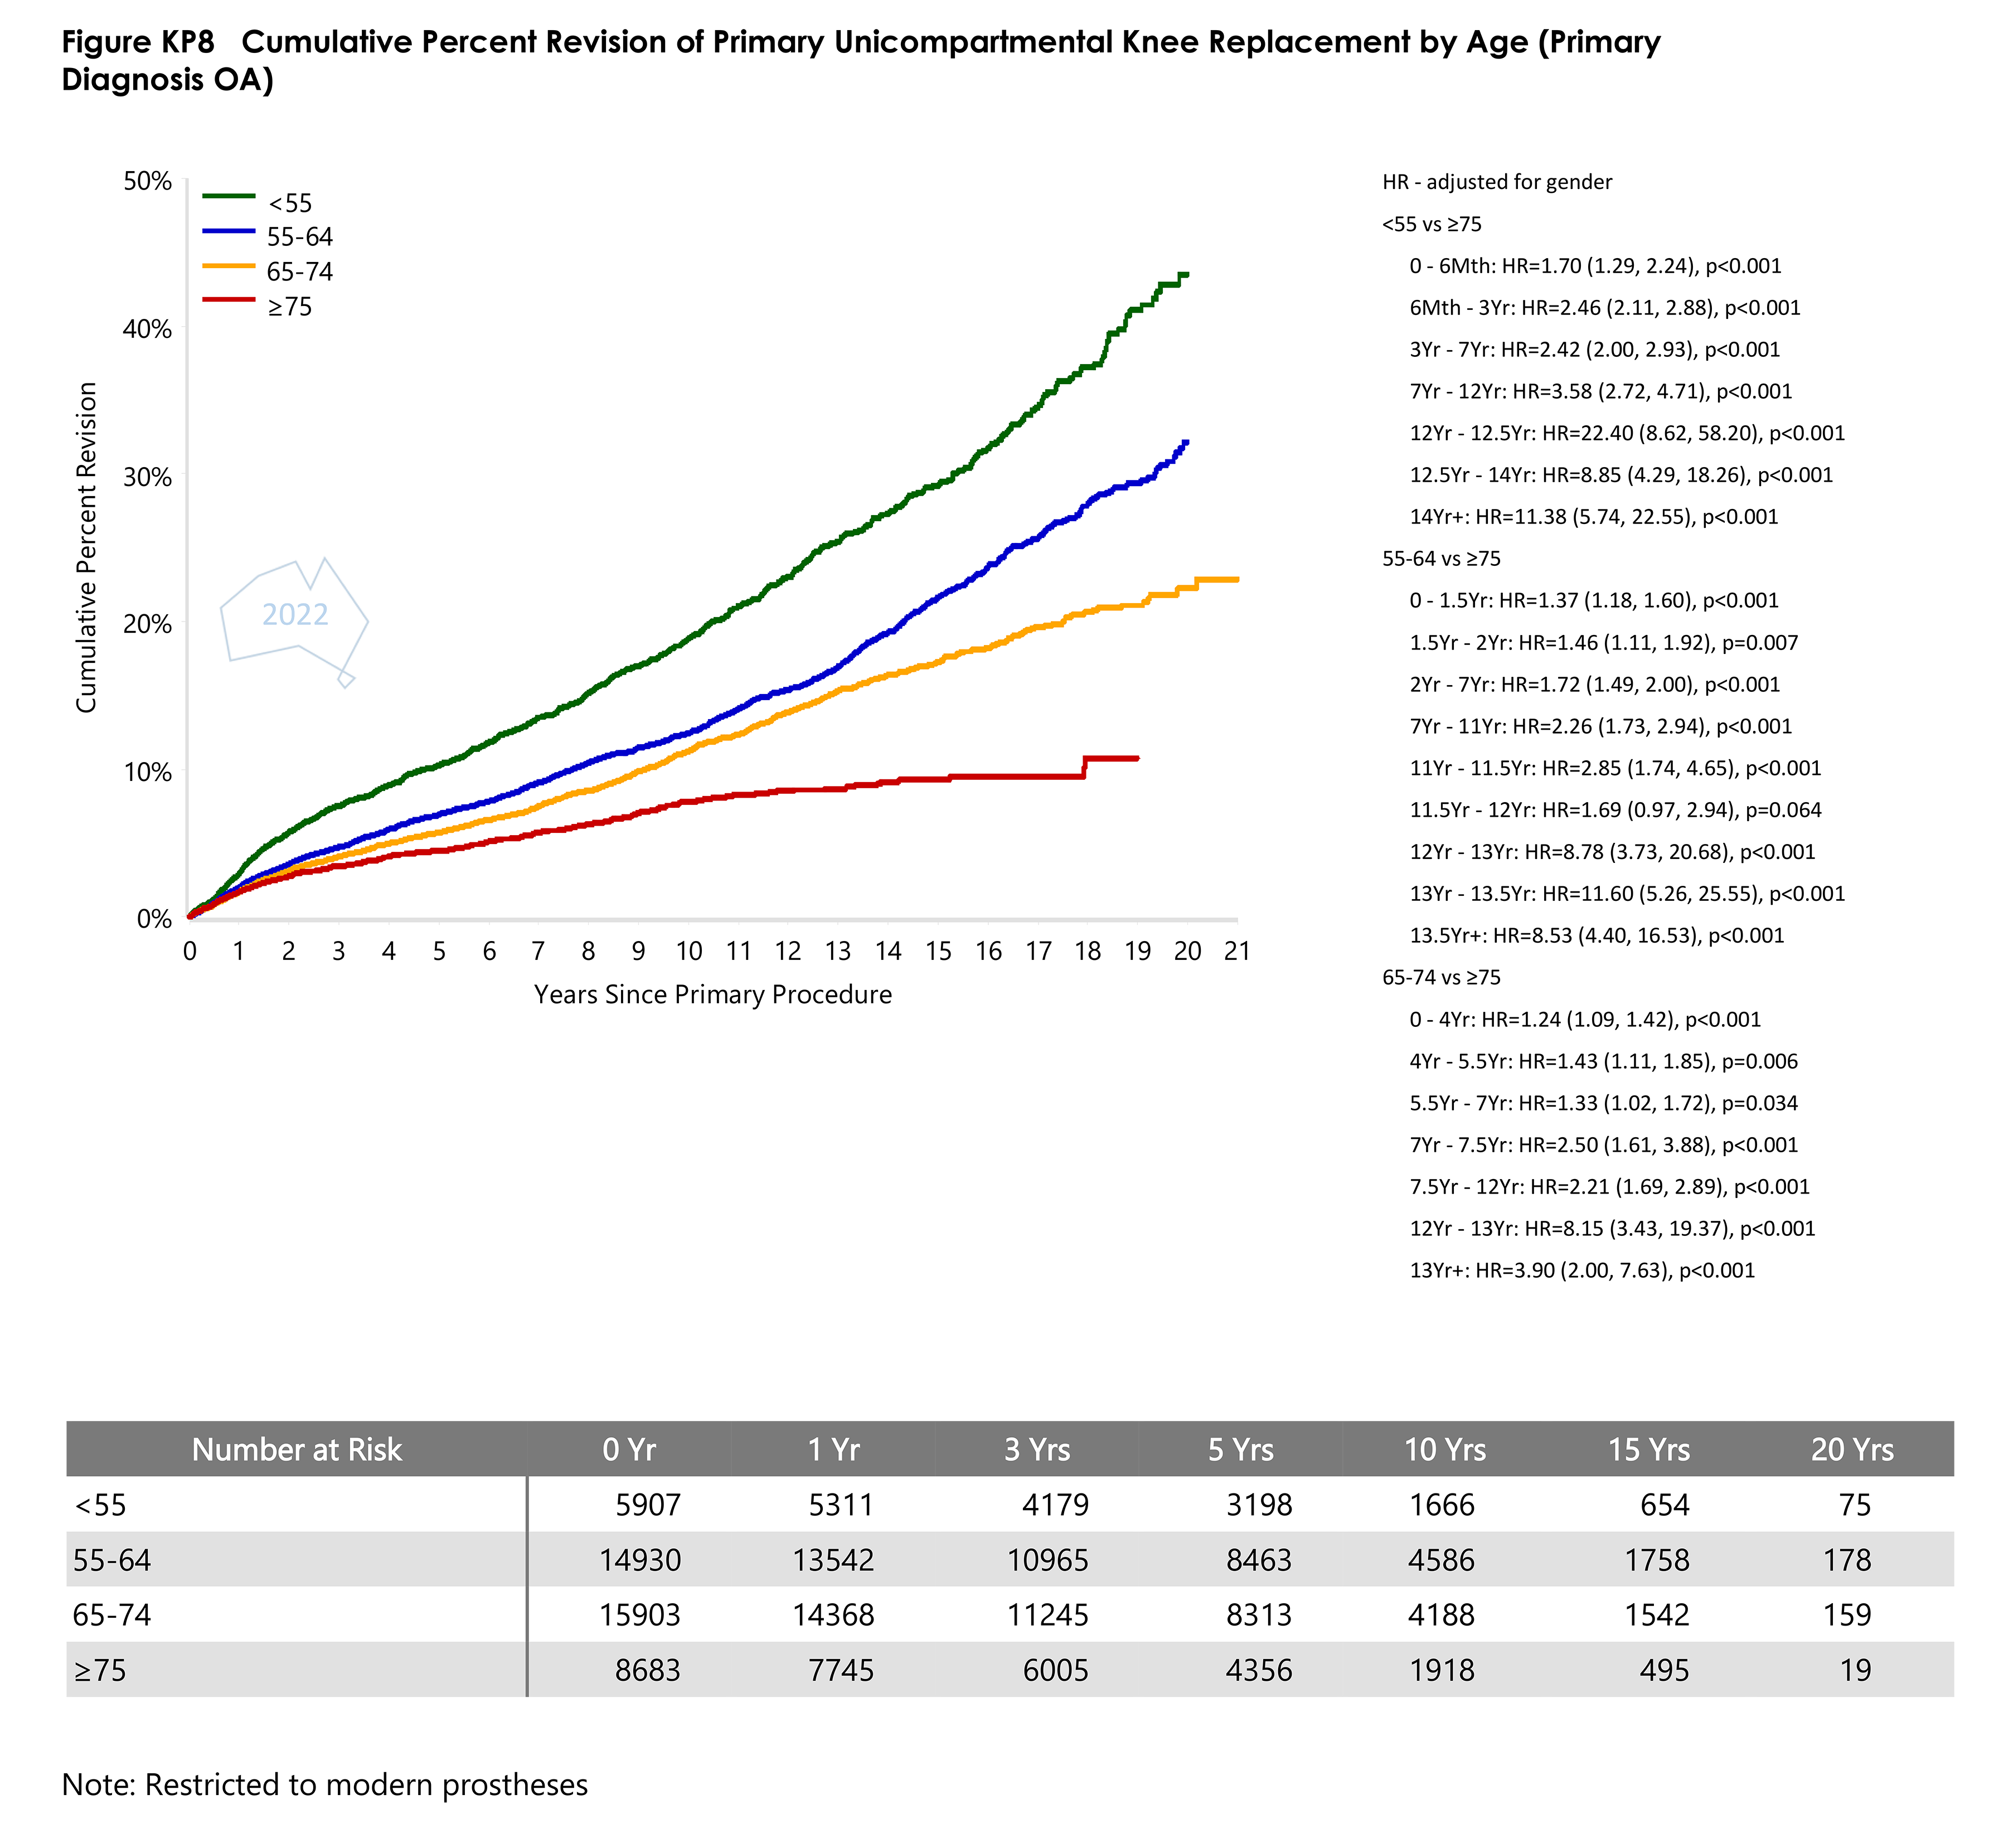
- Figure KP8 Cumulative Percent Revision of Primary Unicompartmental Knee Replacement by Age (Primary Diagnosis OA)PDF · 242 KB
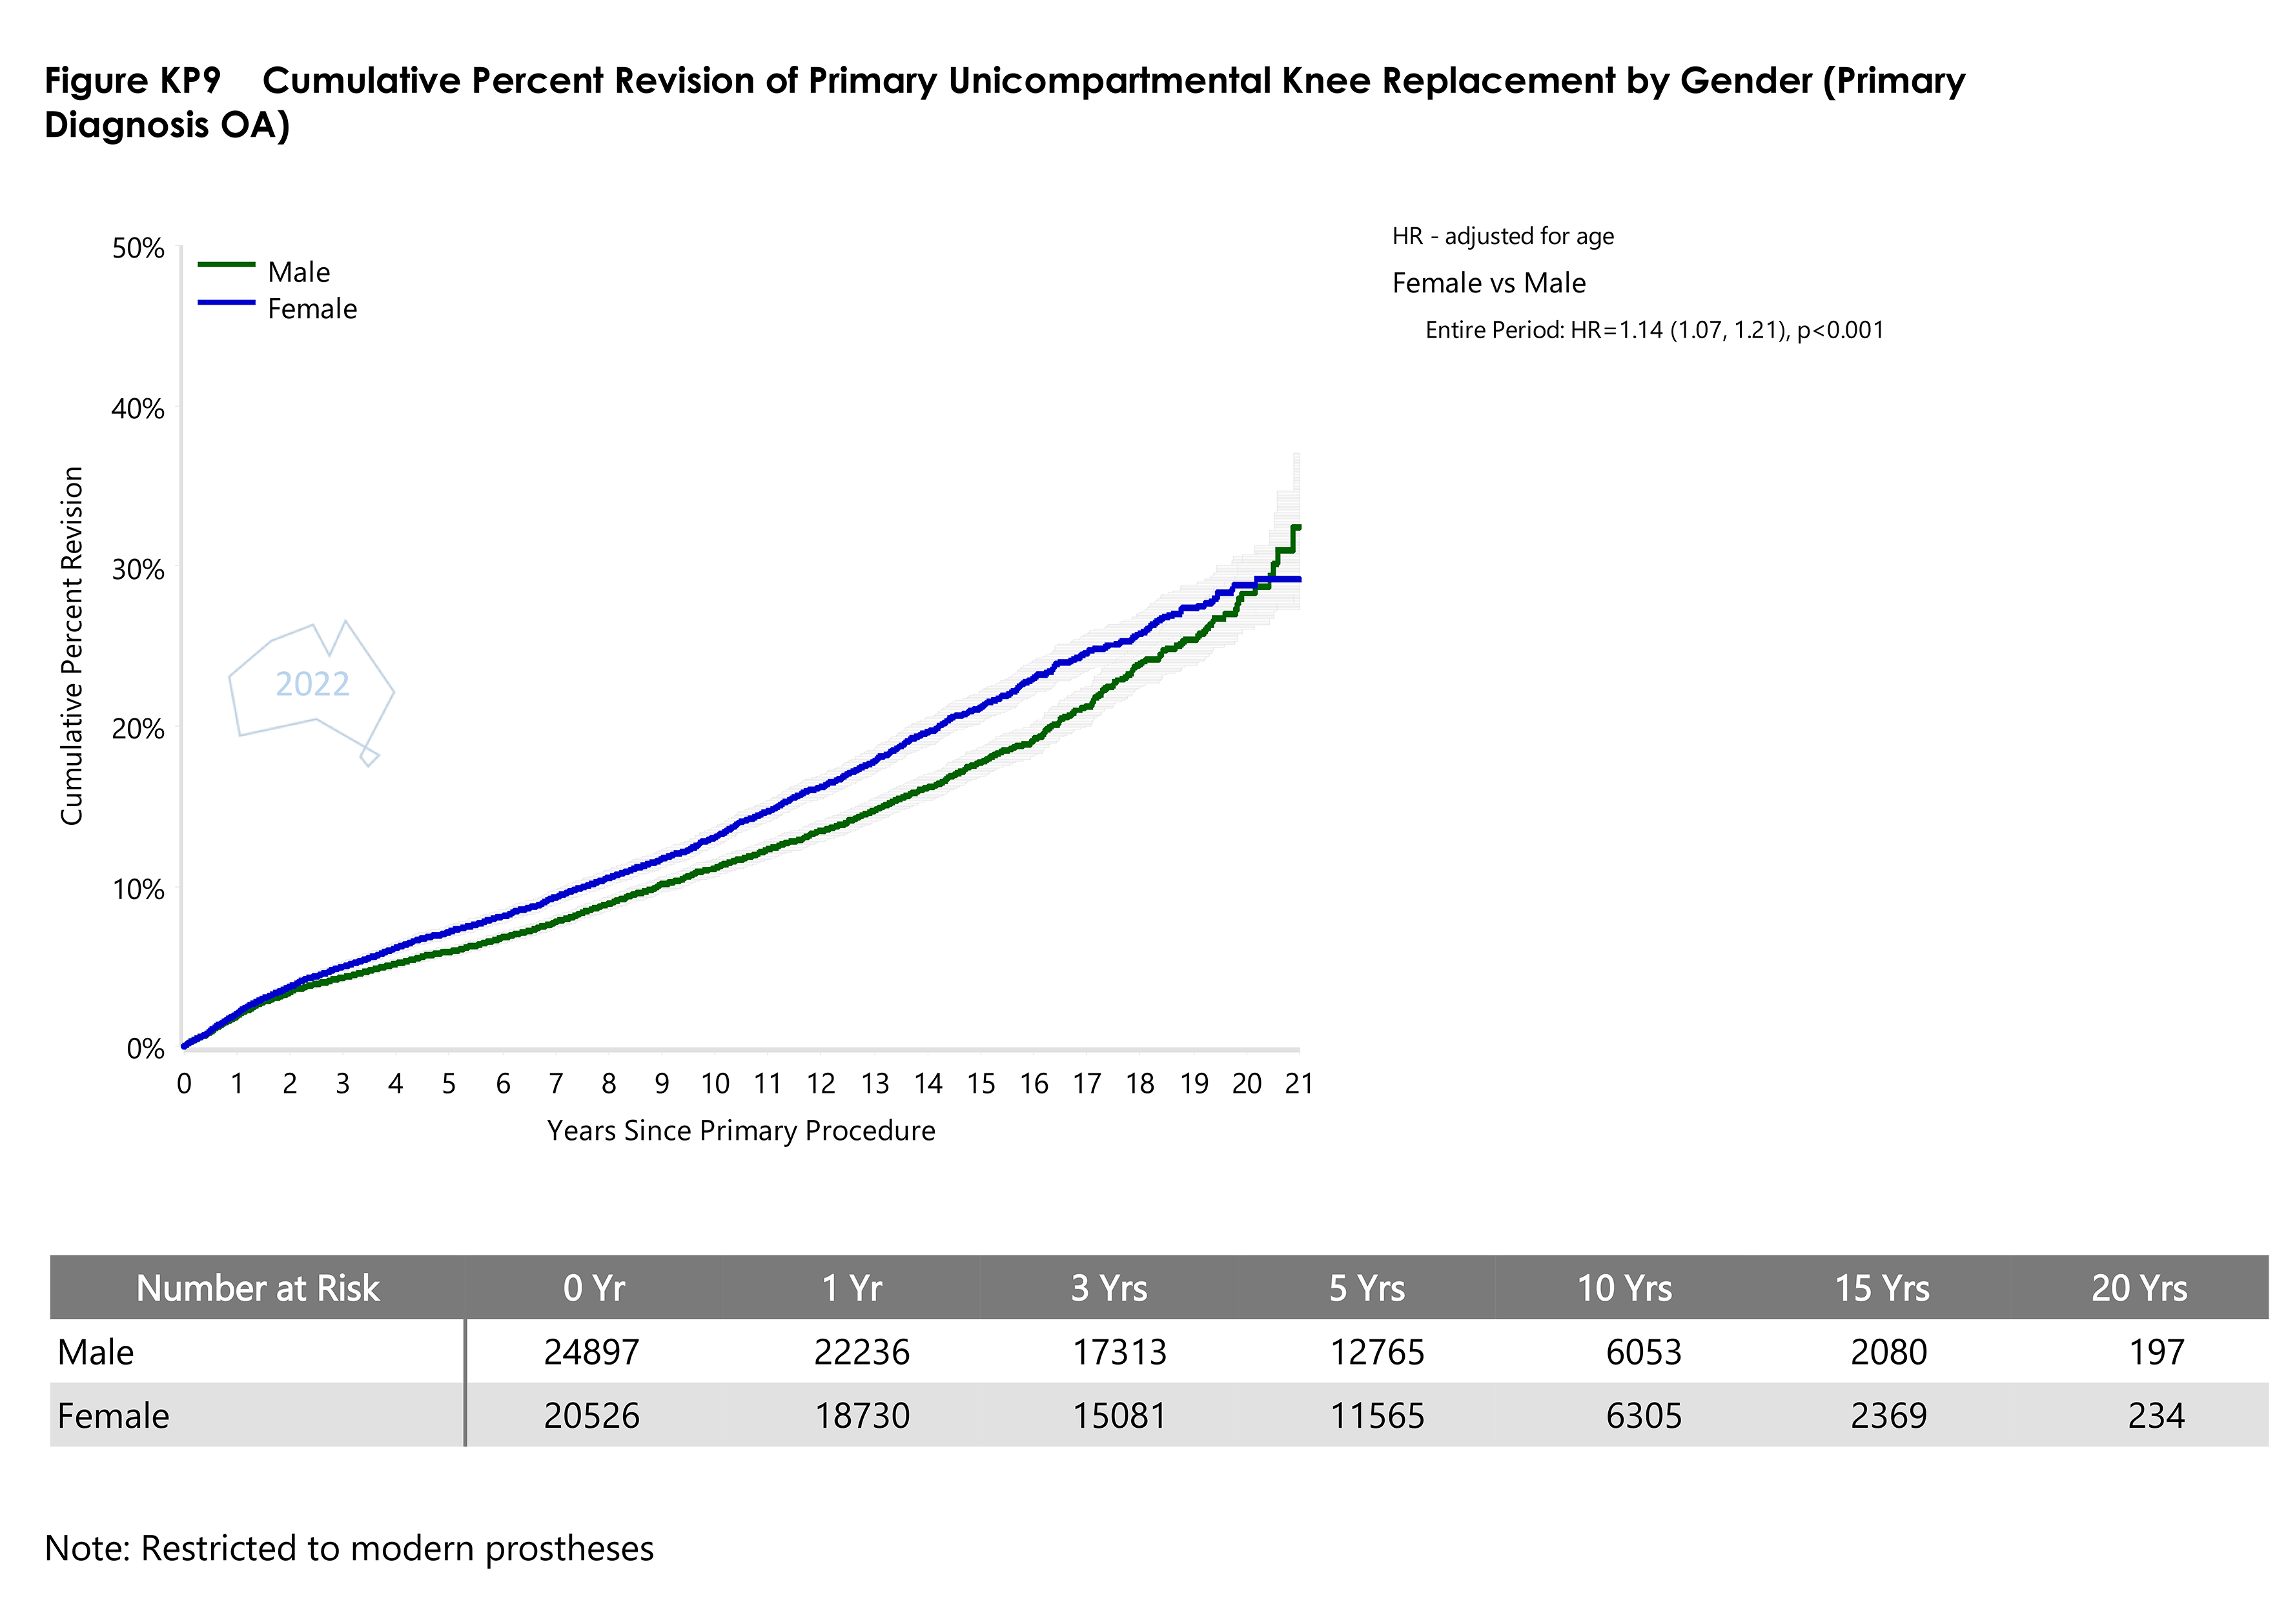
- Figure KP9 Cumulative Percent Revision of Primary Unicompartmental Knee Replacement by GenderPDF · 173 KB
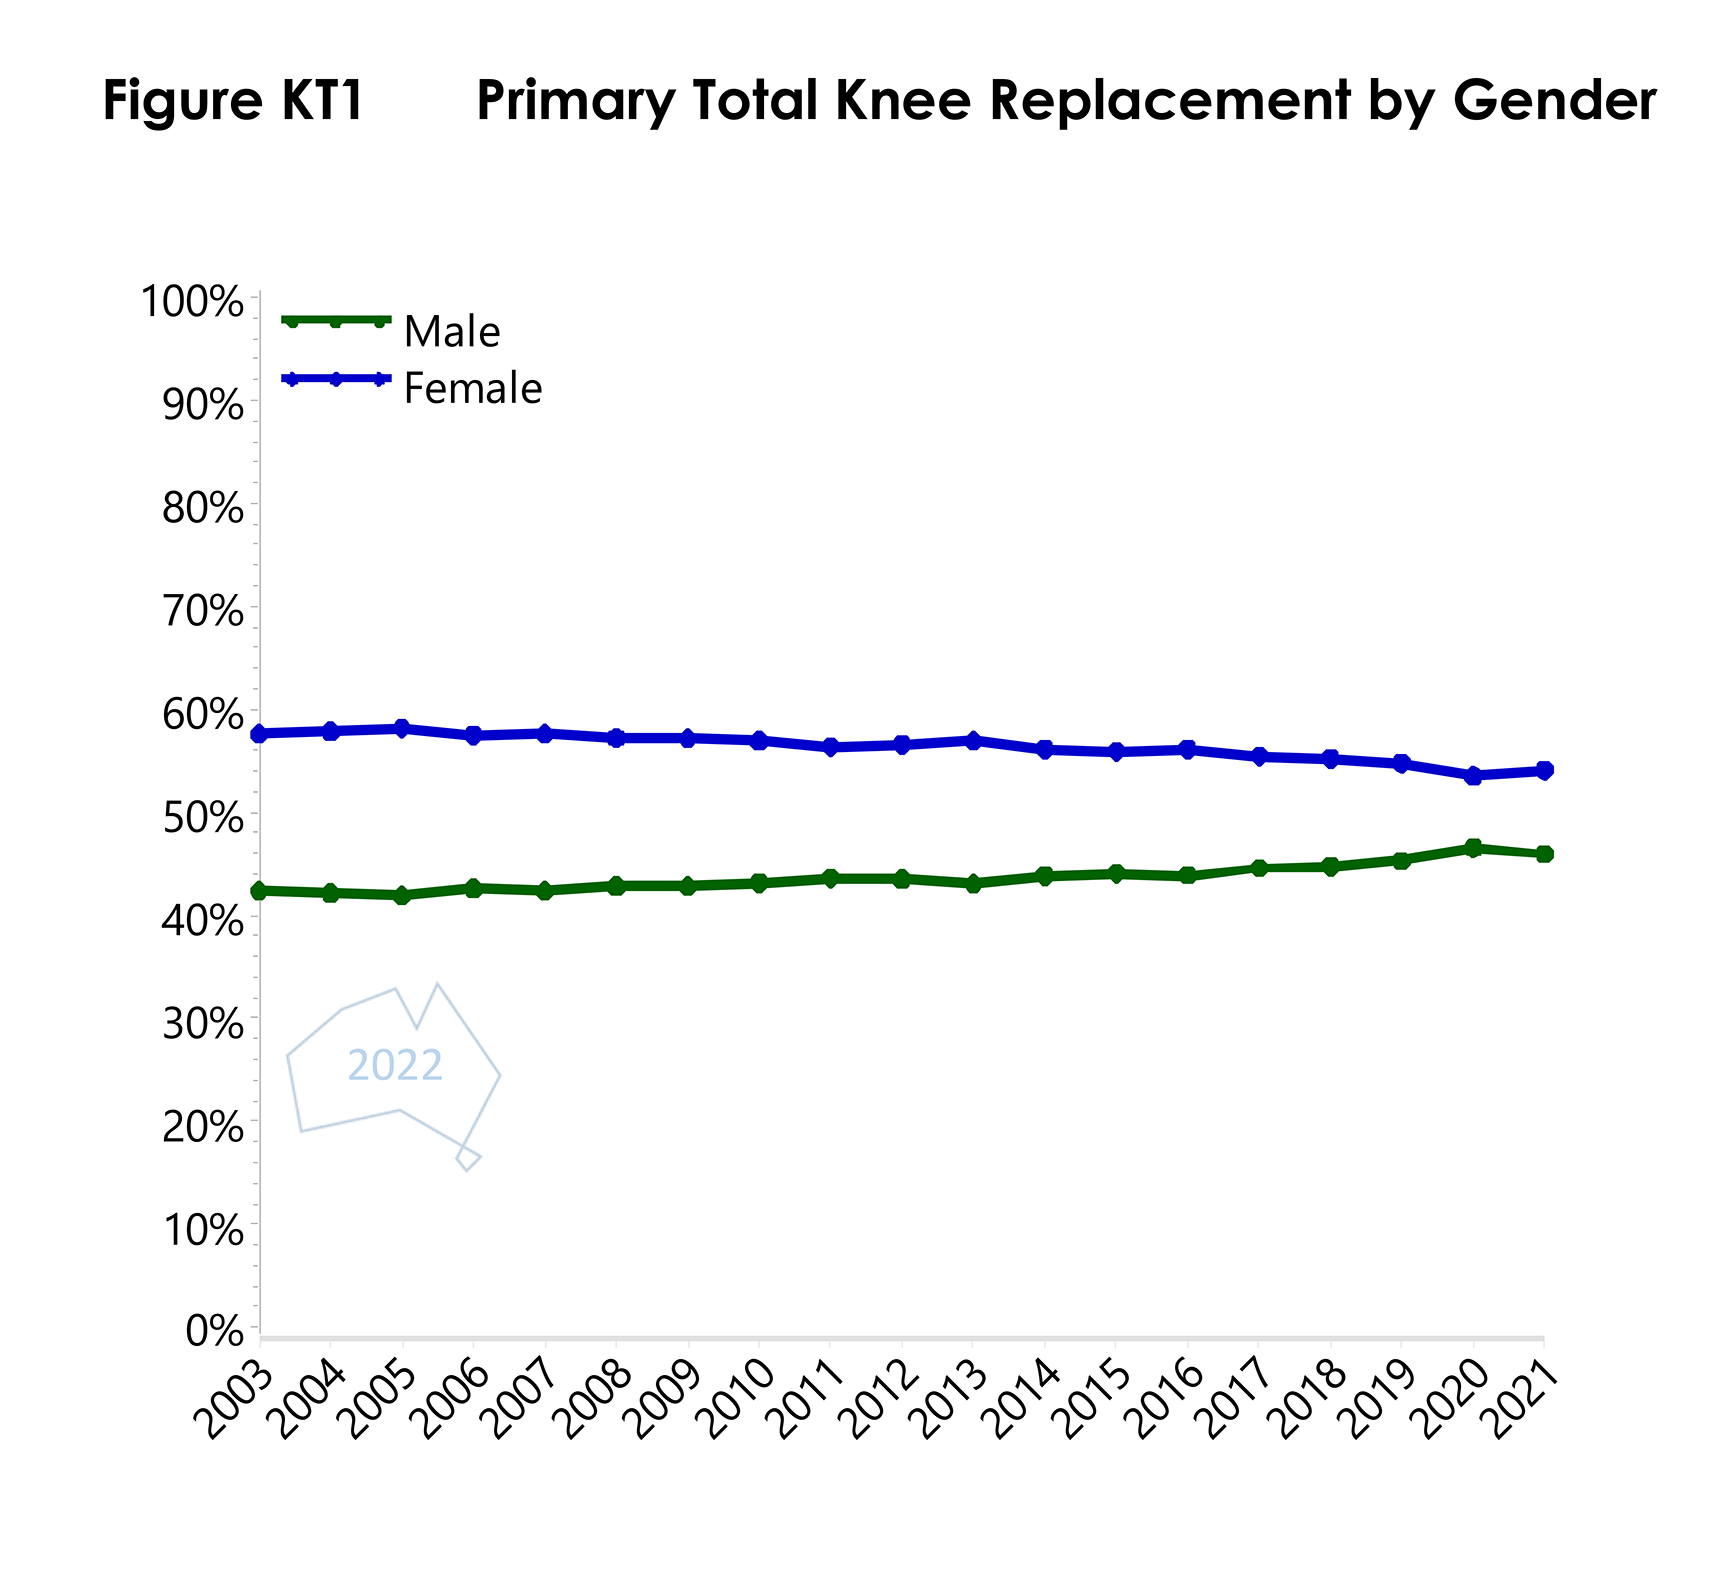
- Figure KT1 Primary Total Knee Replacement by GenderPDF · 40 KB
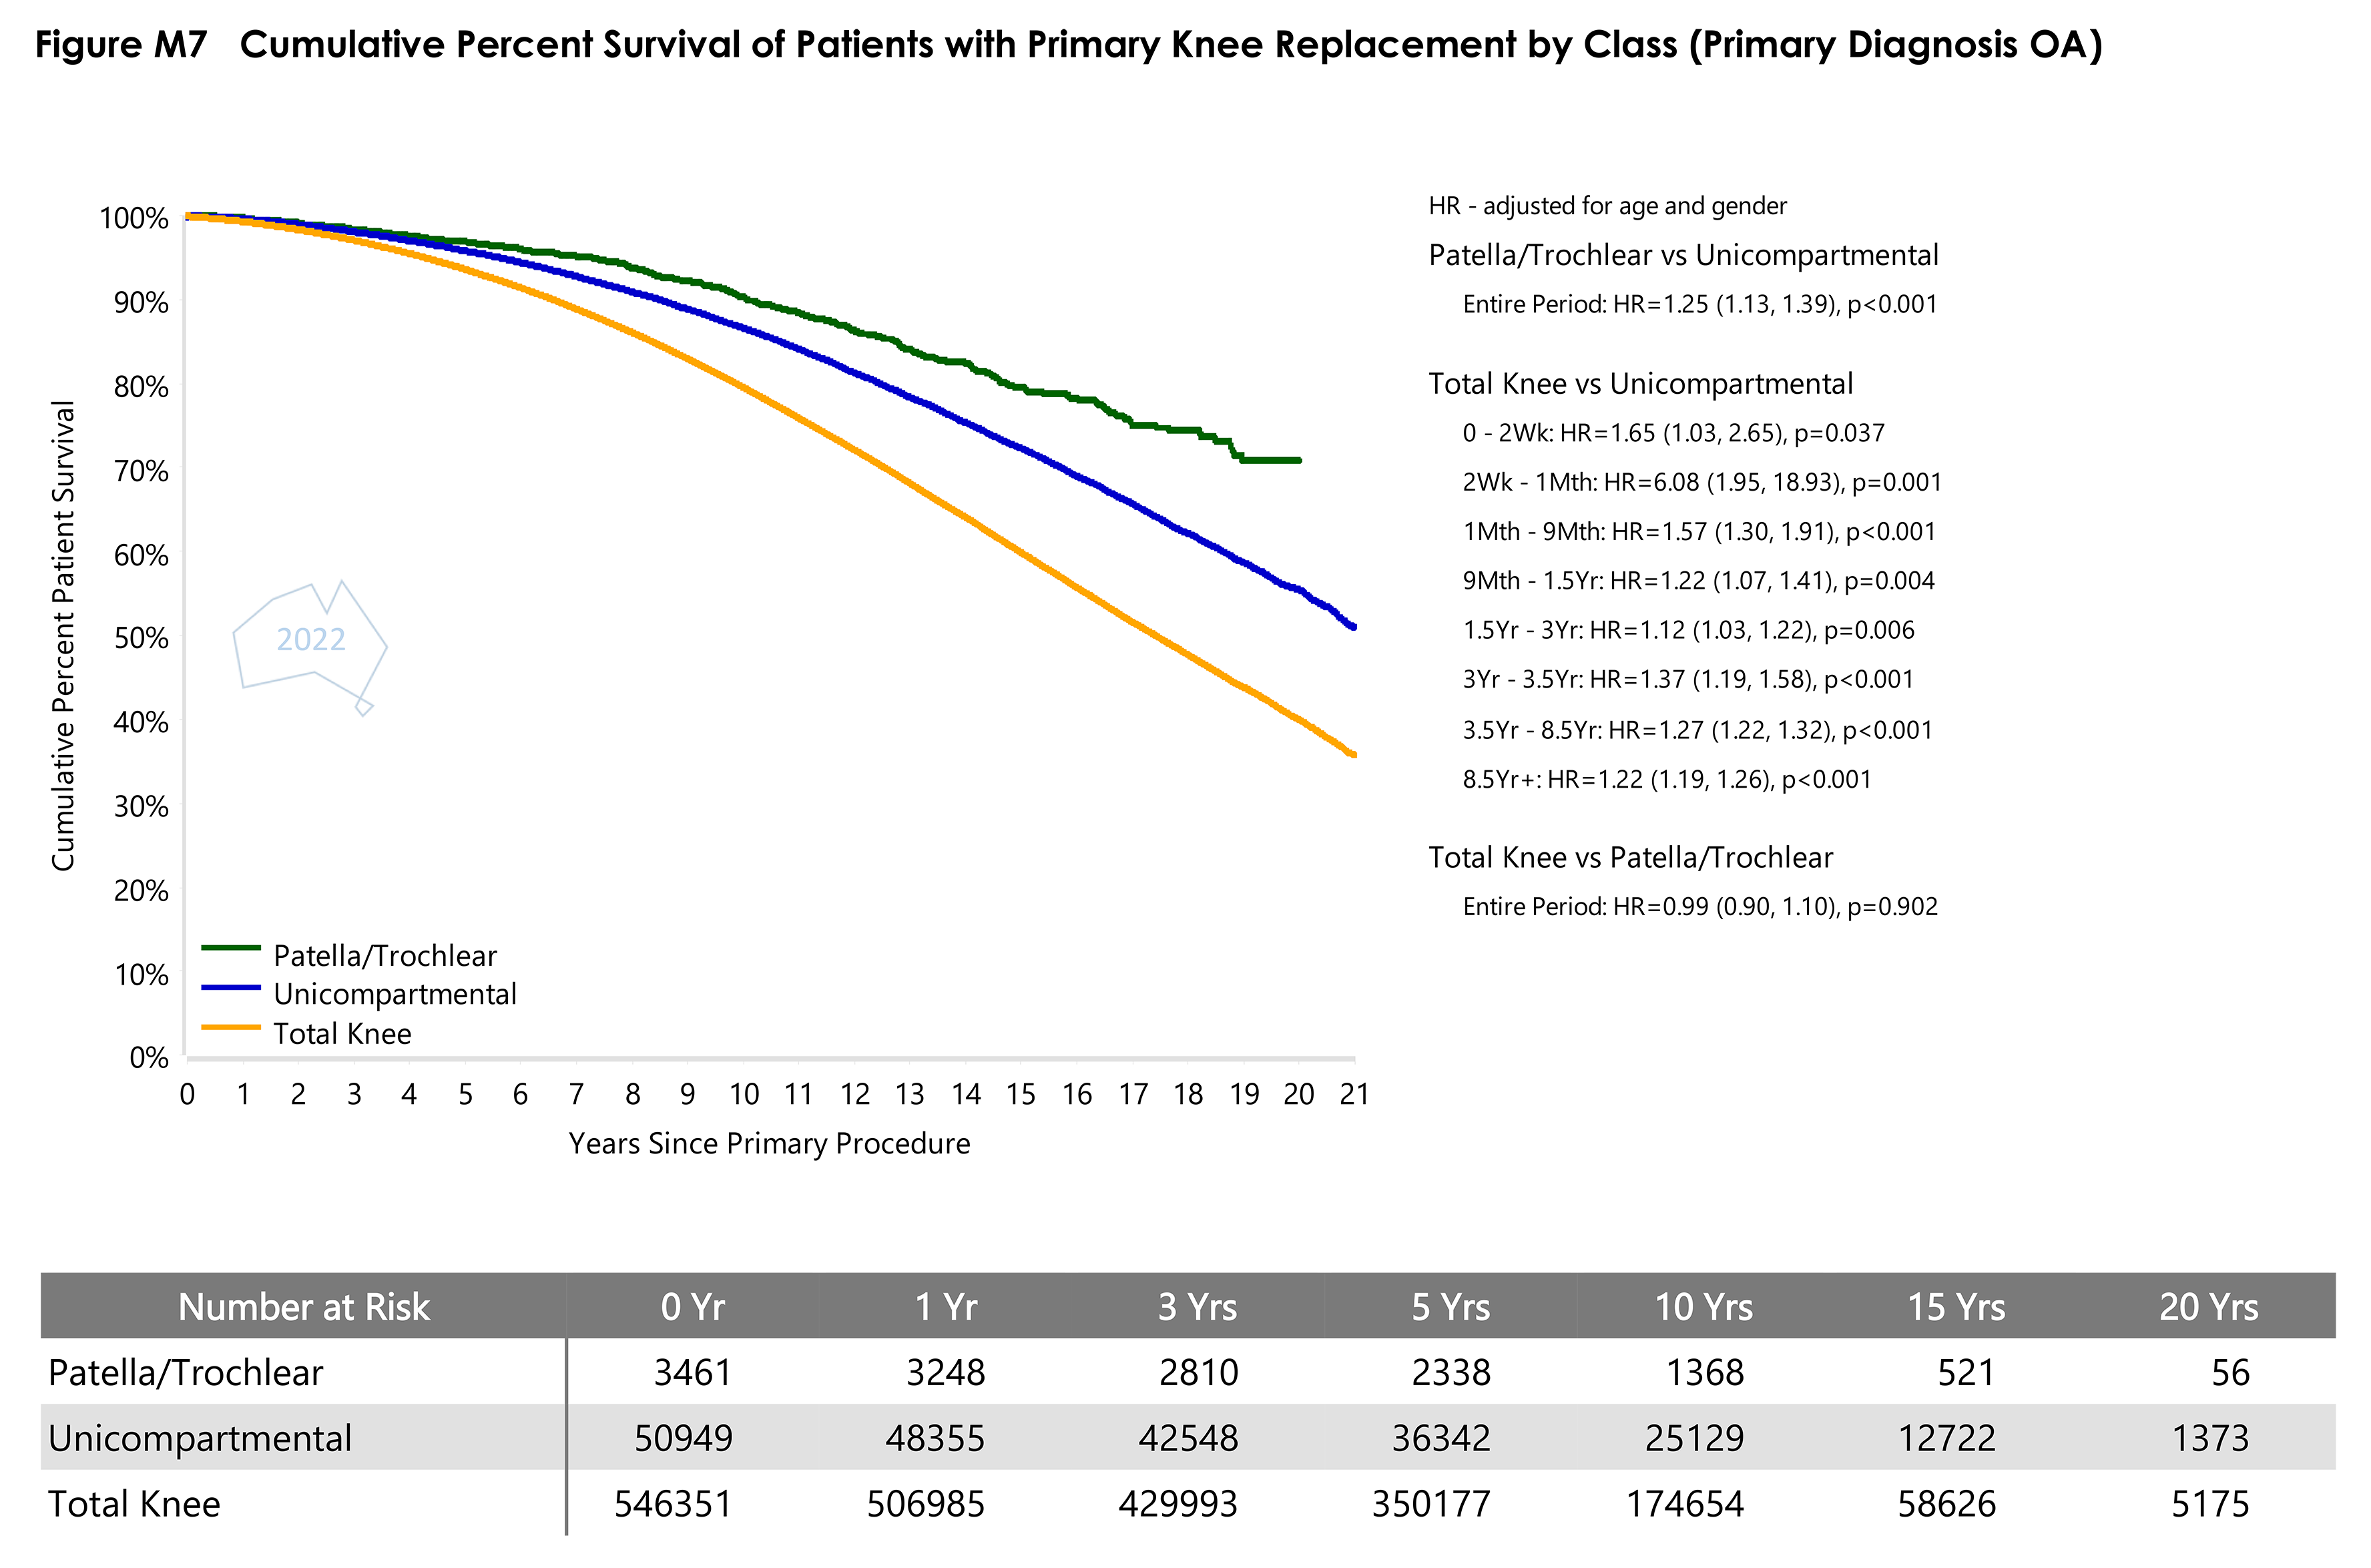
- Figure M7 Cumulative Percent Survival of Patients with Primary Knee Replacement by ClassPDF · 330 KB
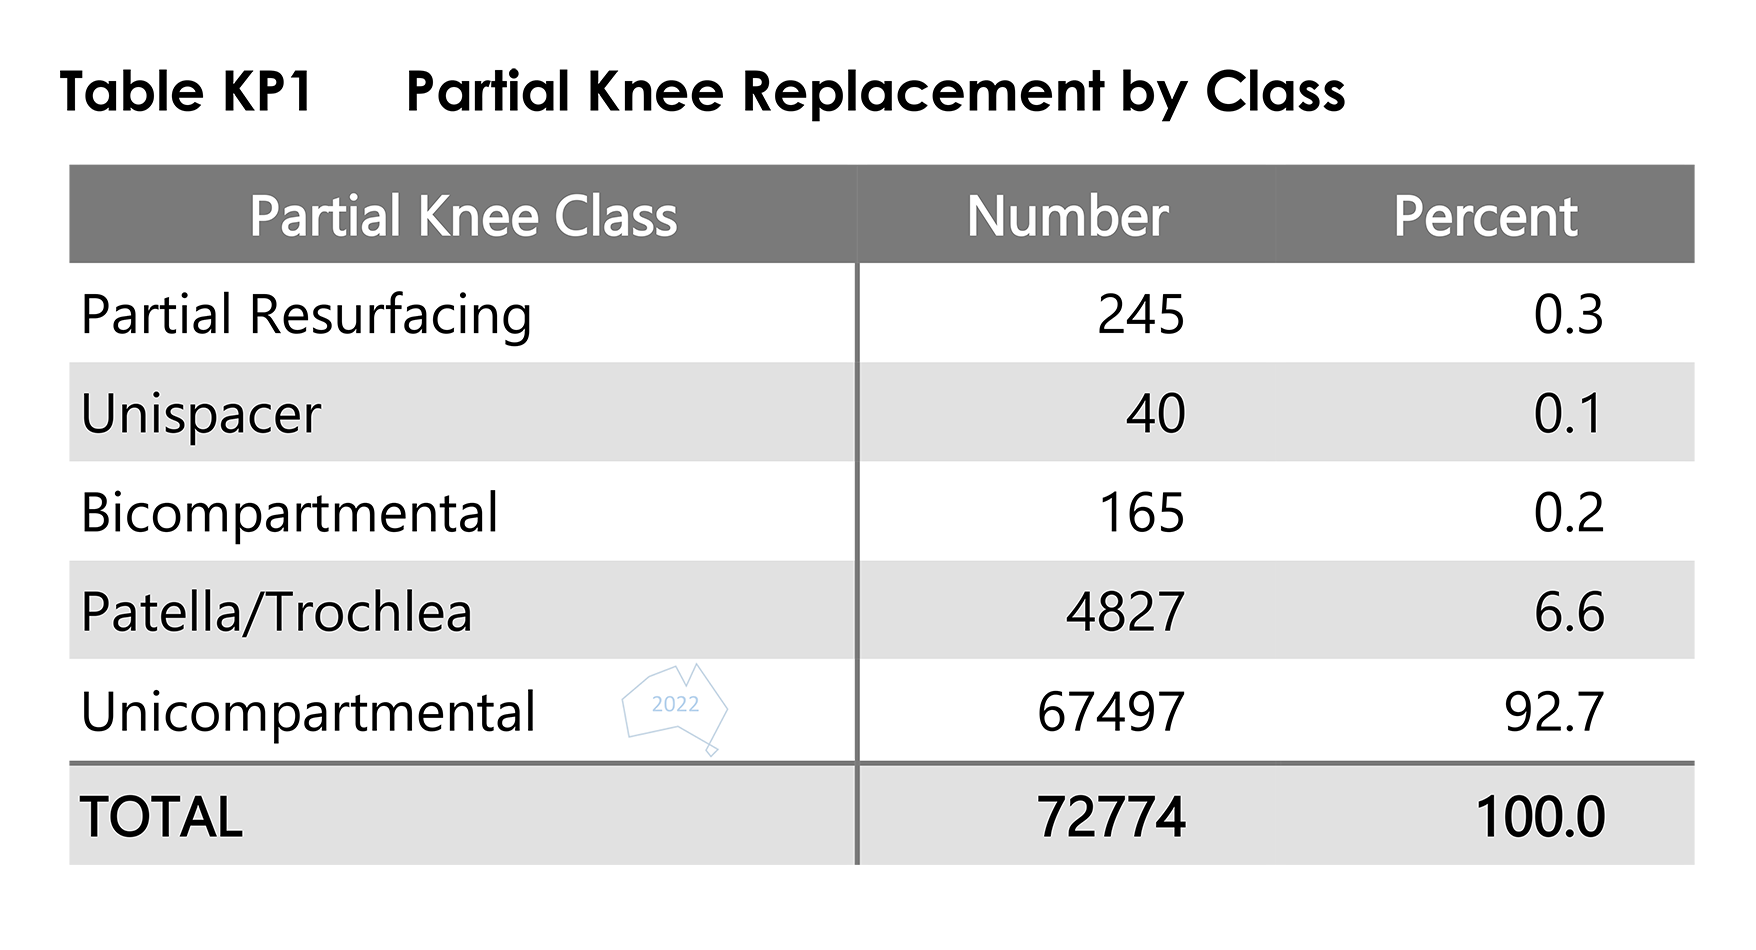
- Table KP1 Partial Knee Replacement by ClassPDF · 44 KB
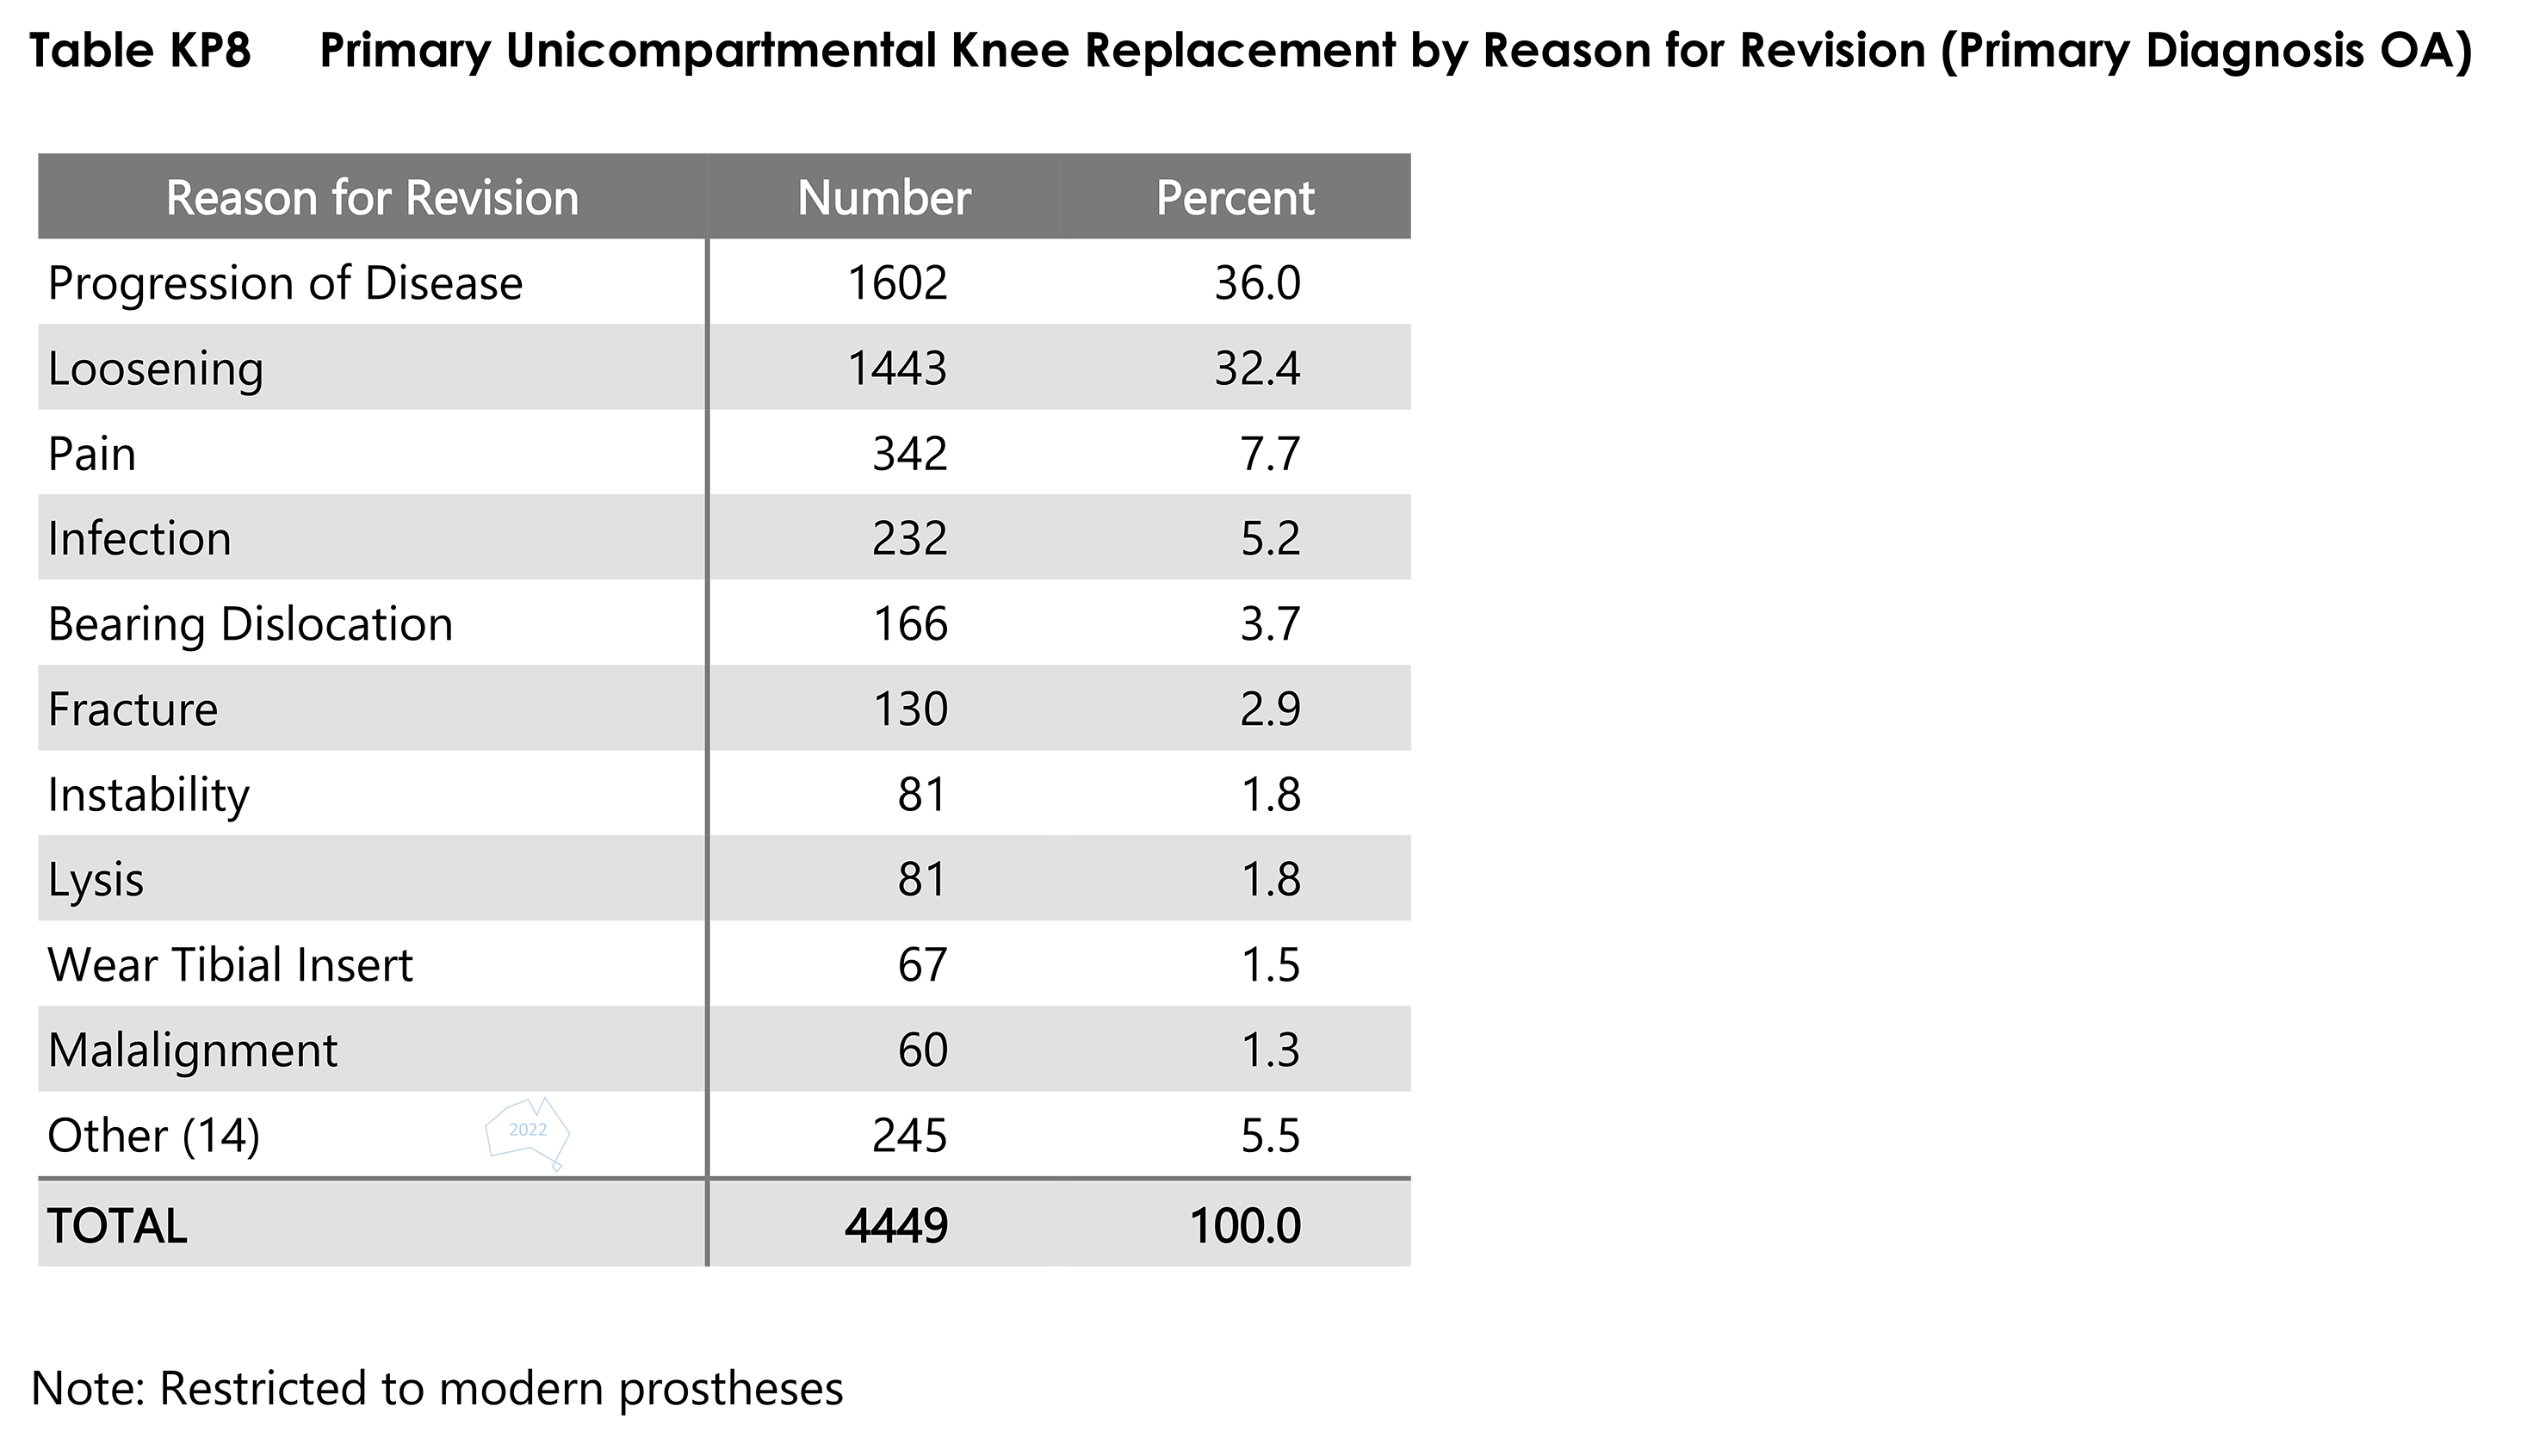
- Table KP8 Primary Unicompartmental Knee Replacement by Reason for RevisionPDF · 49 KB
PNG
- Cumulative Incidence Revision Diagnosis of Primary Unicompartmental Knee Replacement by PositionPNG · 779 KB
- Figure KP1 Cumulative Percent Revision of Primary Patella copyPNG · 526 KB
- Figure KP13 Cumulative Percent Revision of Primary Unicompartmental Knee Replacement by Mobility copyPNG · 796 KB
- Figure KP14 Cumulative Percent Revision of Primary Unicompartmental Knee Replacement Since 2015 by Robotic Assistance copyPNG · 623 KB
- Figure KP16 Cumulative Incidence Revision Diagnosis of Primary Unicompartmental Knee Replacement Since 2015 by Robotic Assistance copyPNG · 600 KB
- Figure KP17 Cumulative Percent Revision of Primary Unicompartmental Knee Replacement by Position copyPNG · 747 KB
- Figure KP5 Primary Unicompartmental Knee Replacement by Robotic Assistance copyPNG · 362 KB
- Figure KP6 Cumulative Percent Revision of Primary Unicompartmental Knee Replacement copyPNG · 523 KB
- Figure KP7 Cumulative Incidence Revision Diagnosis of Primary Unicompartmental Knee Replacement copyPNG · 537 KB
- Figure KP8 Cumulative Percent Revision of Primary Unicompartmental Knee Replacement by Age (Primary Diagnosis OA) copyPNG · 1.3 MB
- Figure KP9 Cumulative Percent Revision of Primary Unicompartmental Knee Replacement by Gender copyPNG · 820 KB
- Figure KT1 Primary Total Knee Replacement by Gender copyPNG · 292 KB
- Figure M7 Cumulative Percent Survival of Patients with Primary Knee Replacement by Class copyPNG · 986 KB
- Table KP1 Partial Knee Replacement by Class copyPNG · 235 KB
- Table KP8 Primary Unicompartmental Knee Replacement by Reason for Revision copyPNG · 421 KB
Total Knees
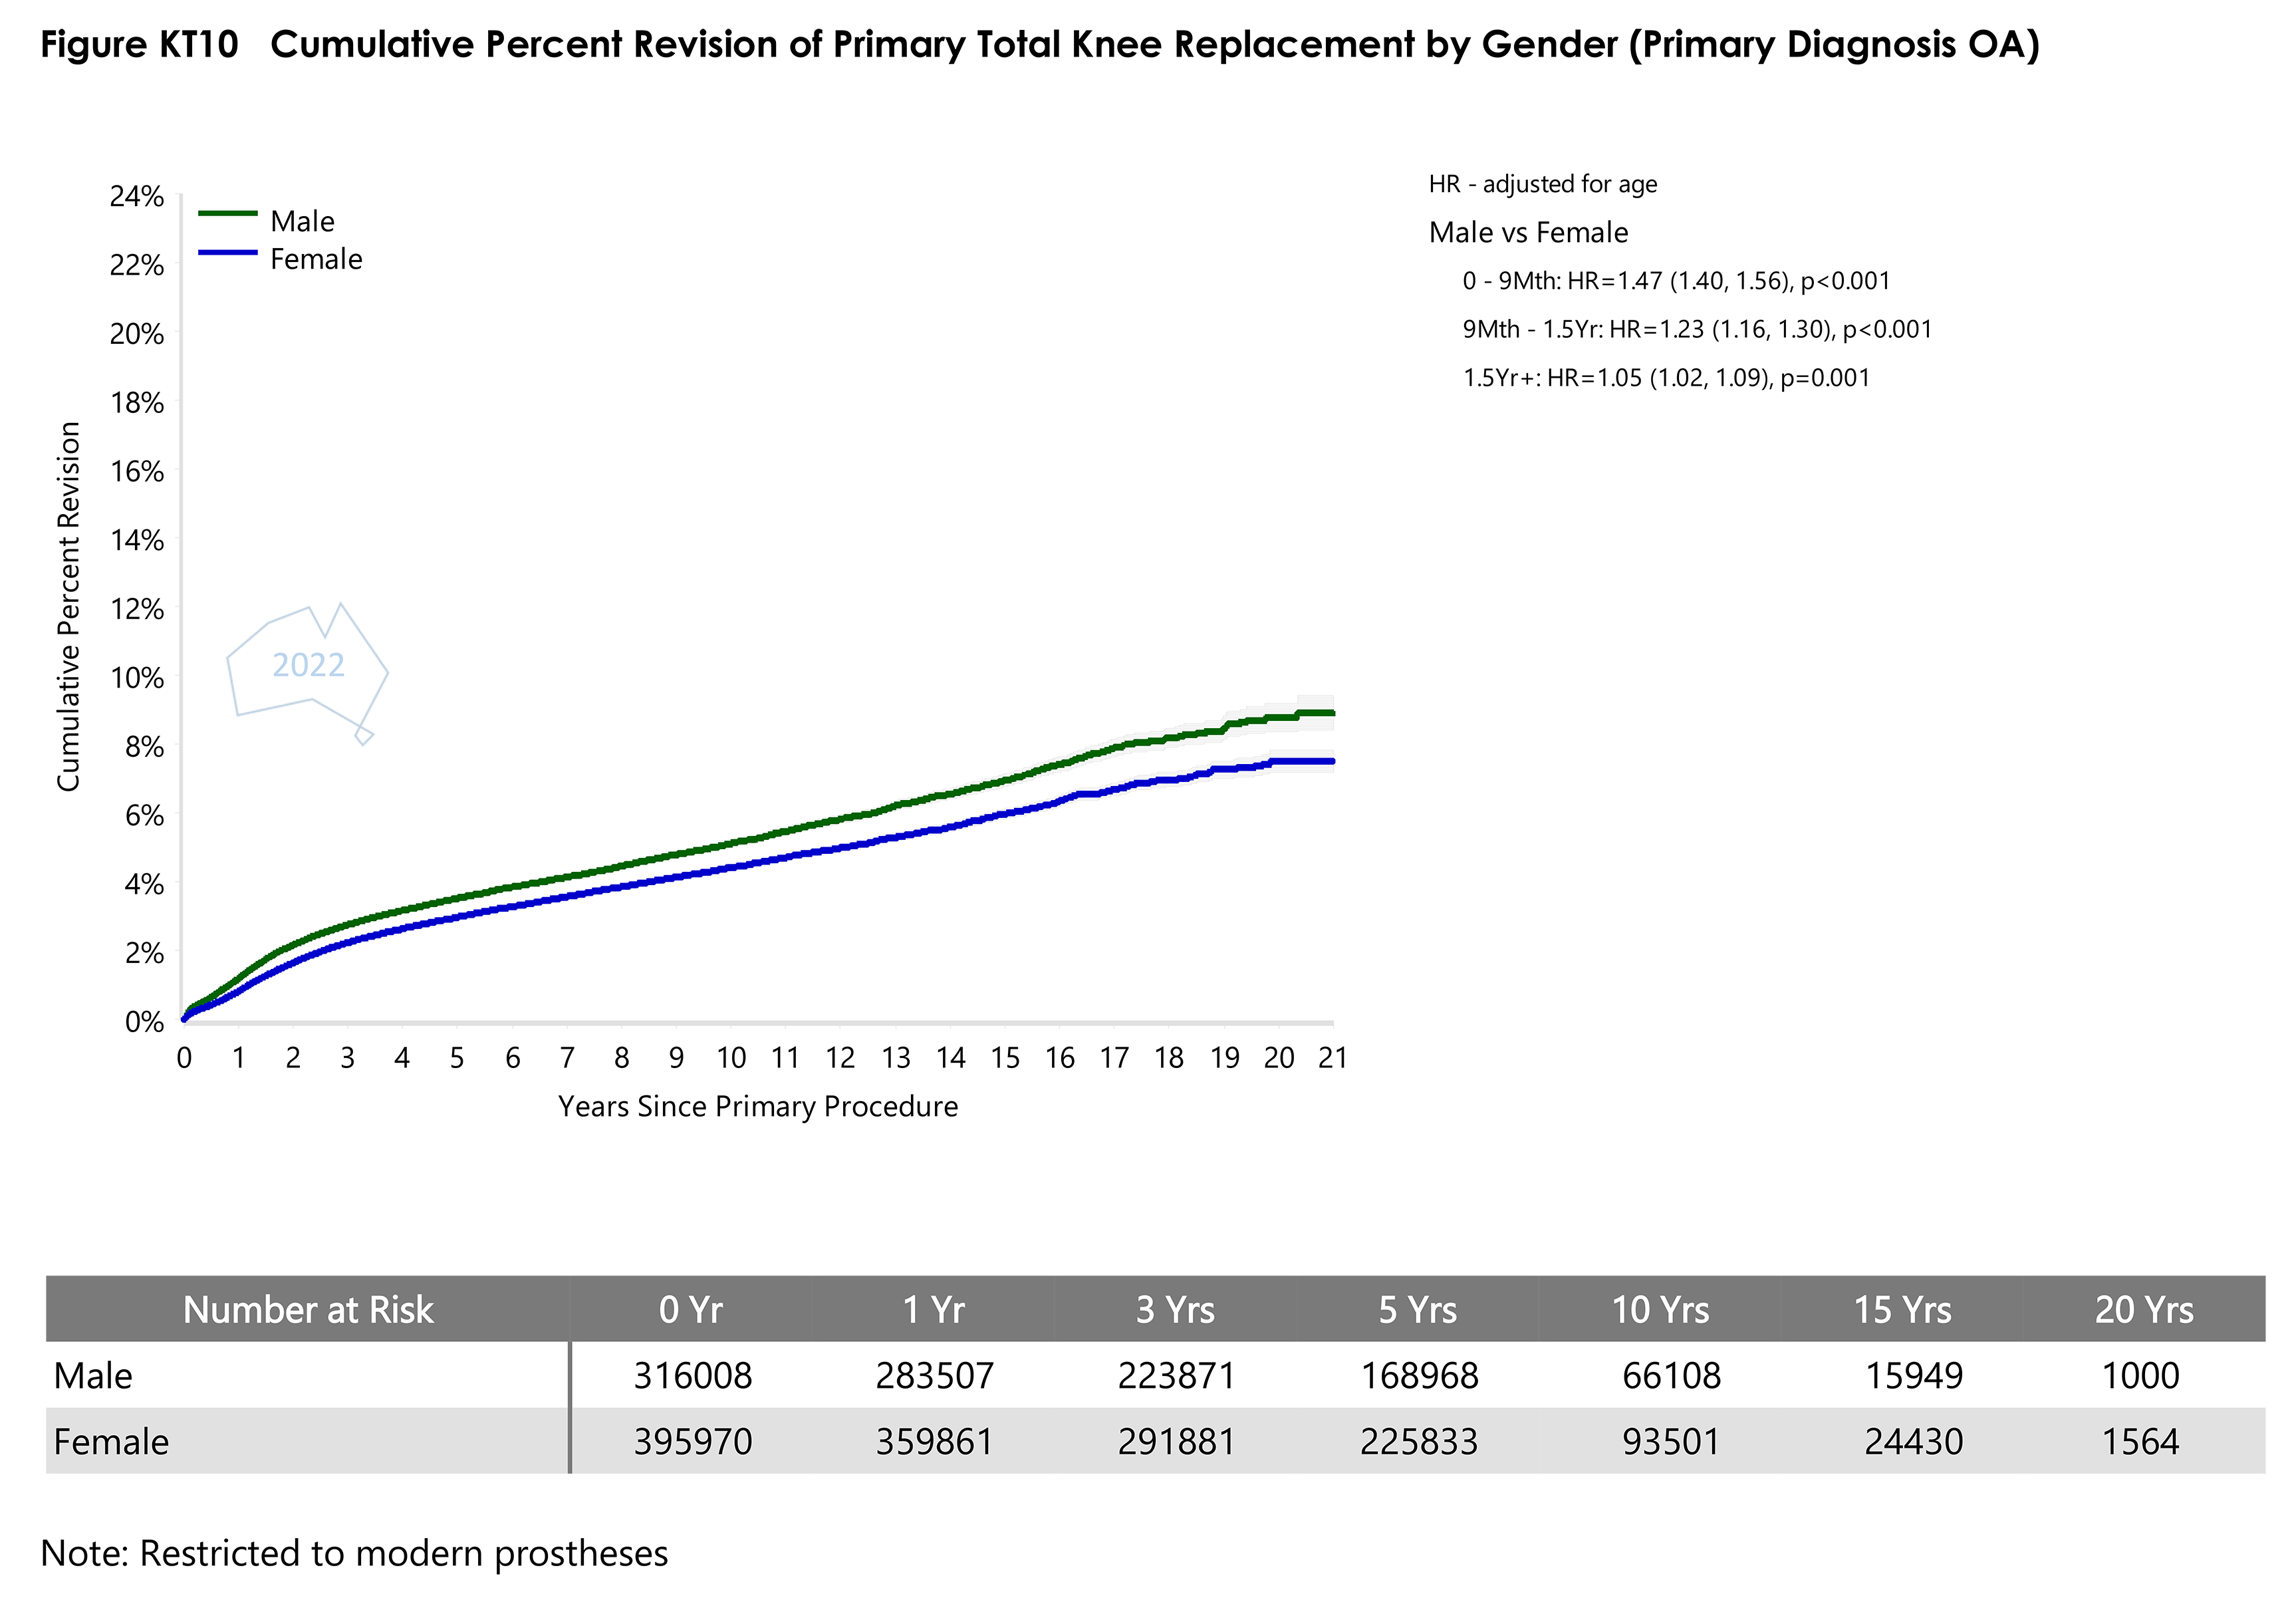
- Figure KT10 Cumulative Percent Revision of Primary Total Knee Replacement by GenderPDF · 221 KB
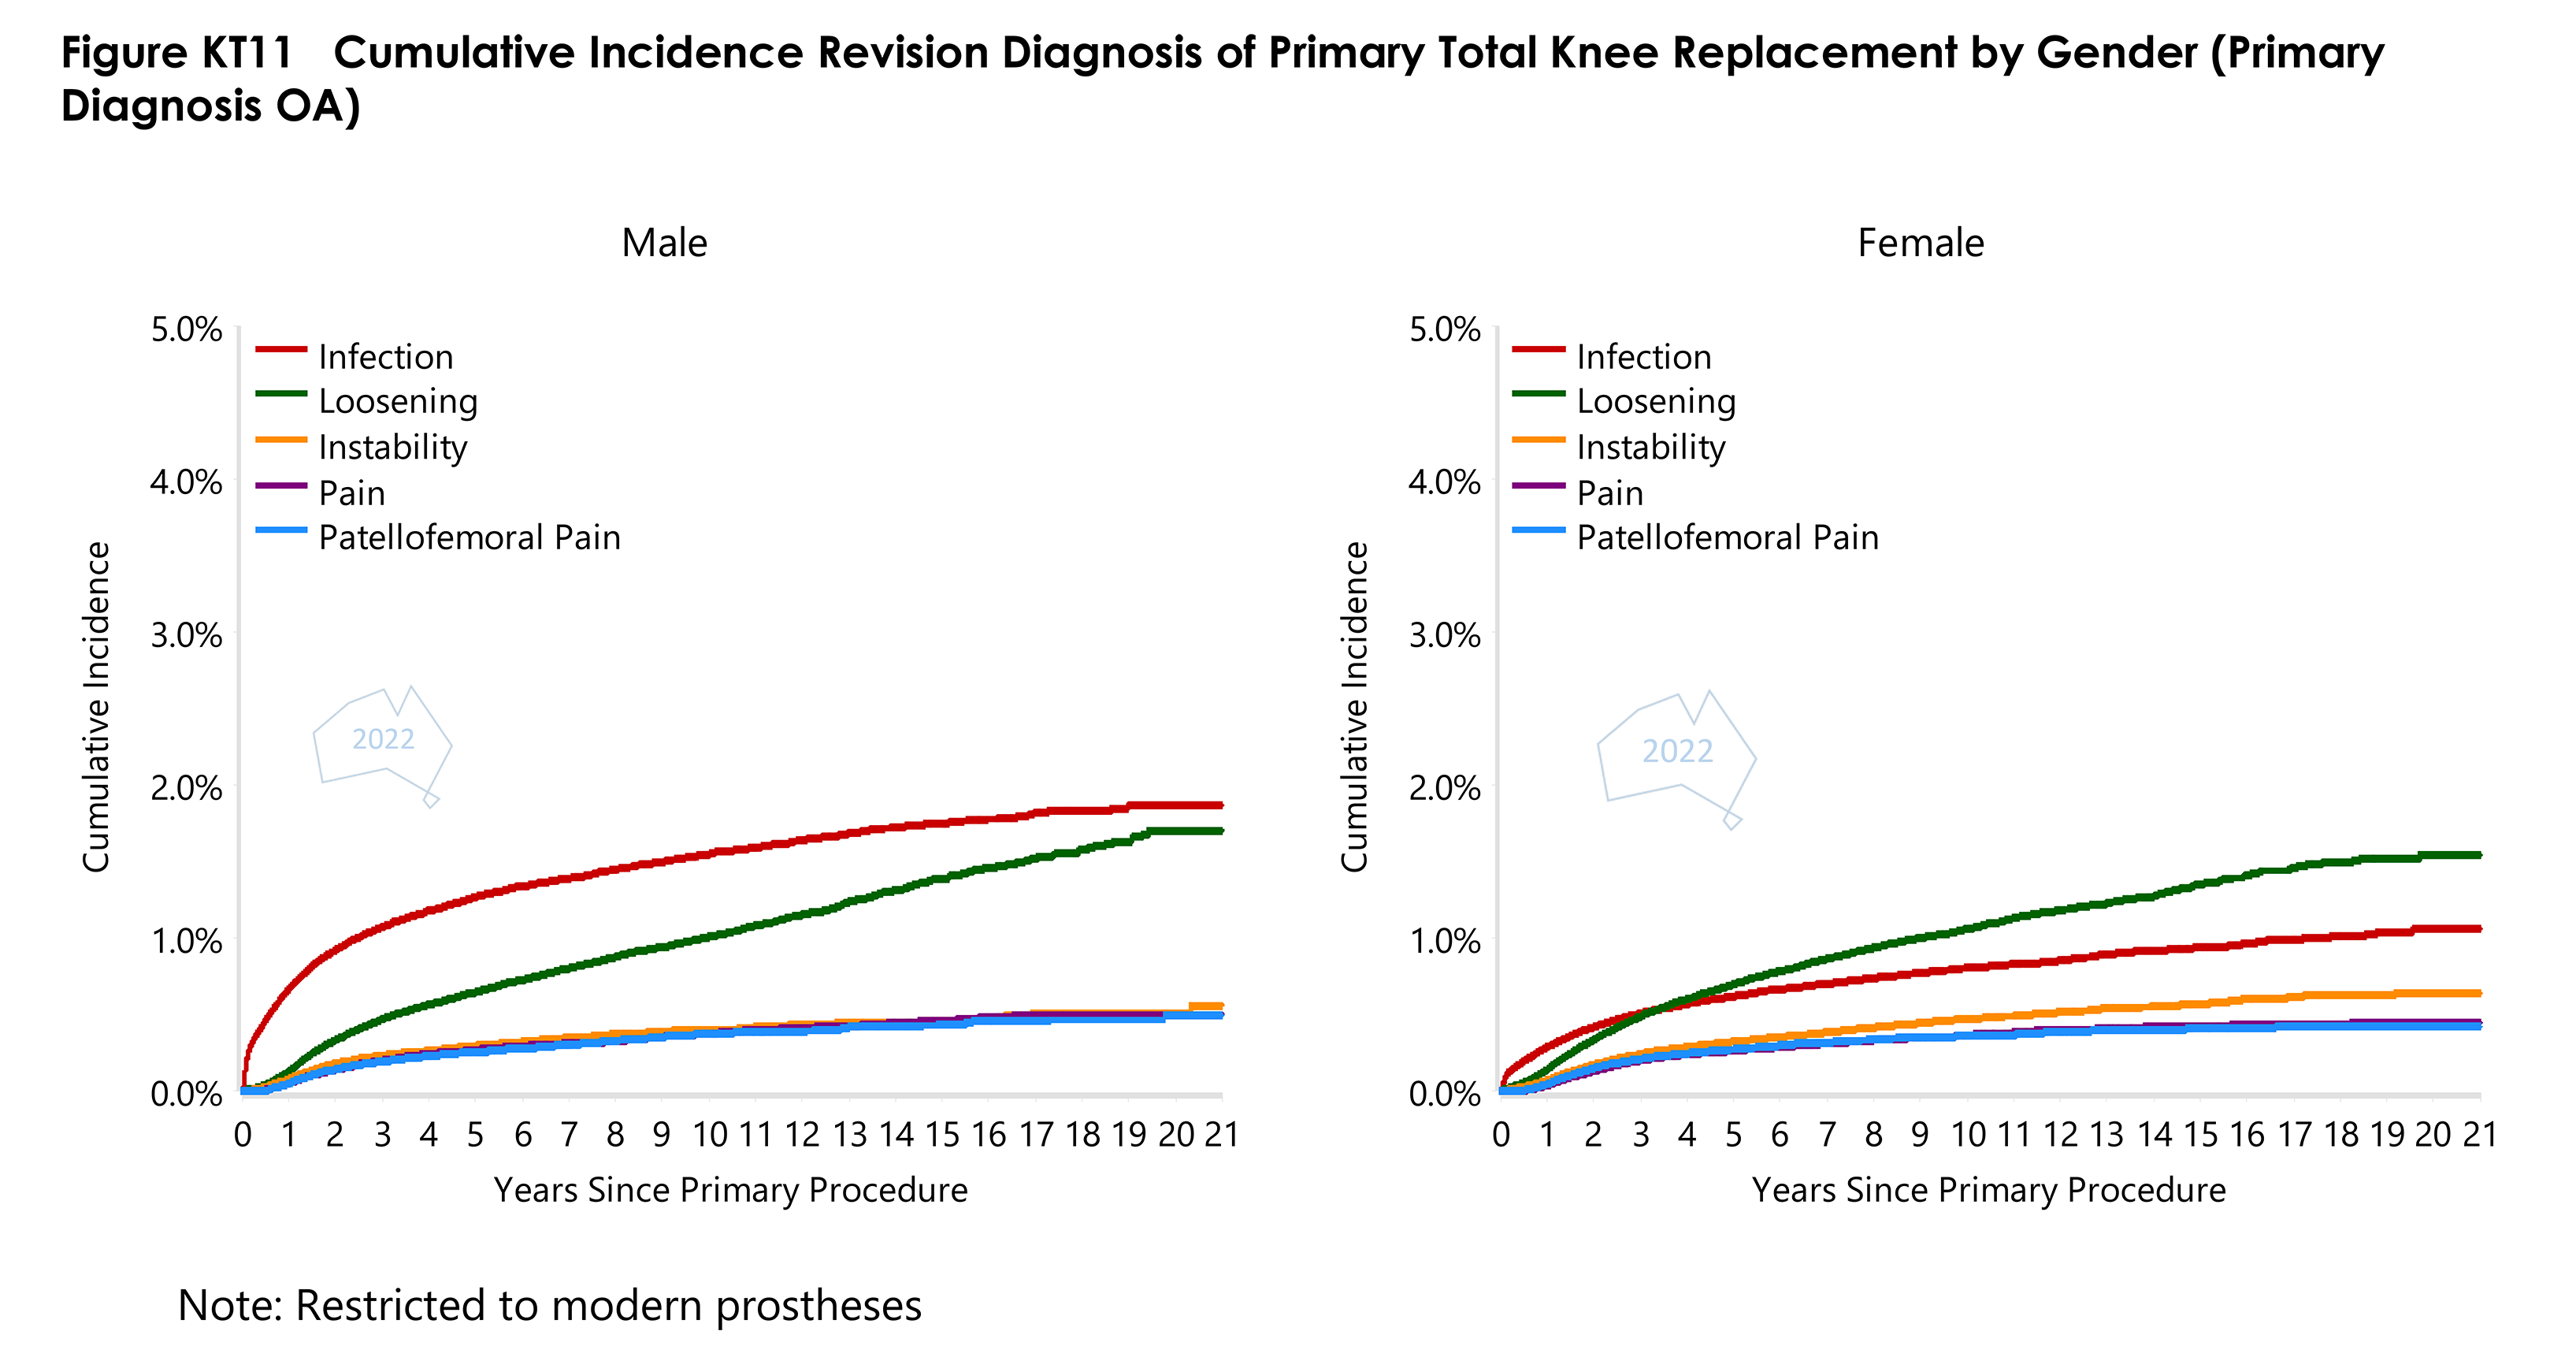
- Figure KT11 Cumulative Incidence Revision Diagnosis of Primary Total Knee Replacement by GenderPDF · 310 KB
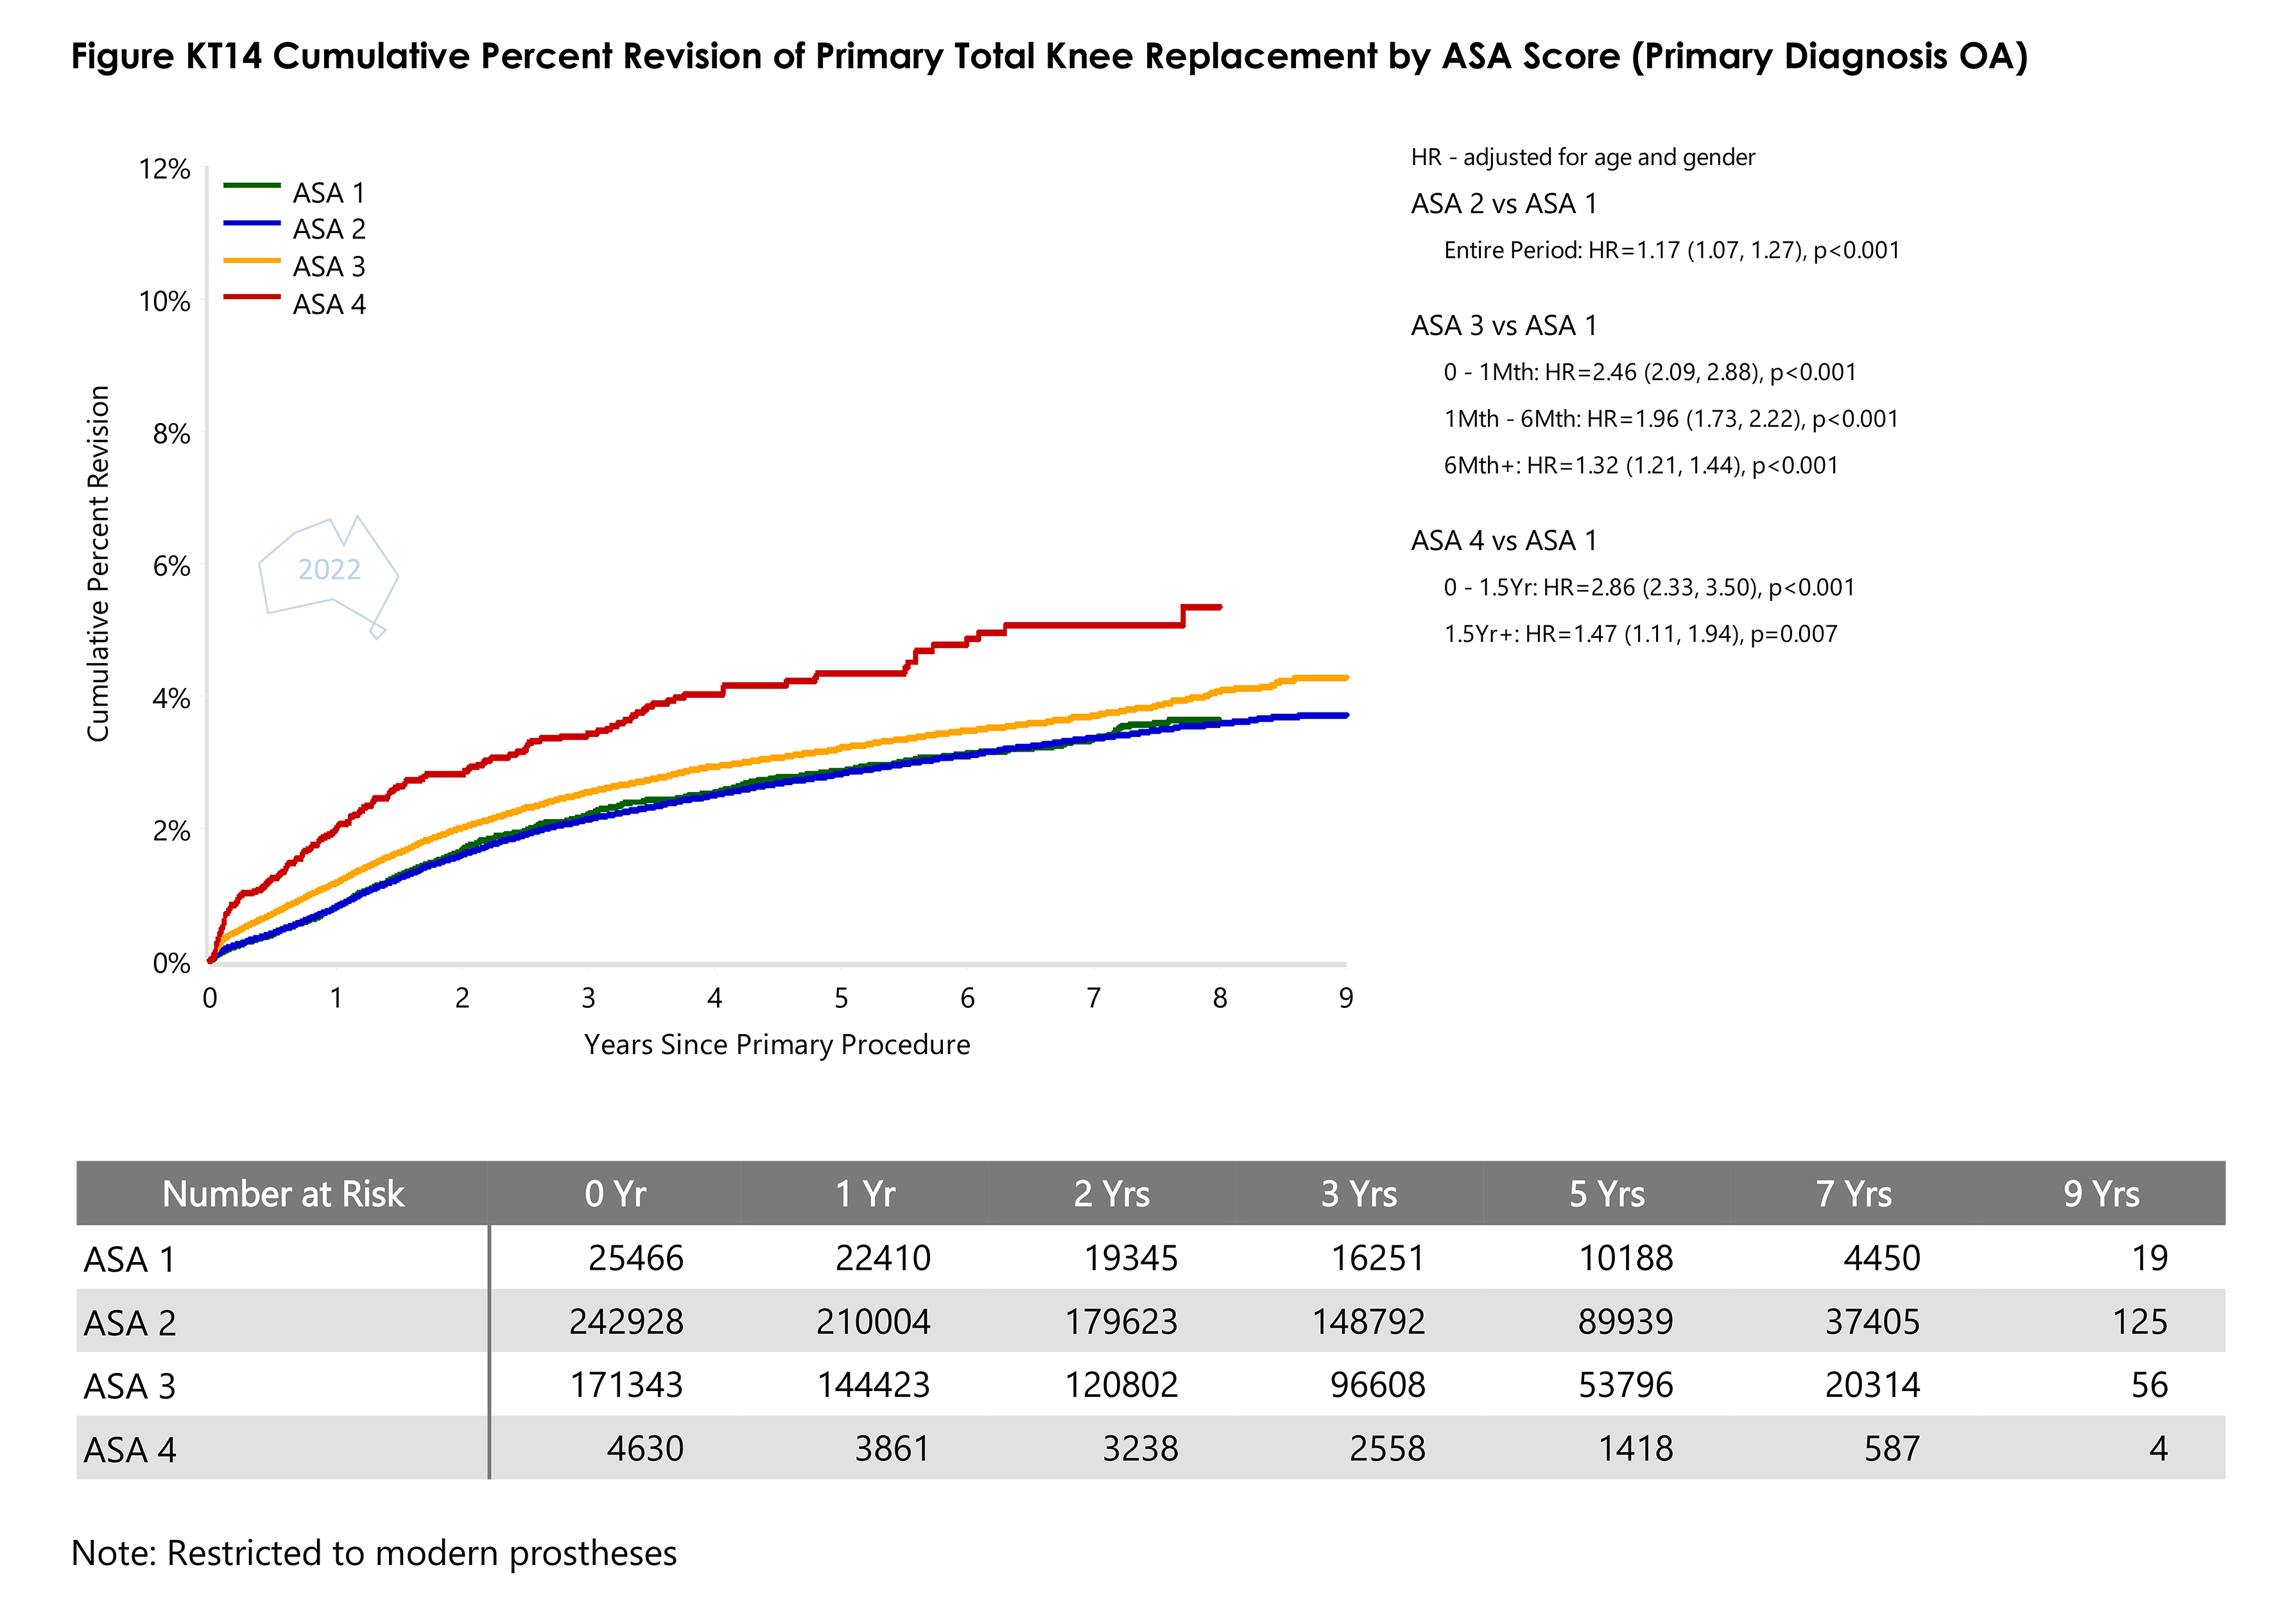
- Figure KT14 Cumulative Percent Revision of Primary Total Knee Replacement by ASA ScorePDF · 184 KB
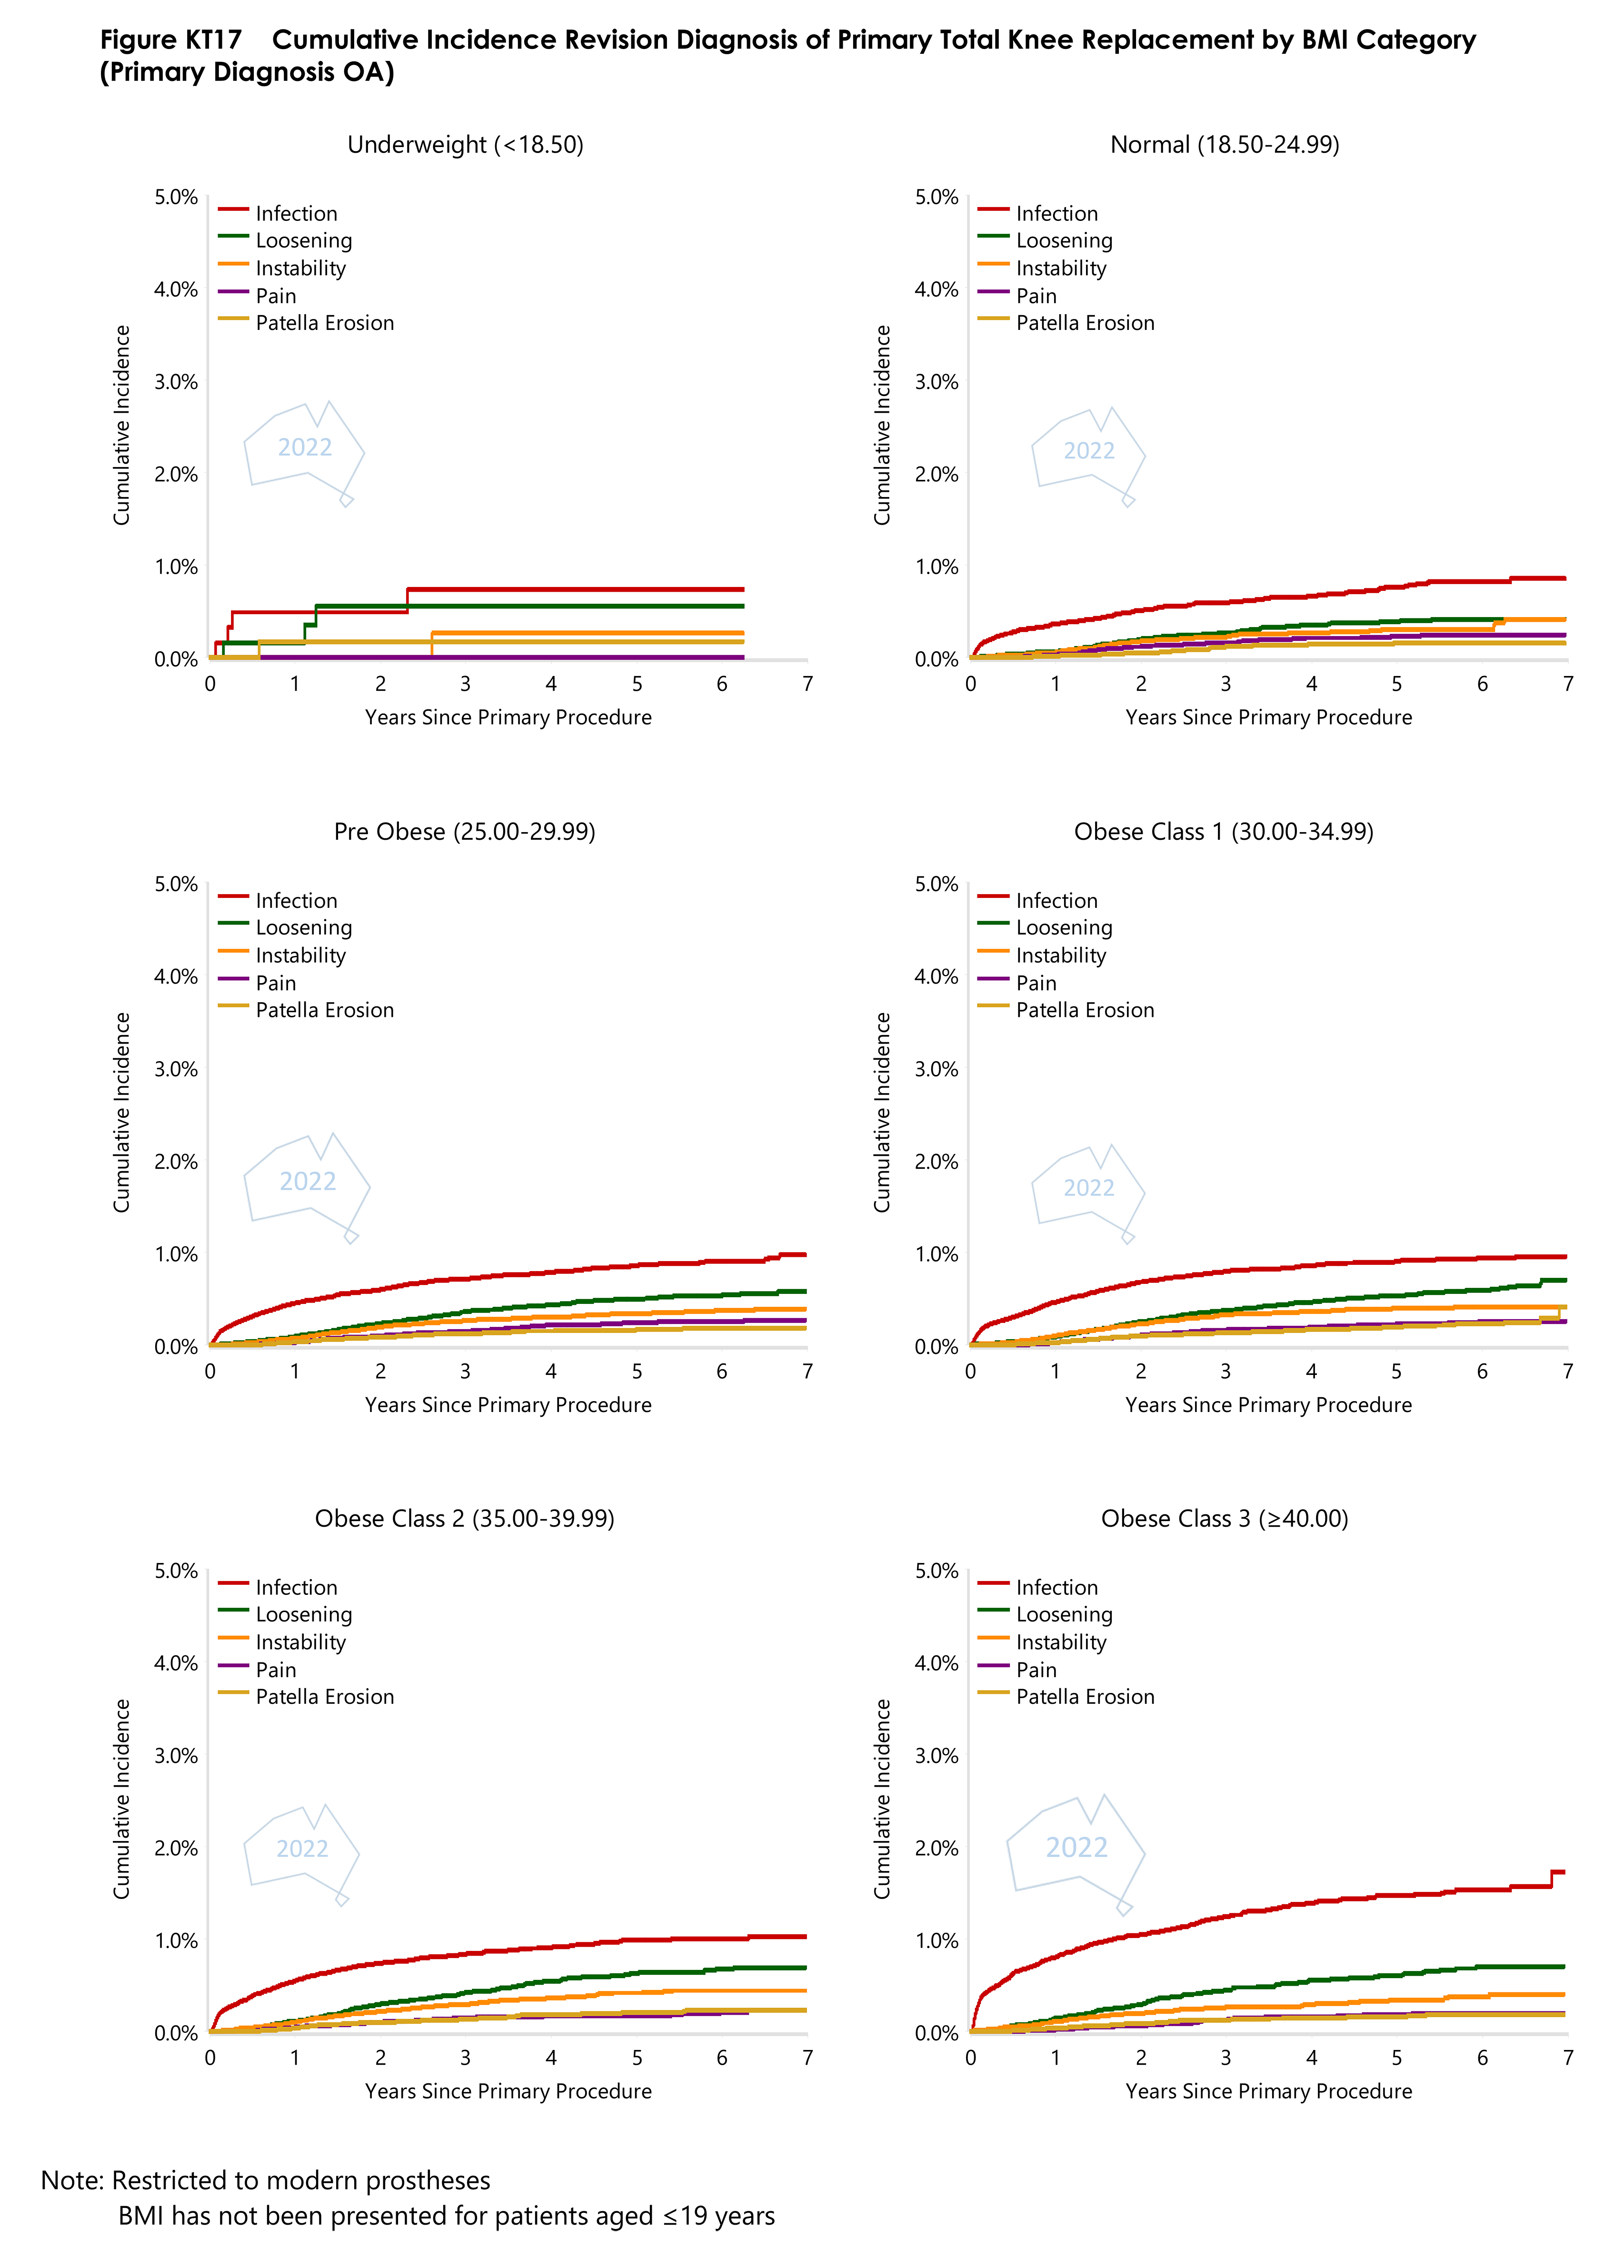
- Figure KT17 Cumulative Incidence Revision Diagnosis of Primary Total Knee Replacement by BMI CategoryPDF · 240 KB
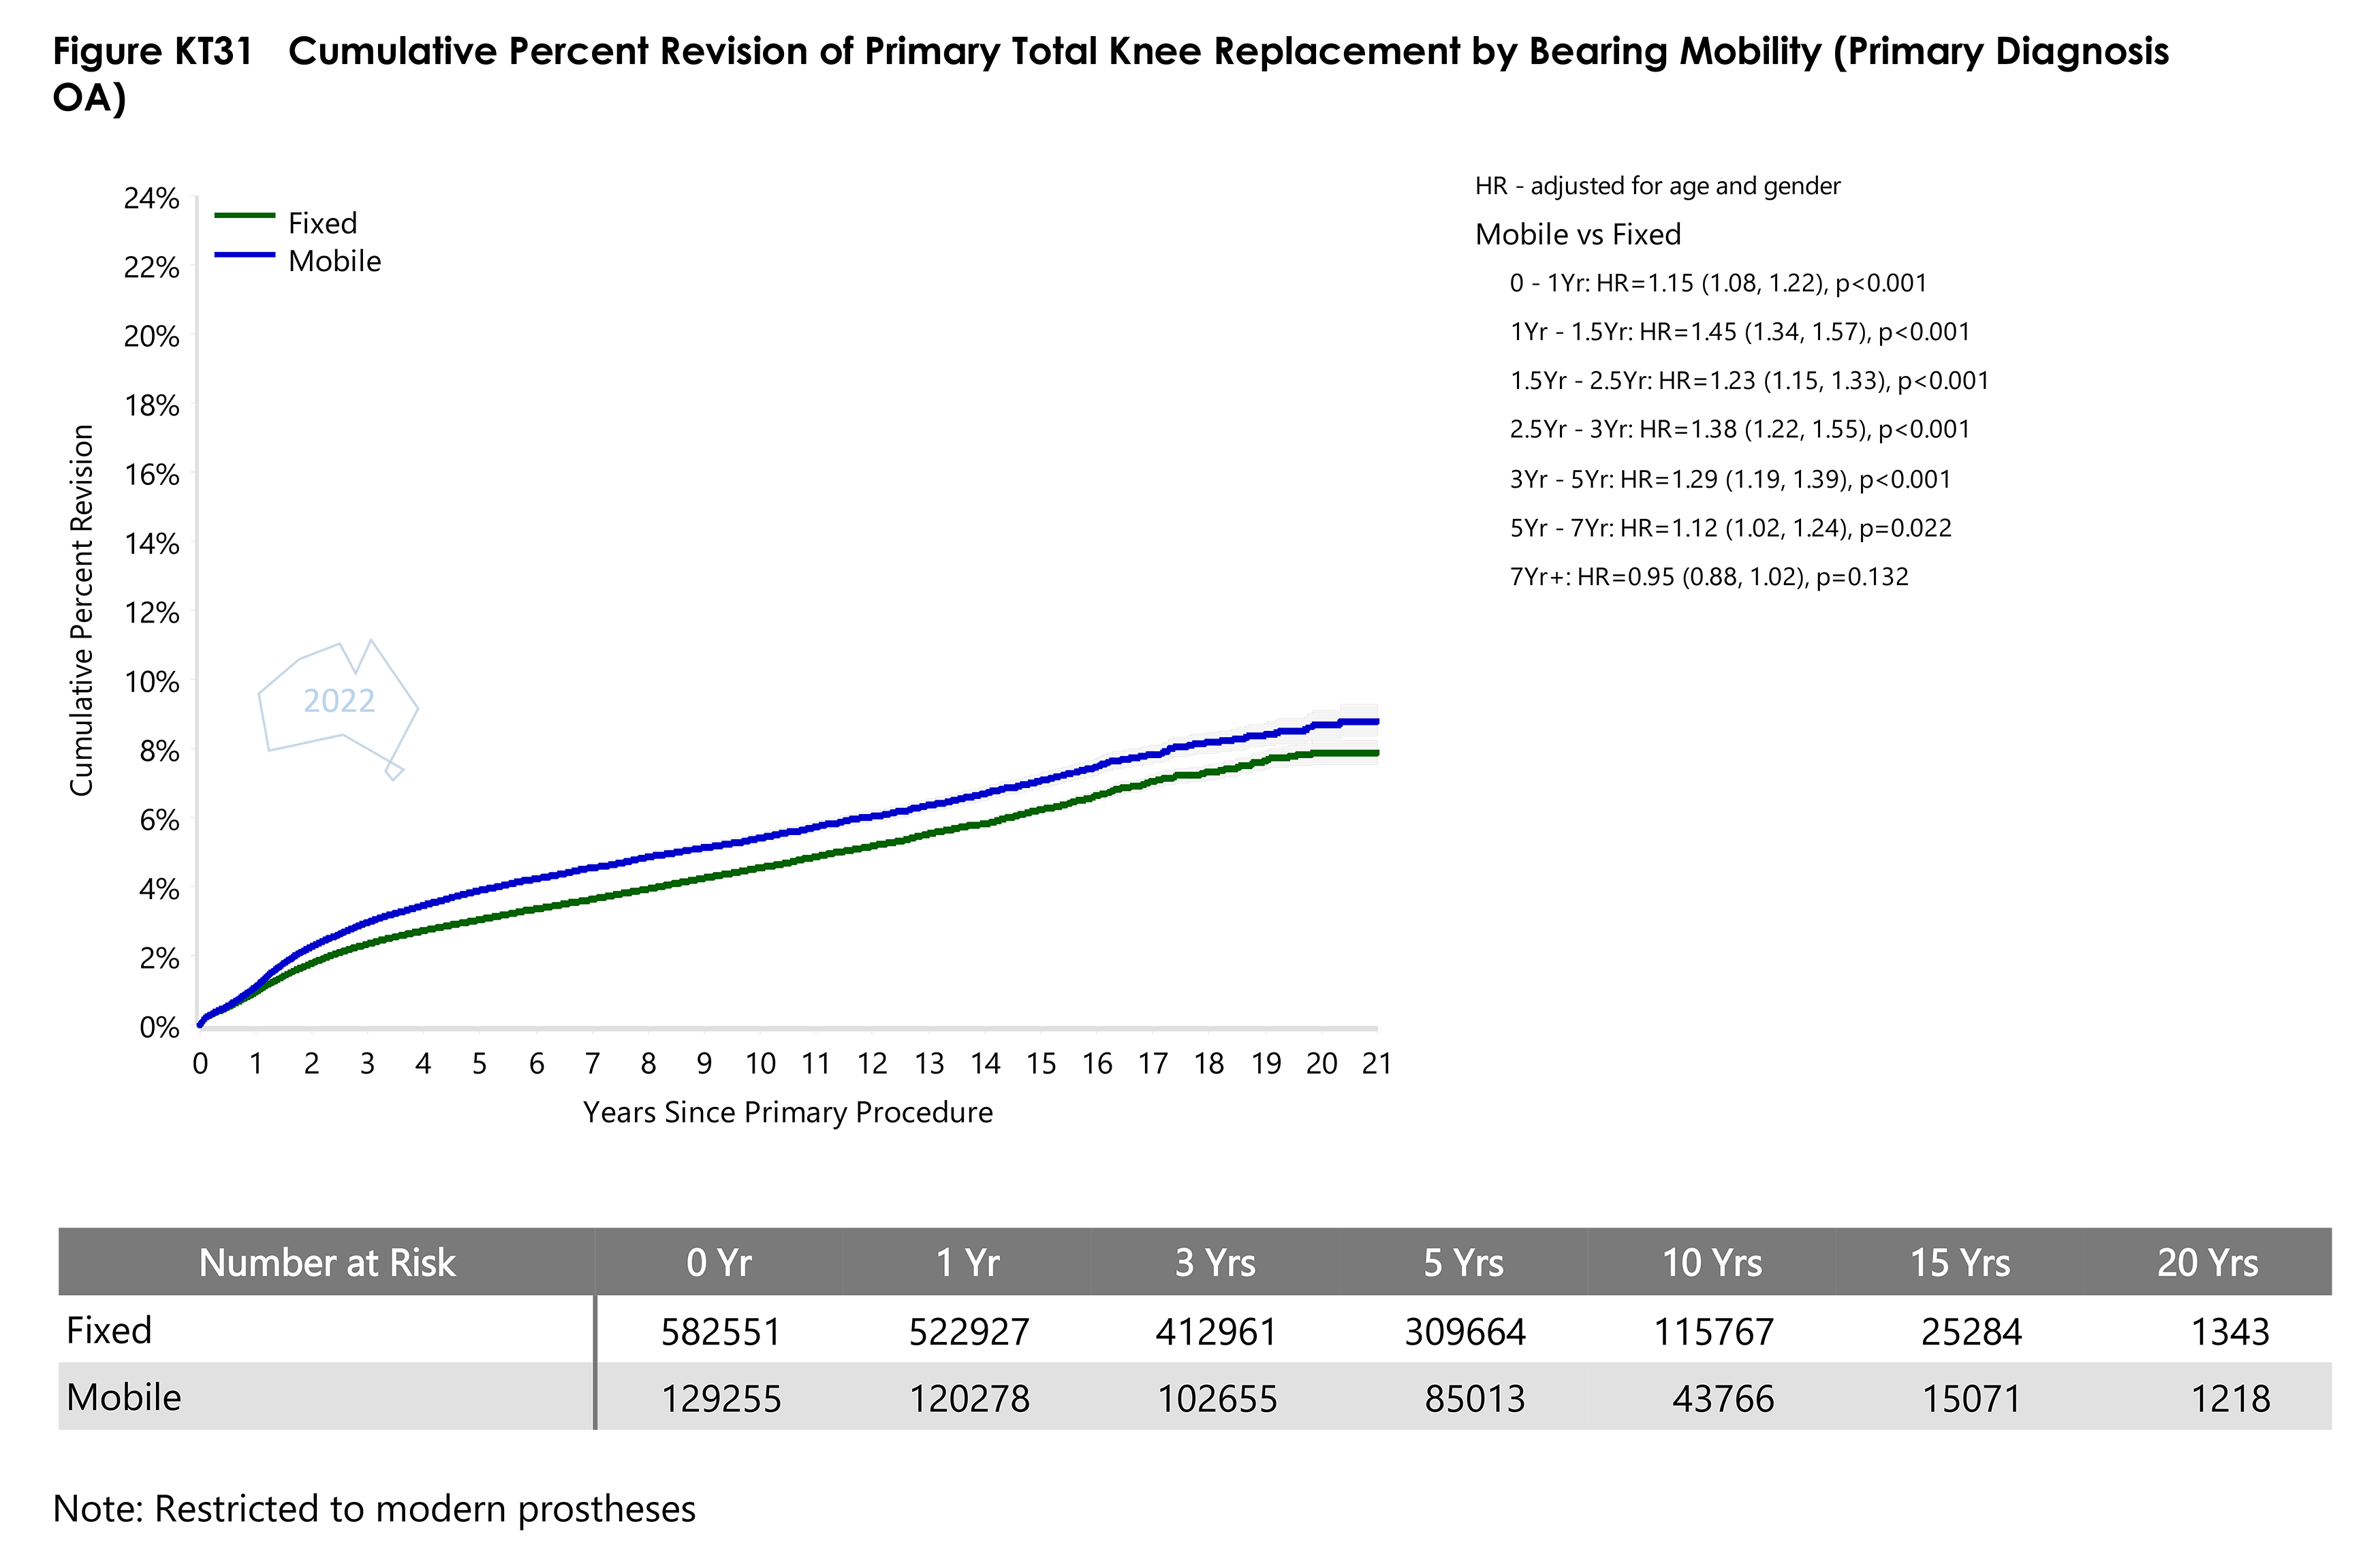
- Figure KT31 Cumulative Percent Revision of Primary Total Knee Replacement by Bearing MobilityPDF · 217 KB
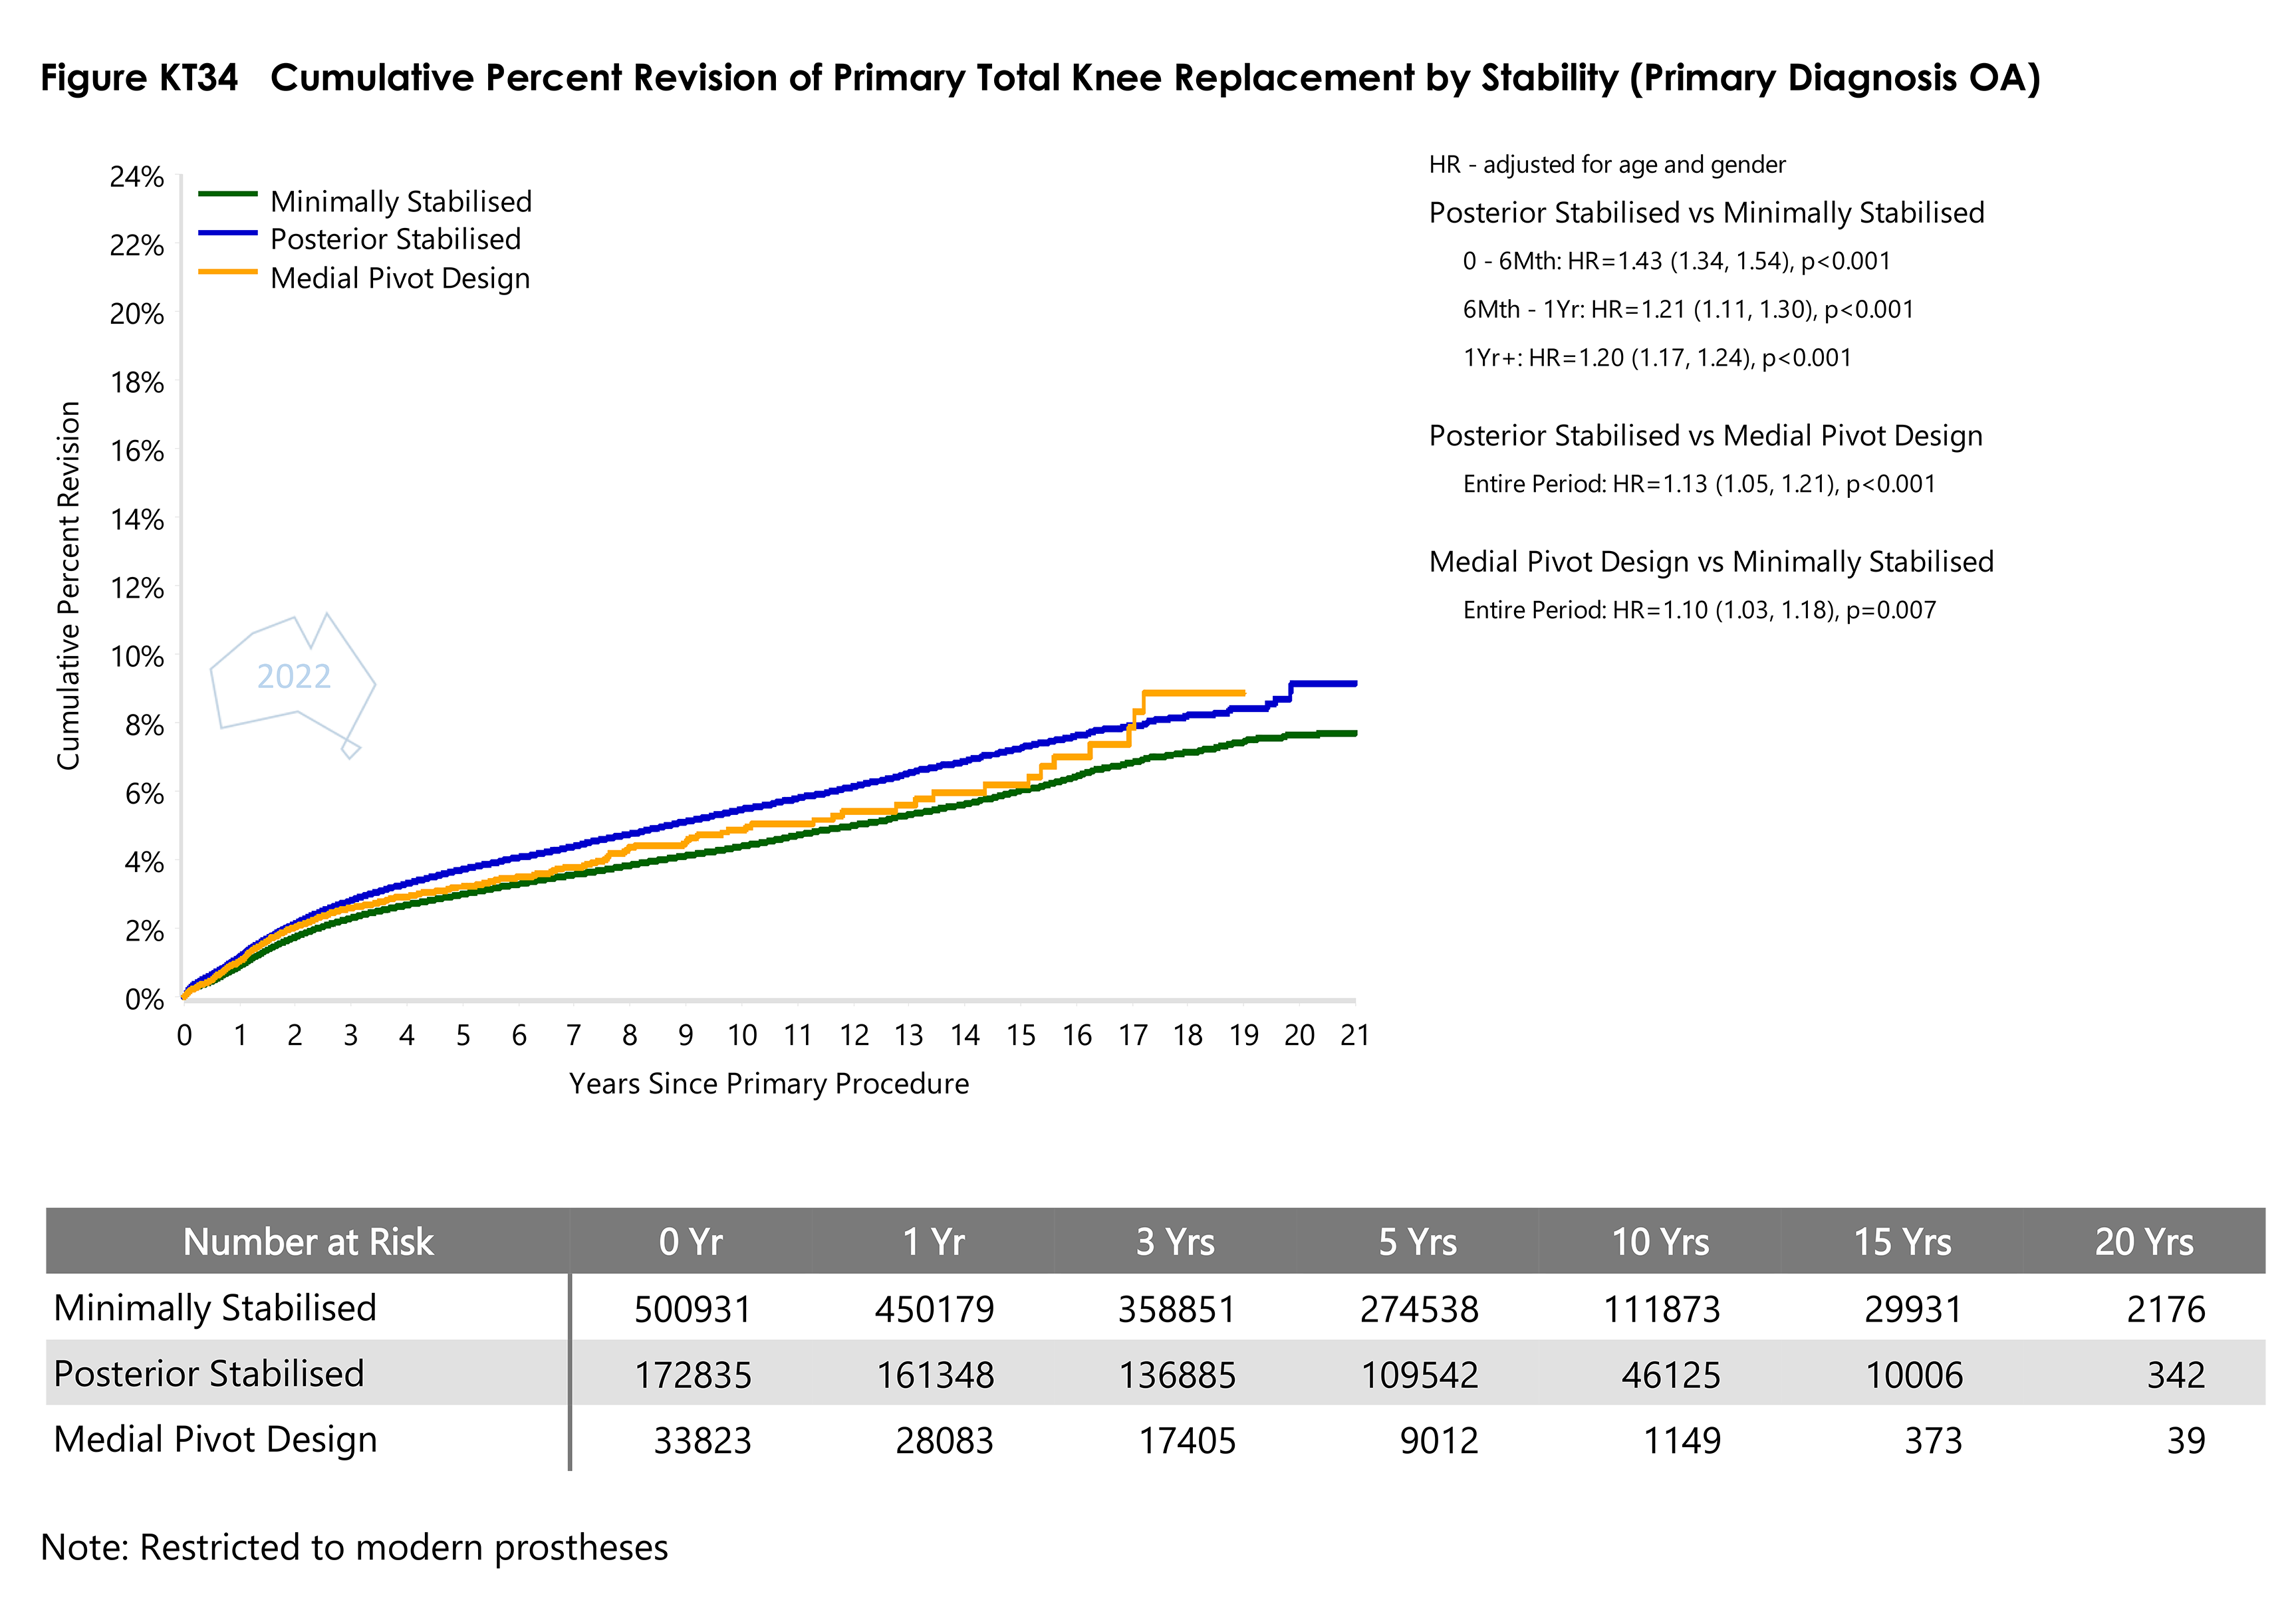
- Figure KT34 Cumulative Percent Revision of Primary Total Knee Replacement by StabilityPDF · 222 KB
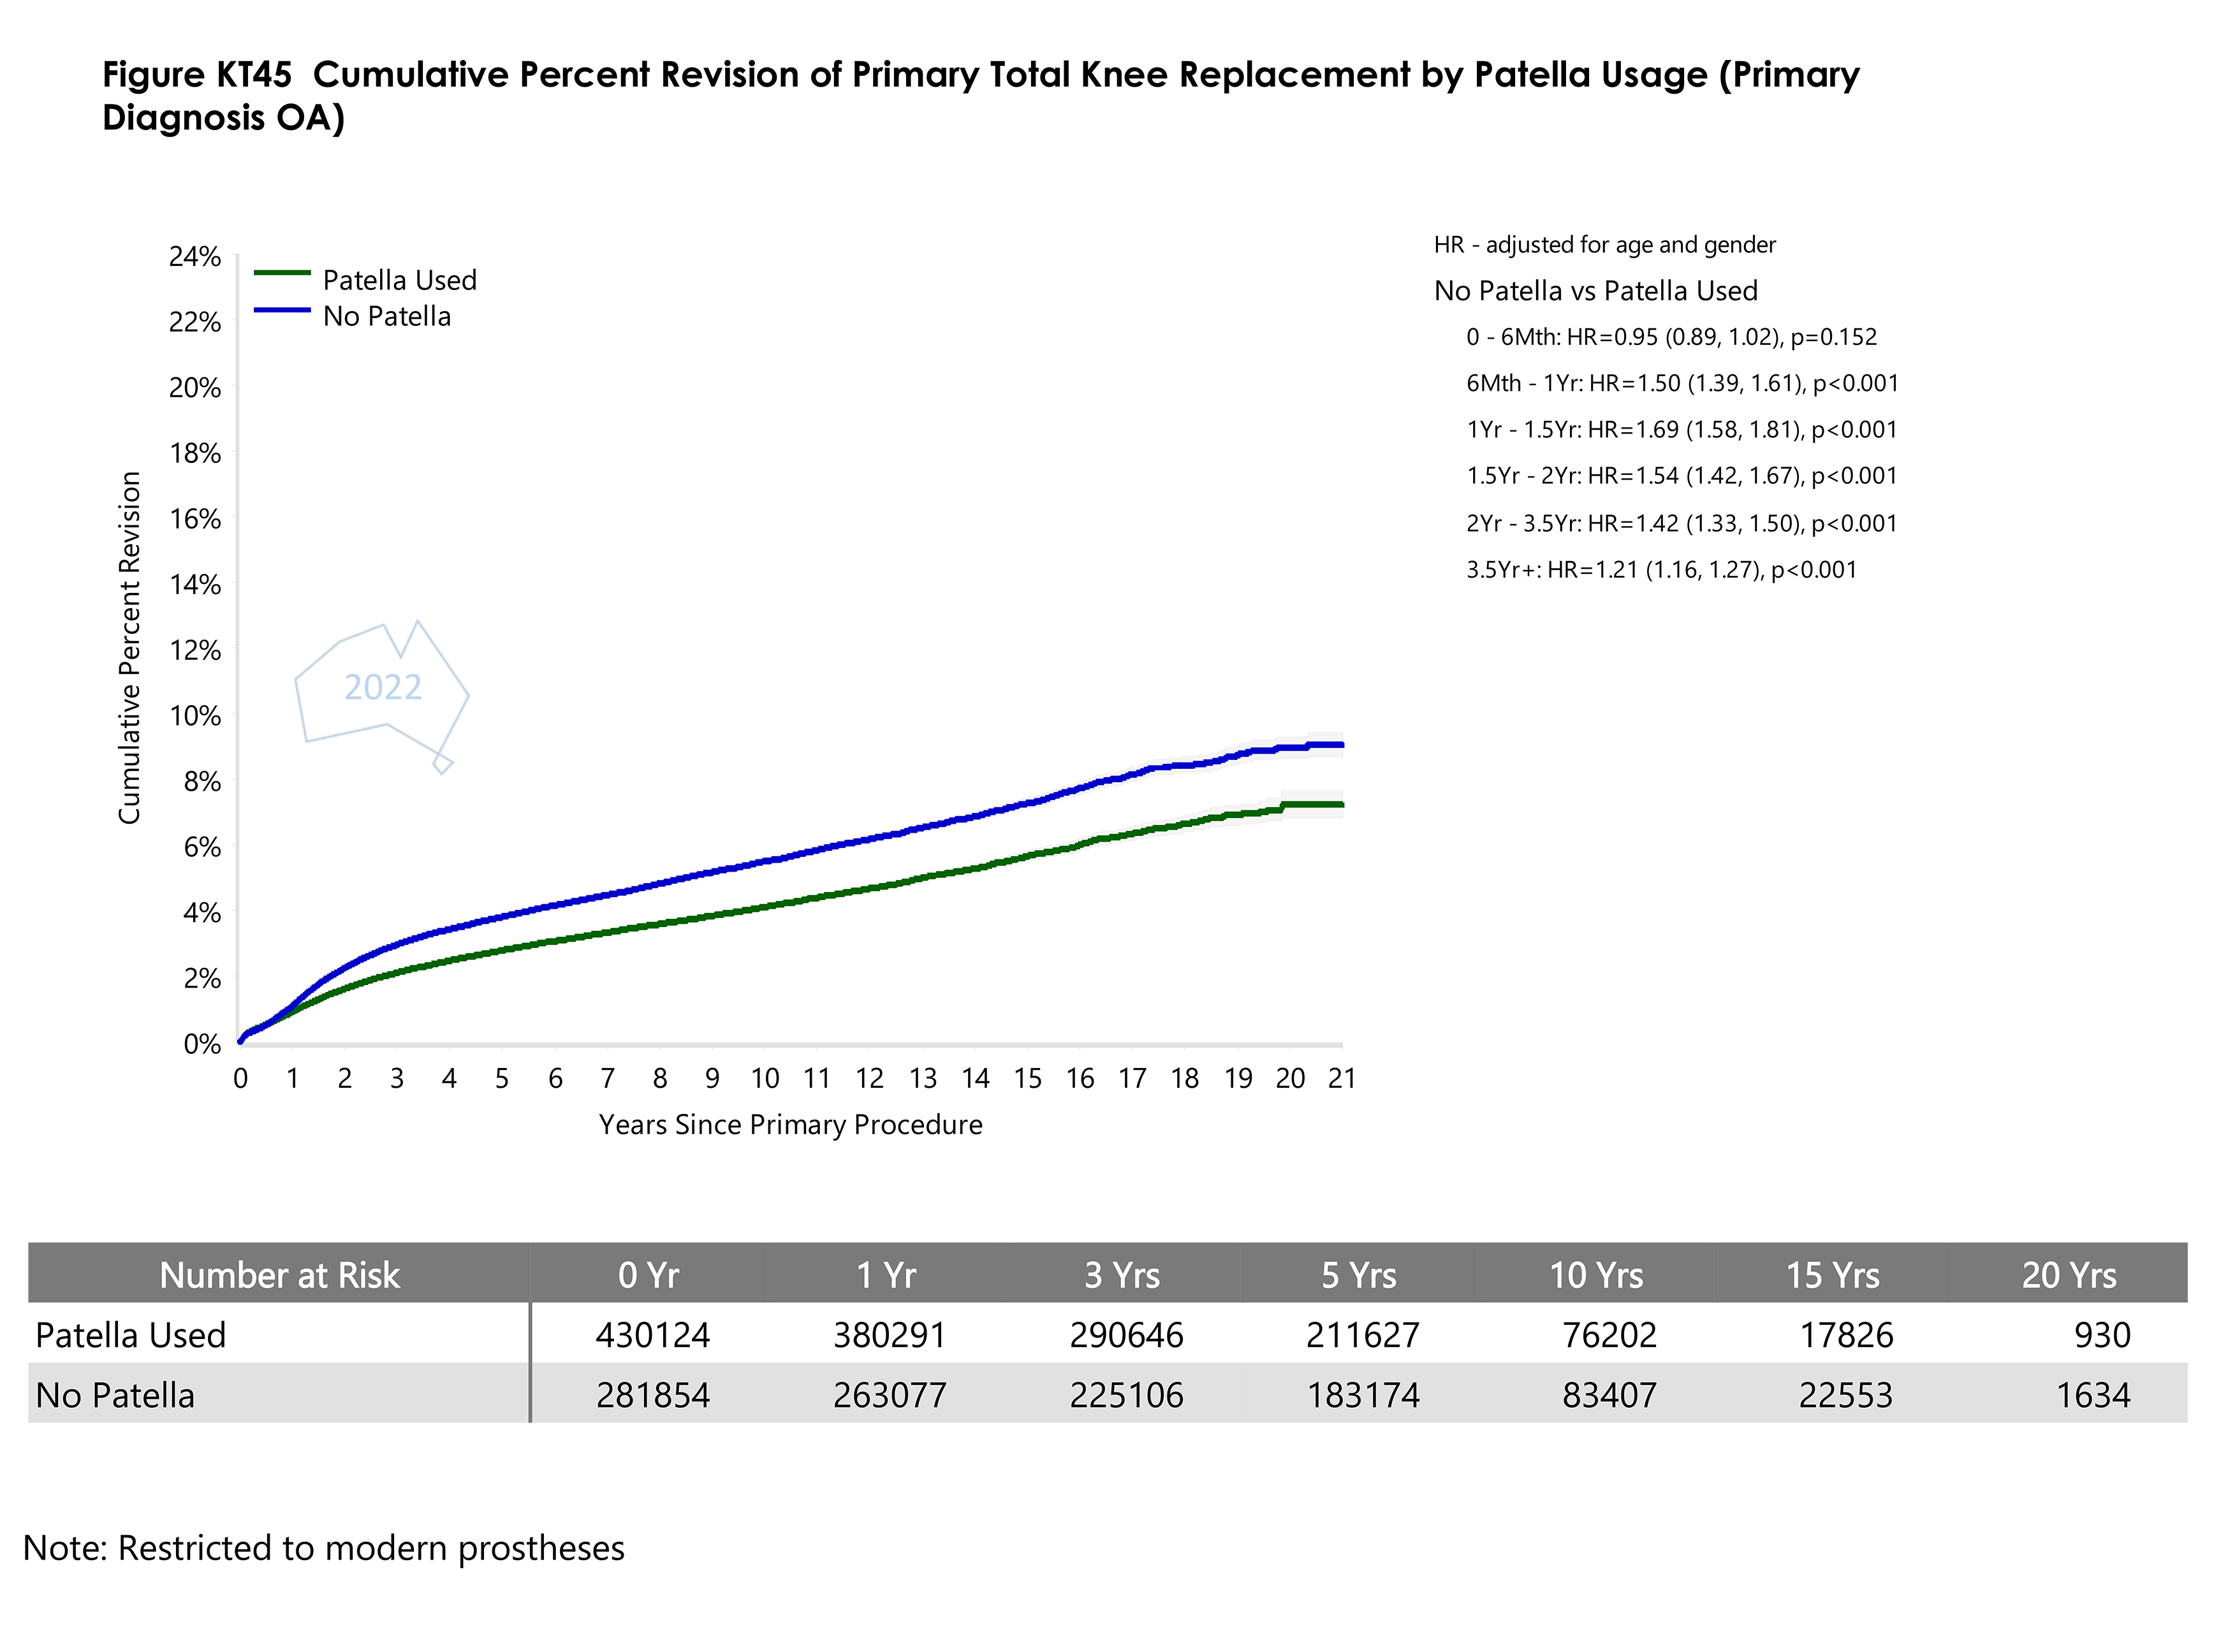
- Figure KT45 Cumulative Percent Revision of Primary Total Knee Replacement by Patella UsagePDF · 241 KB
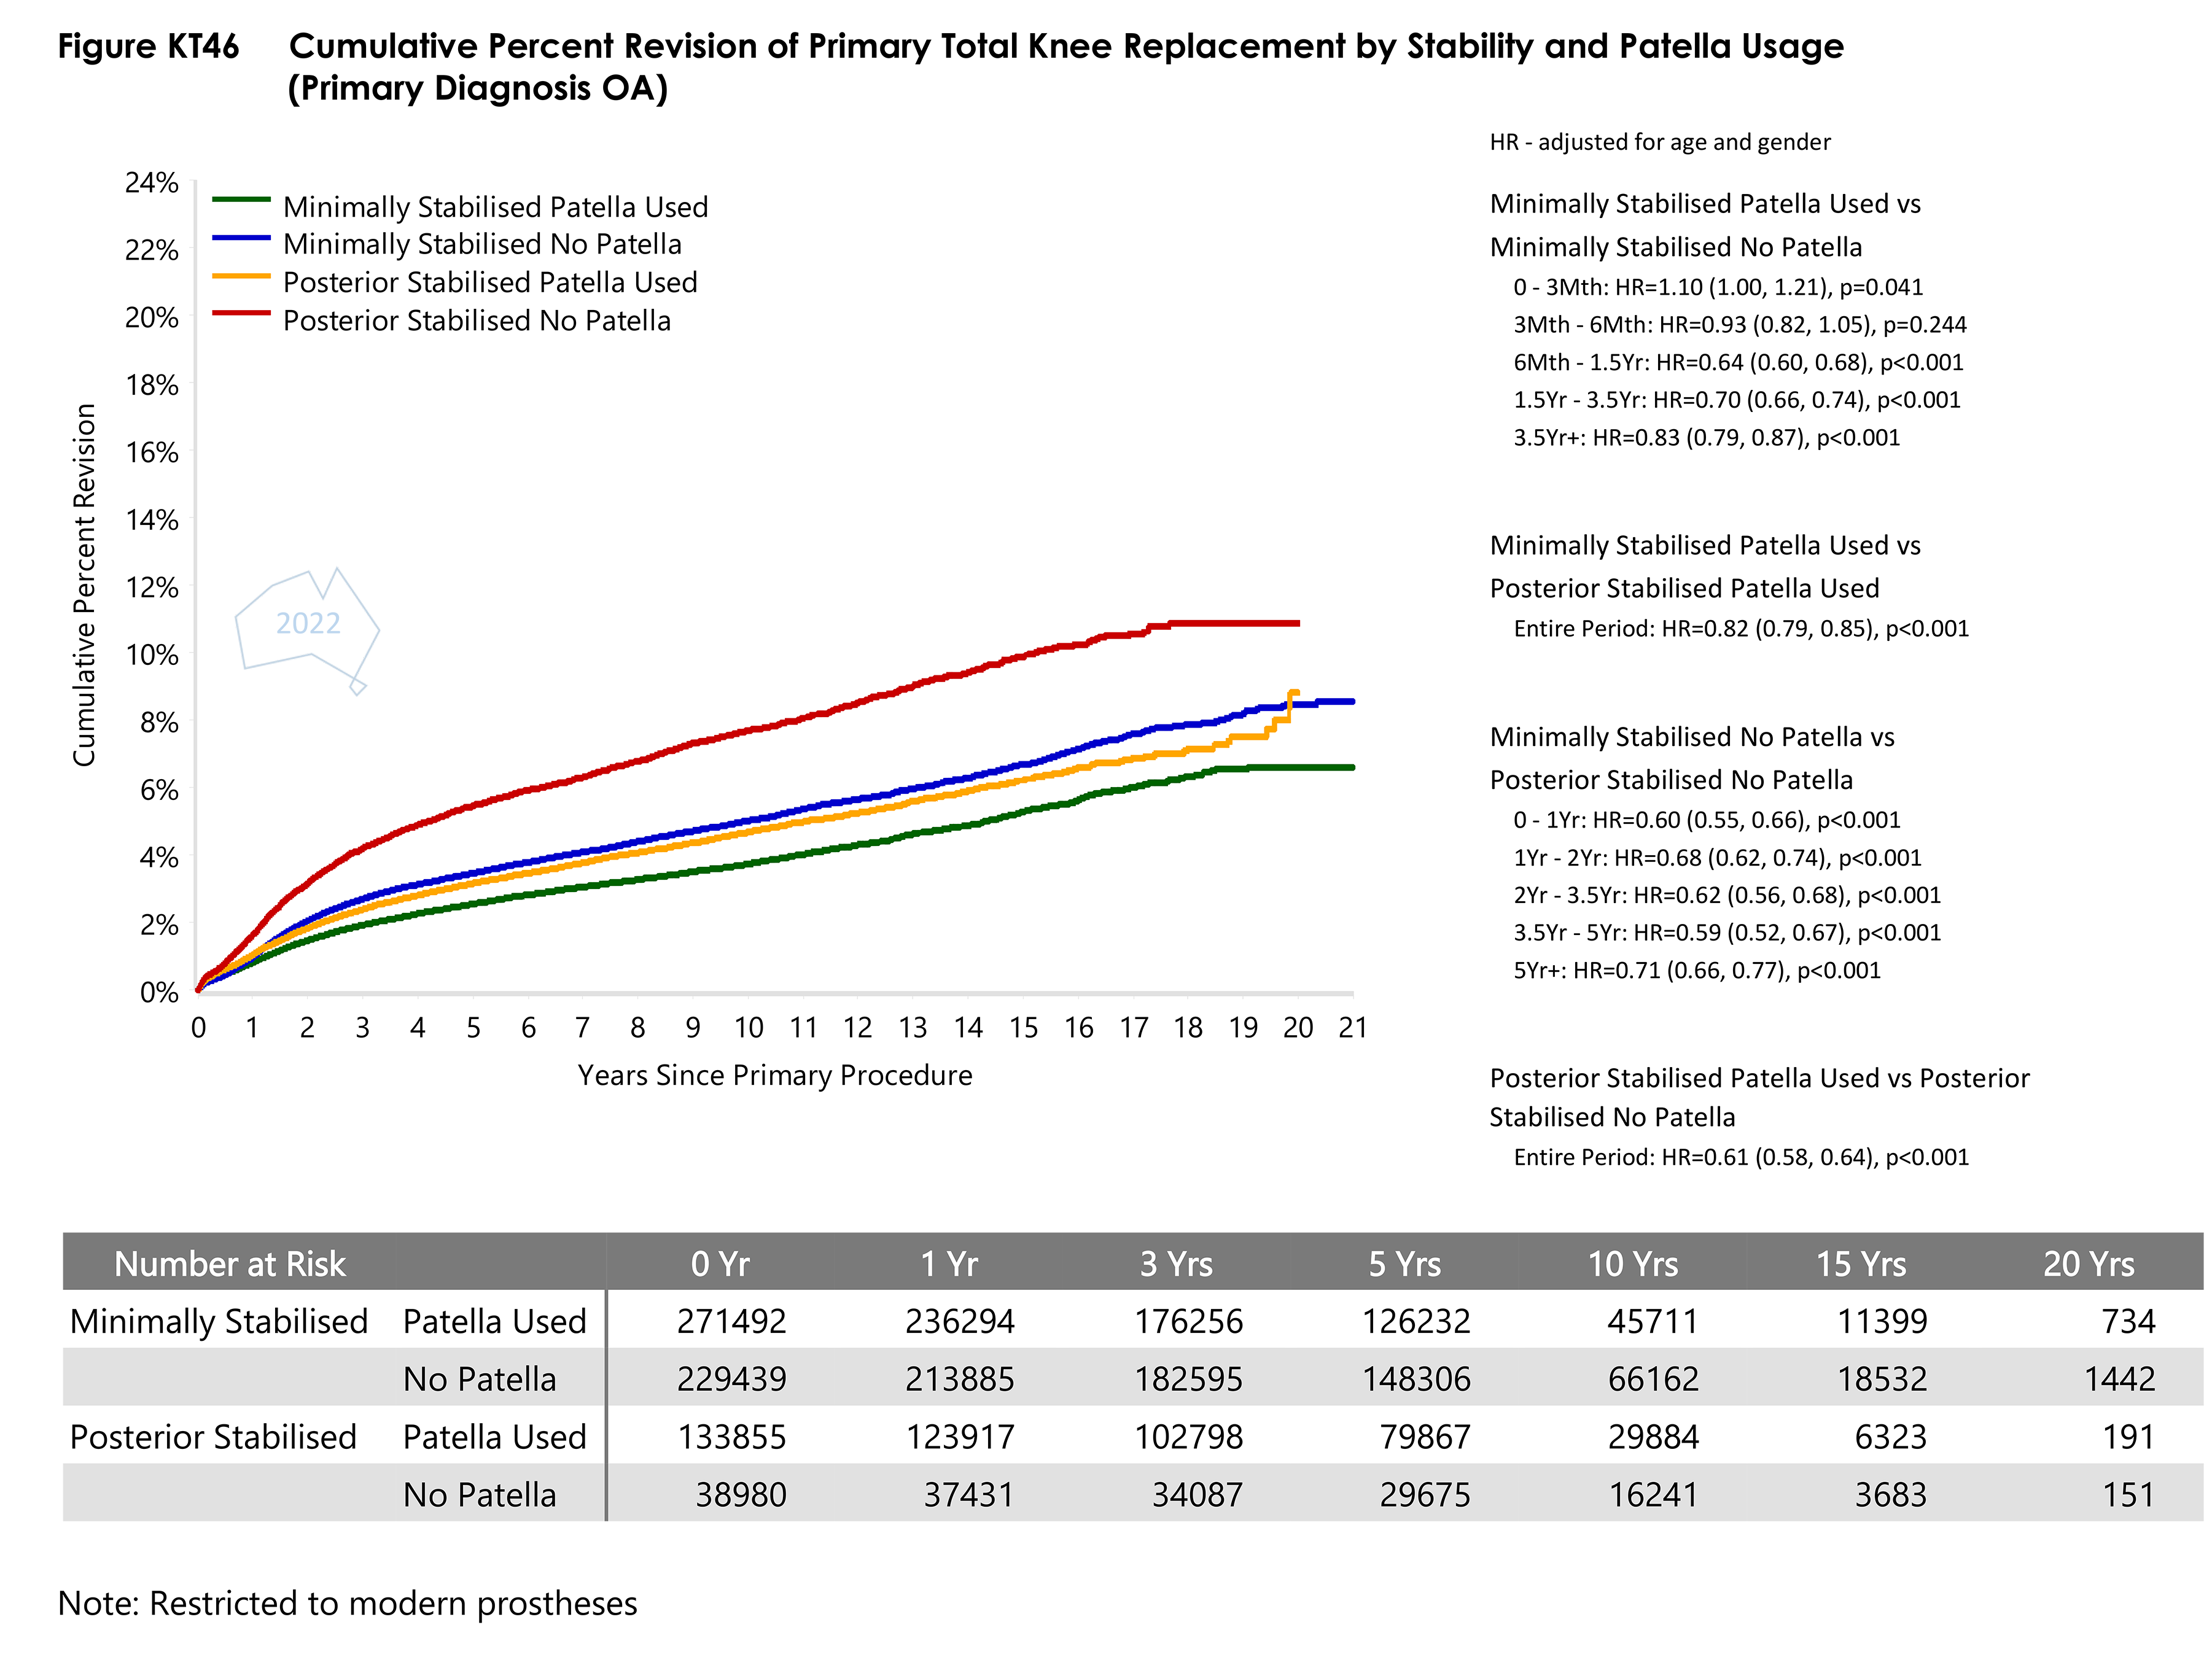
- Figure KT46 Cumulative Percent Revision of Primary Total Knee Replacement by Stability and Patella UsagePDF · 348 KB
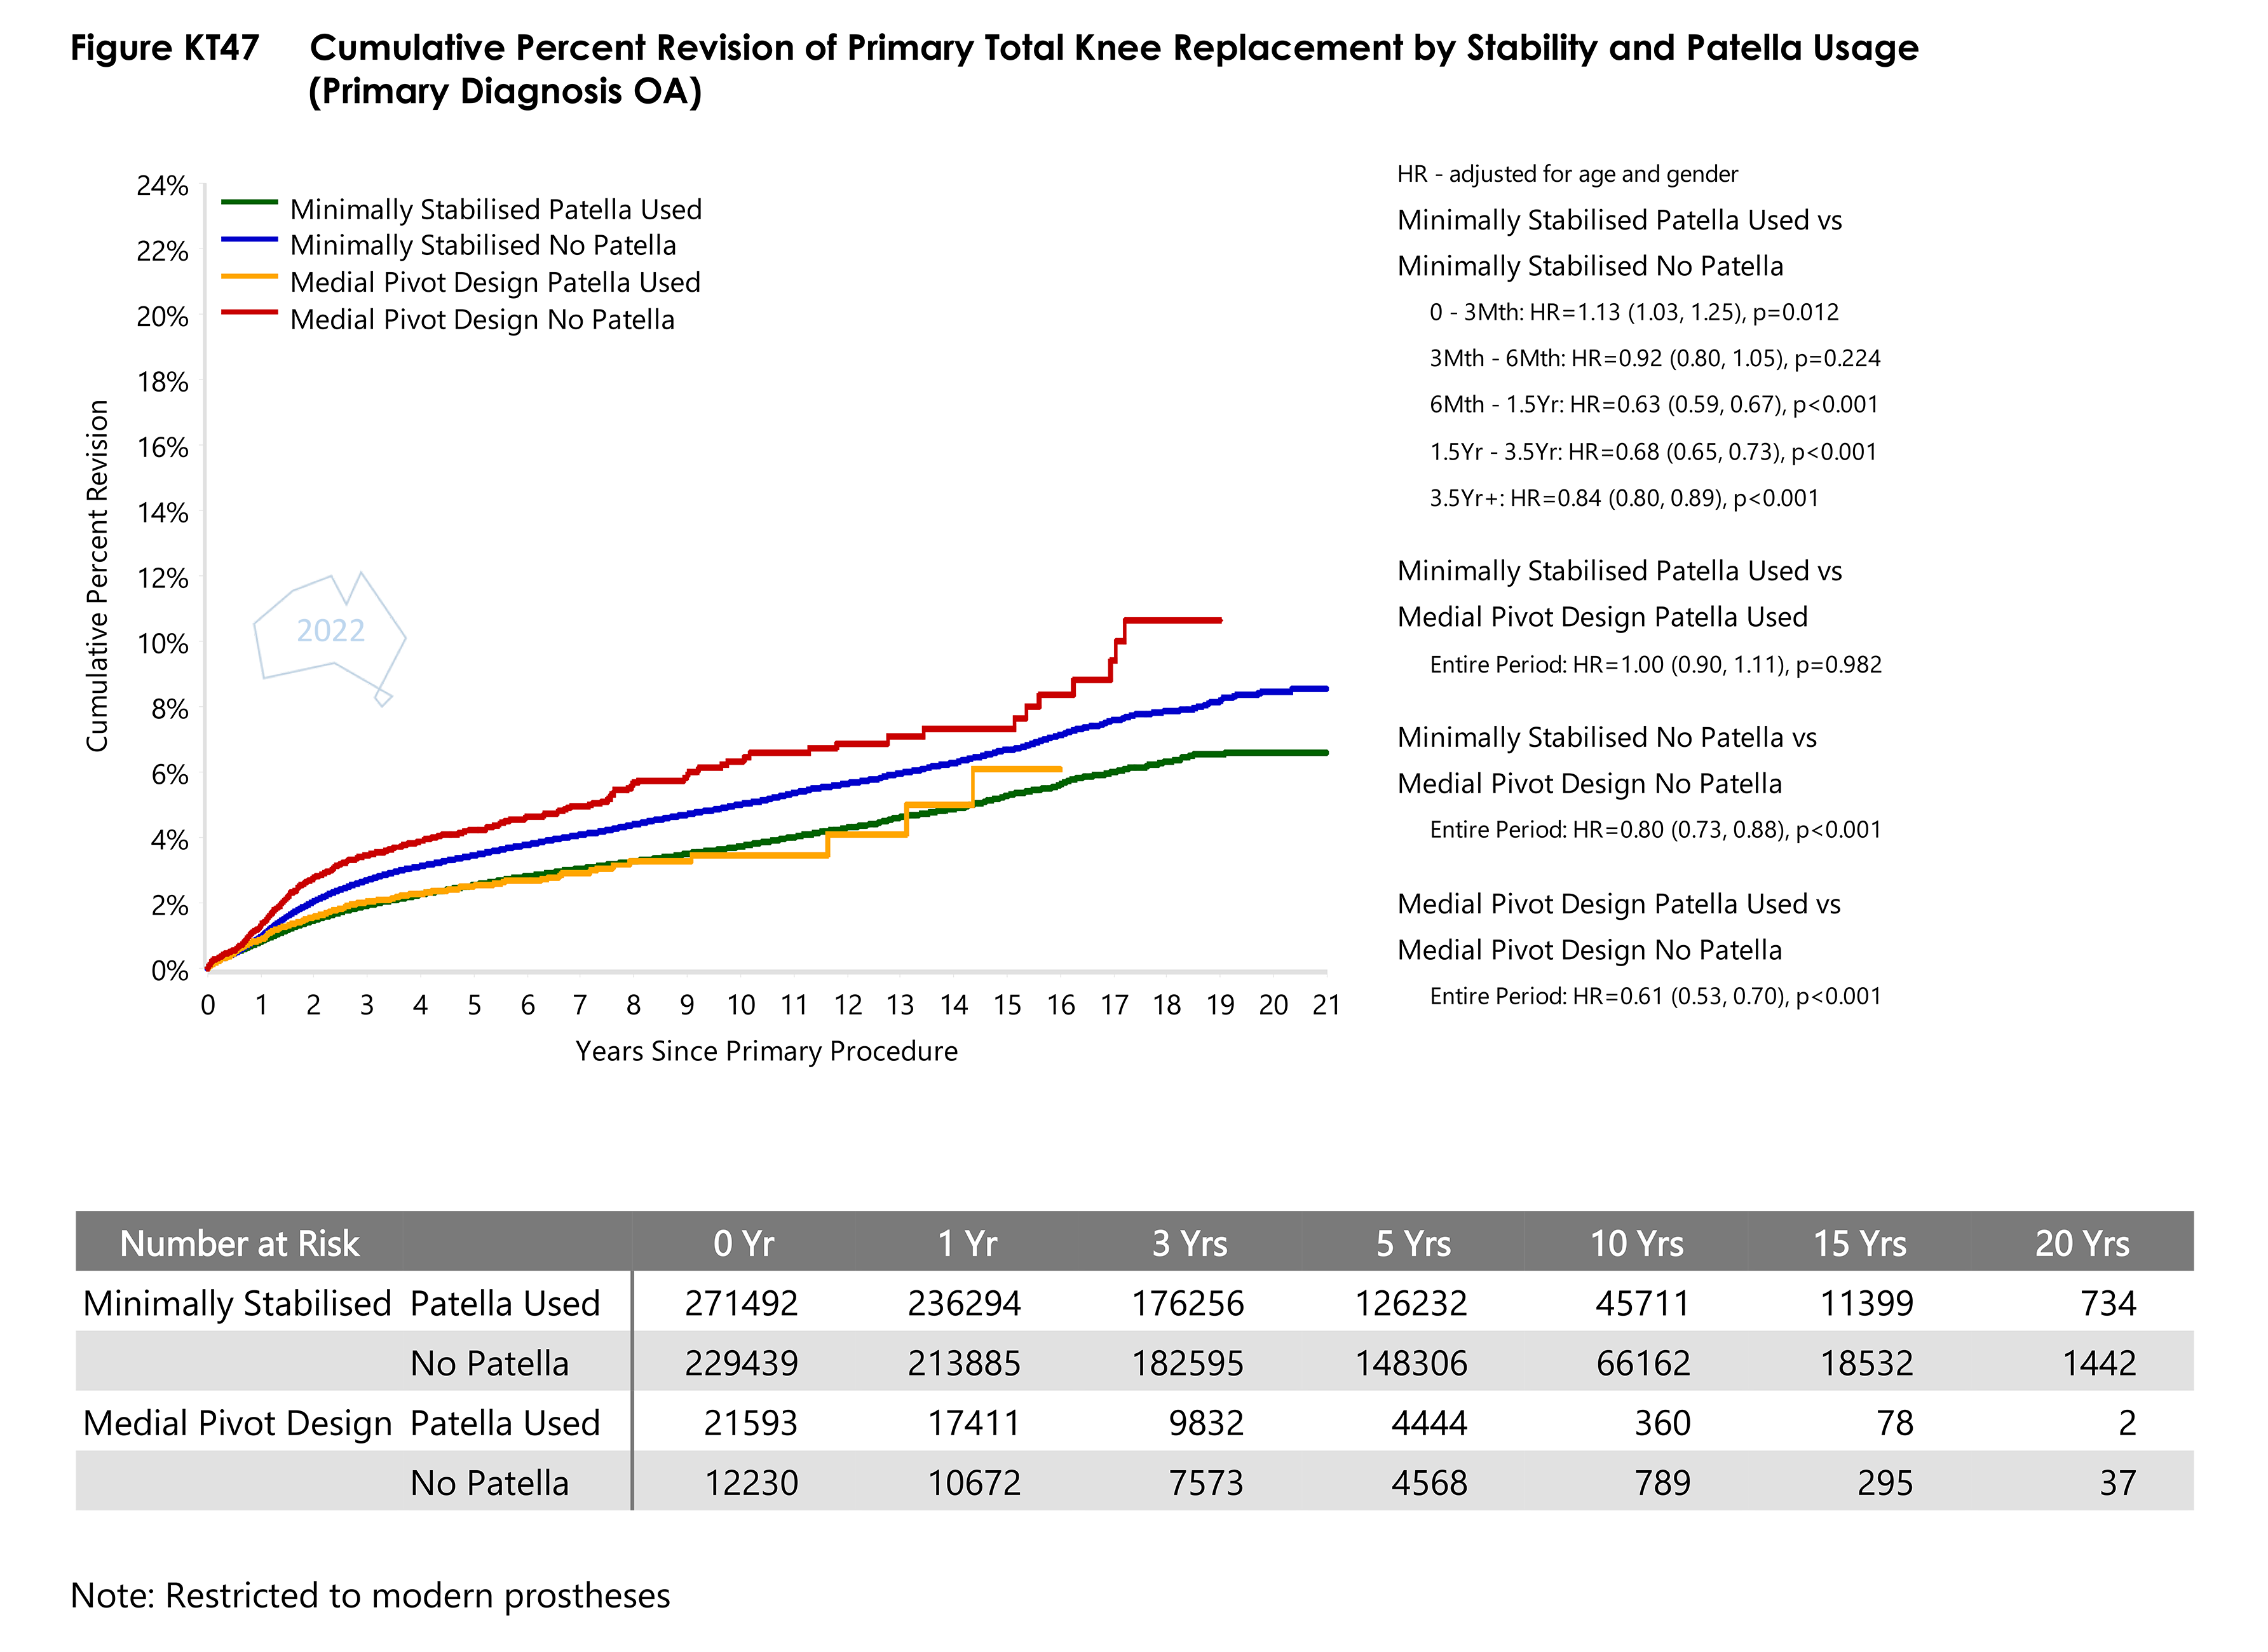
- Figure KT47 Cumulative Percent Revision of Primary Total Knee Replacement by Stability and Patella UsagePDF · 236 KB
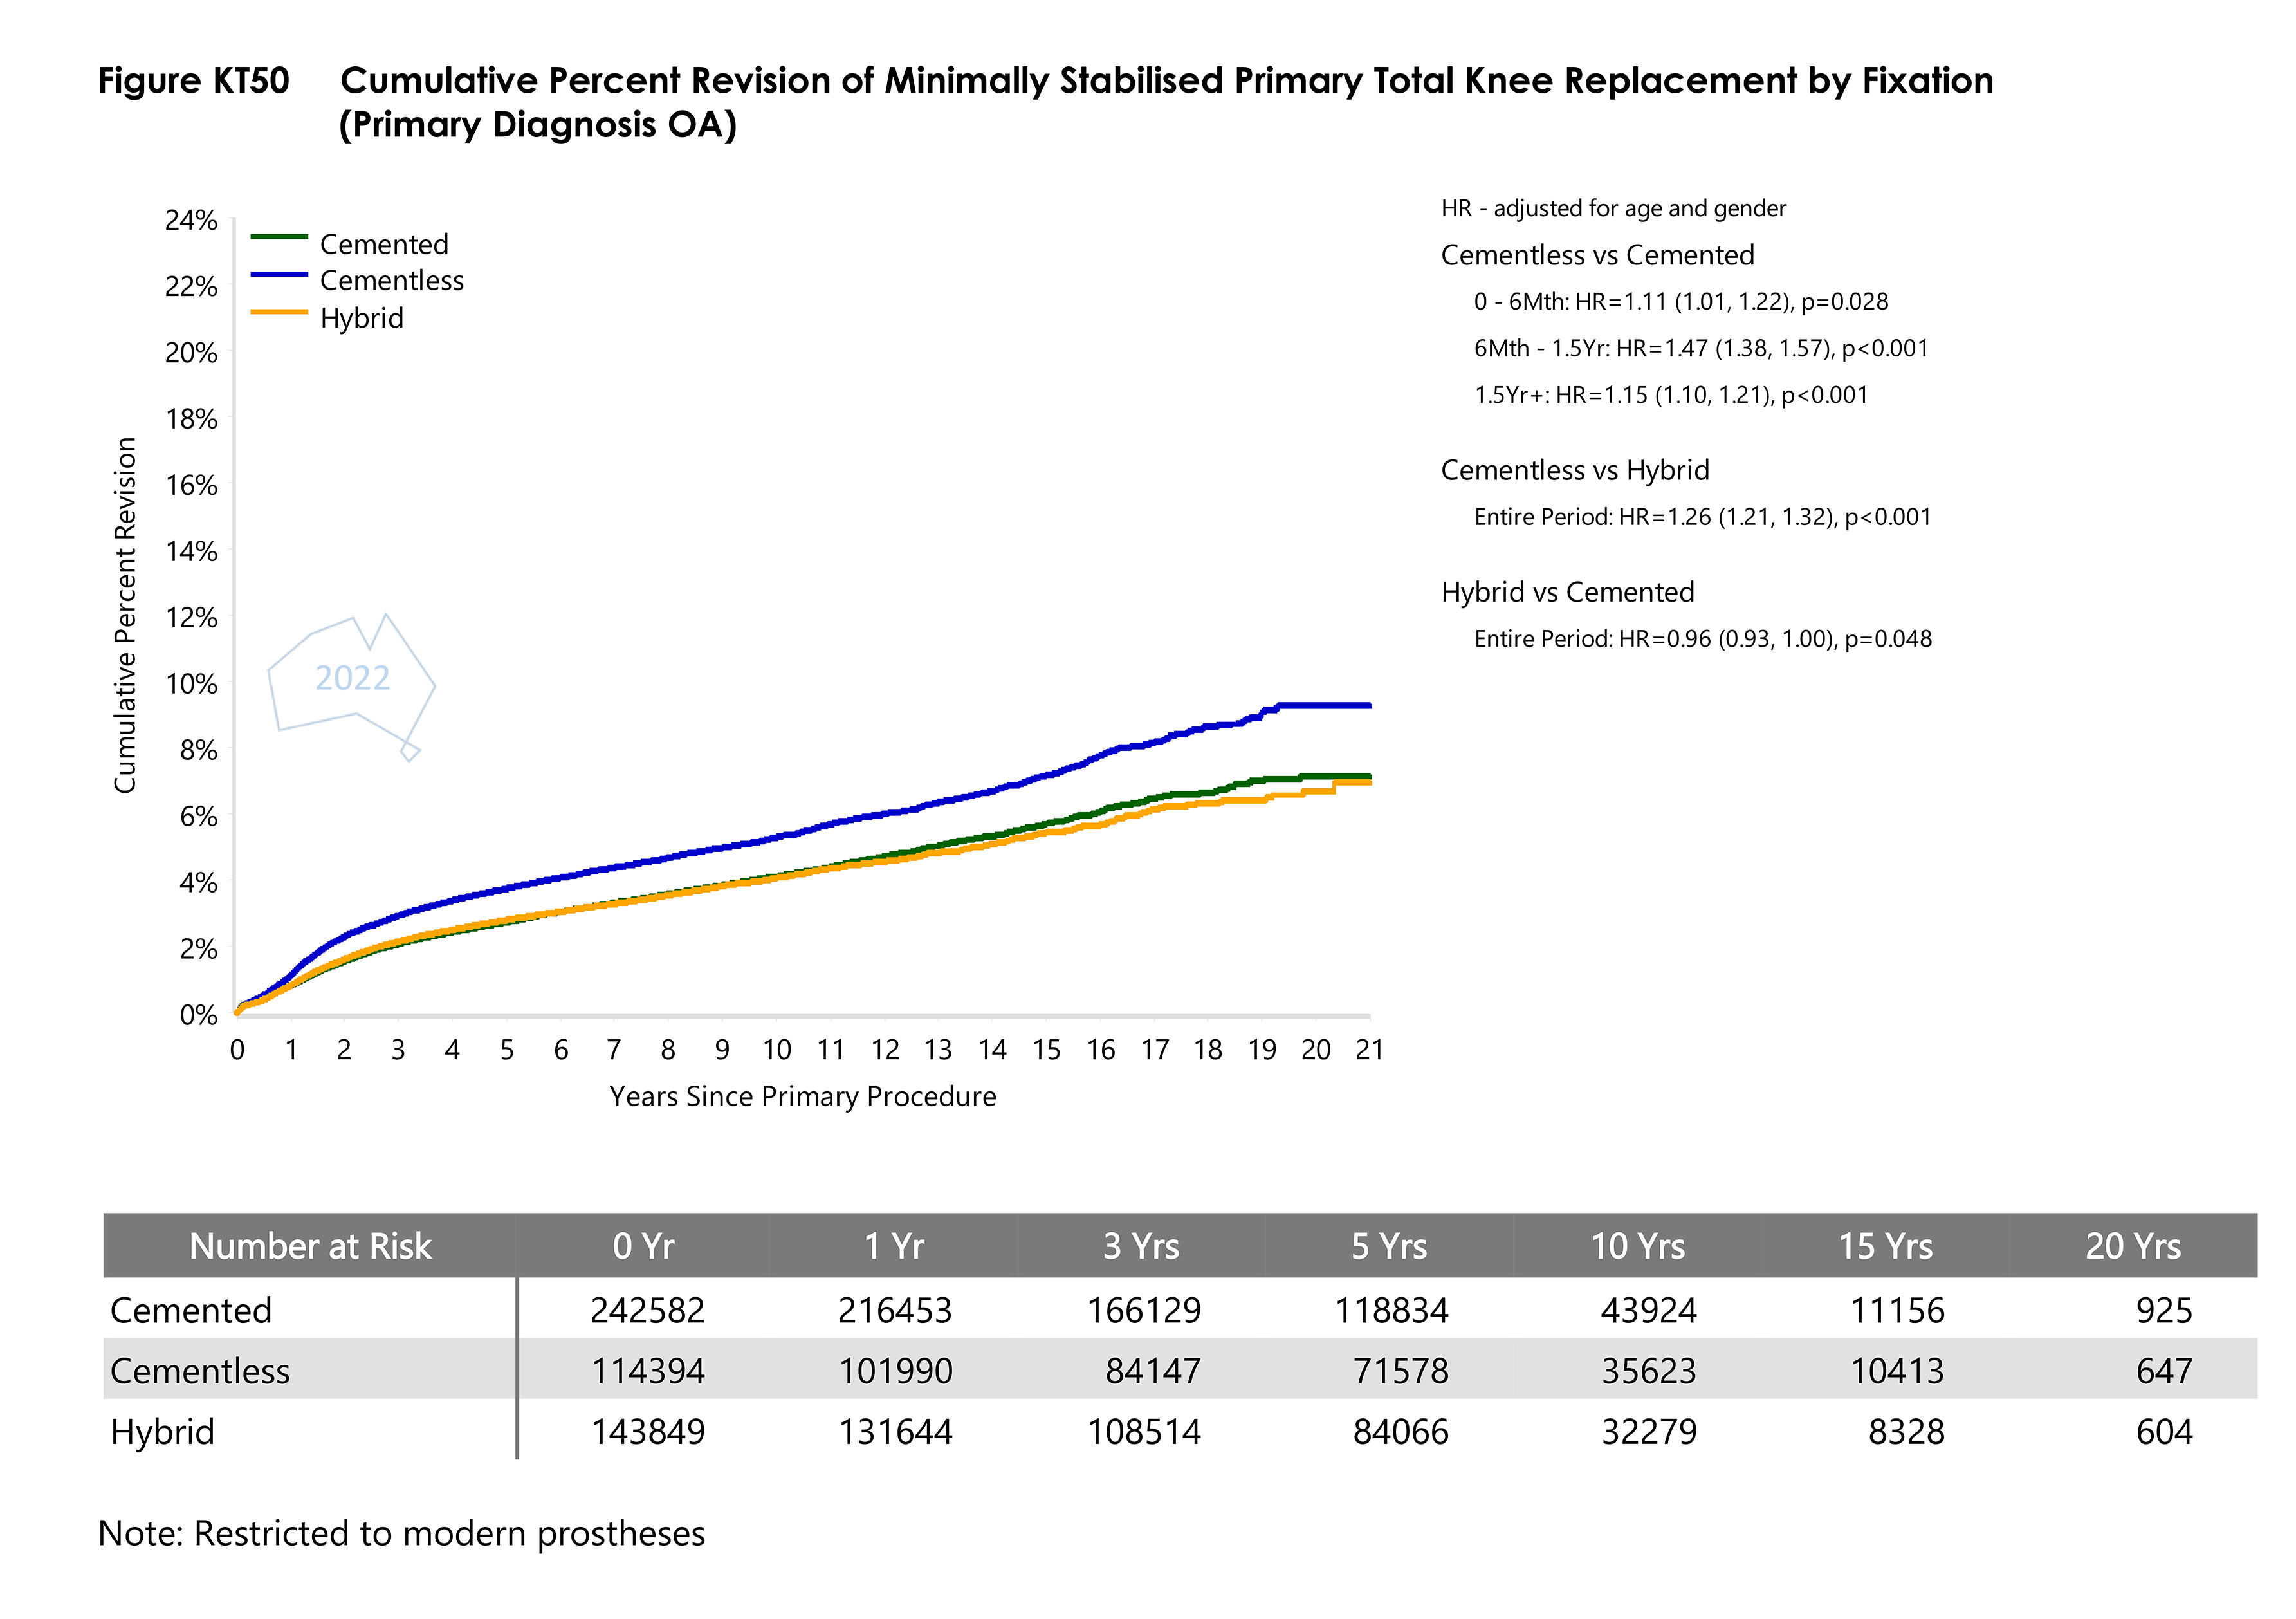
- Figure KT50 Cumulative Percent Revision of Minimally Stabilised Primary Total Knee Replacement by FixationPDF · 249 KB
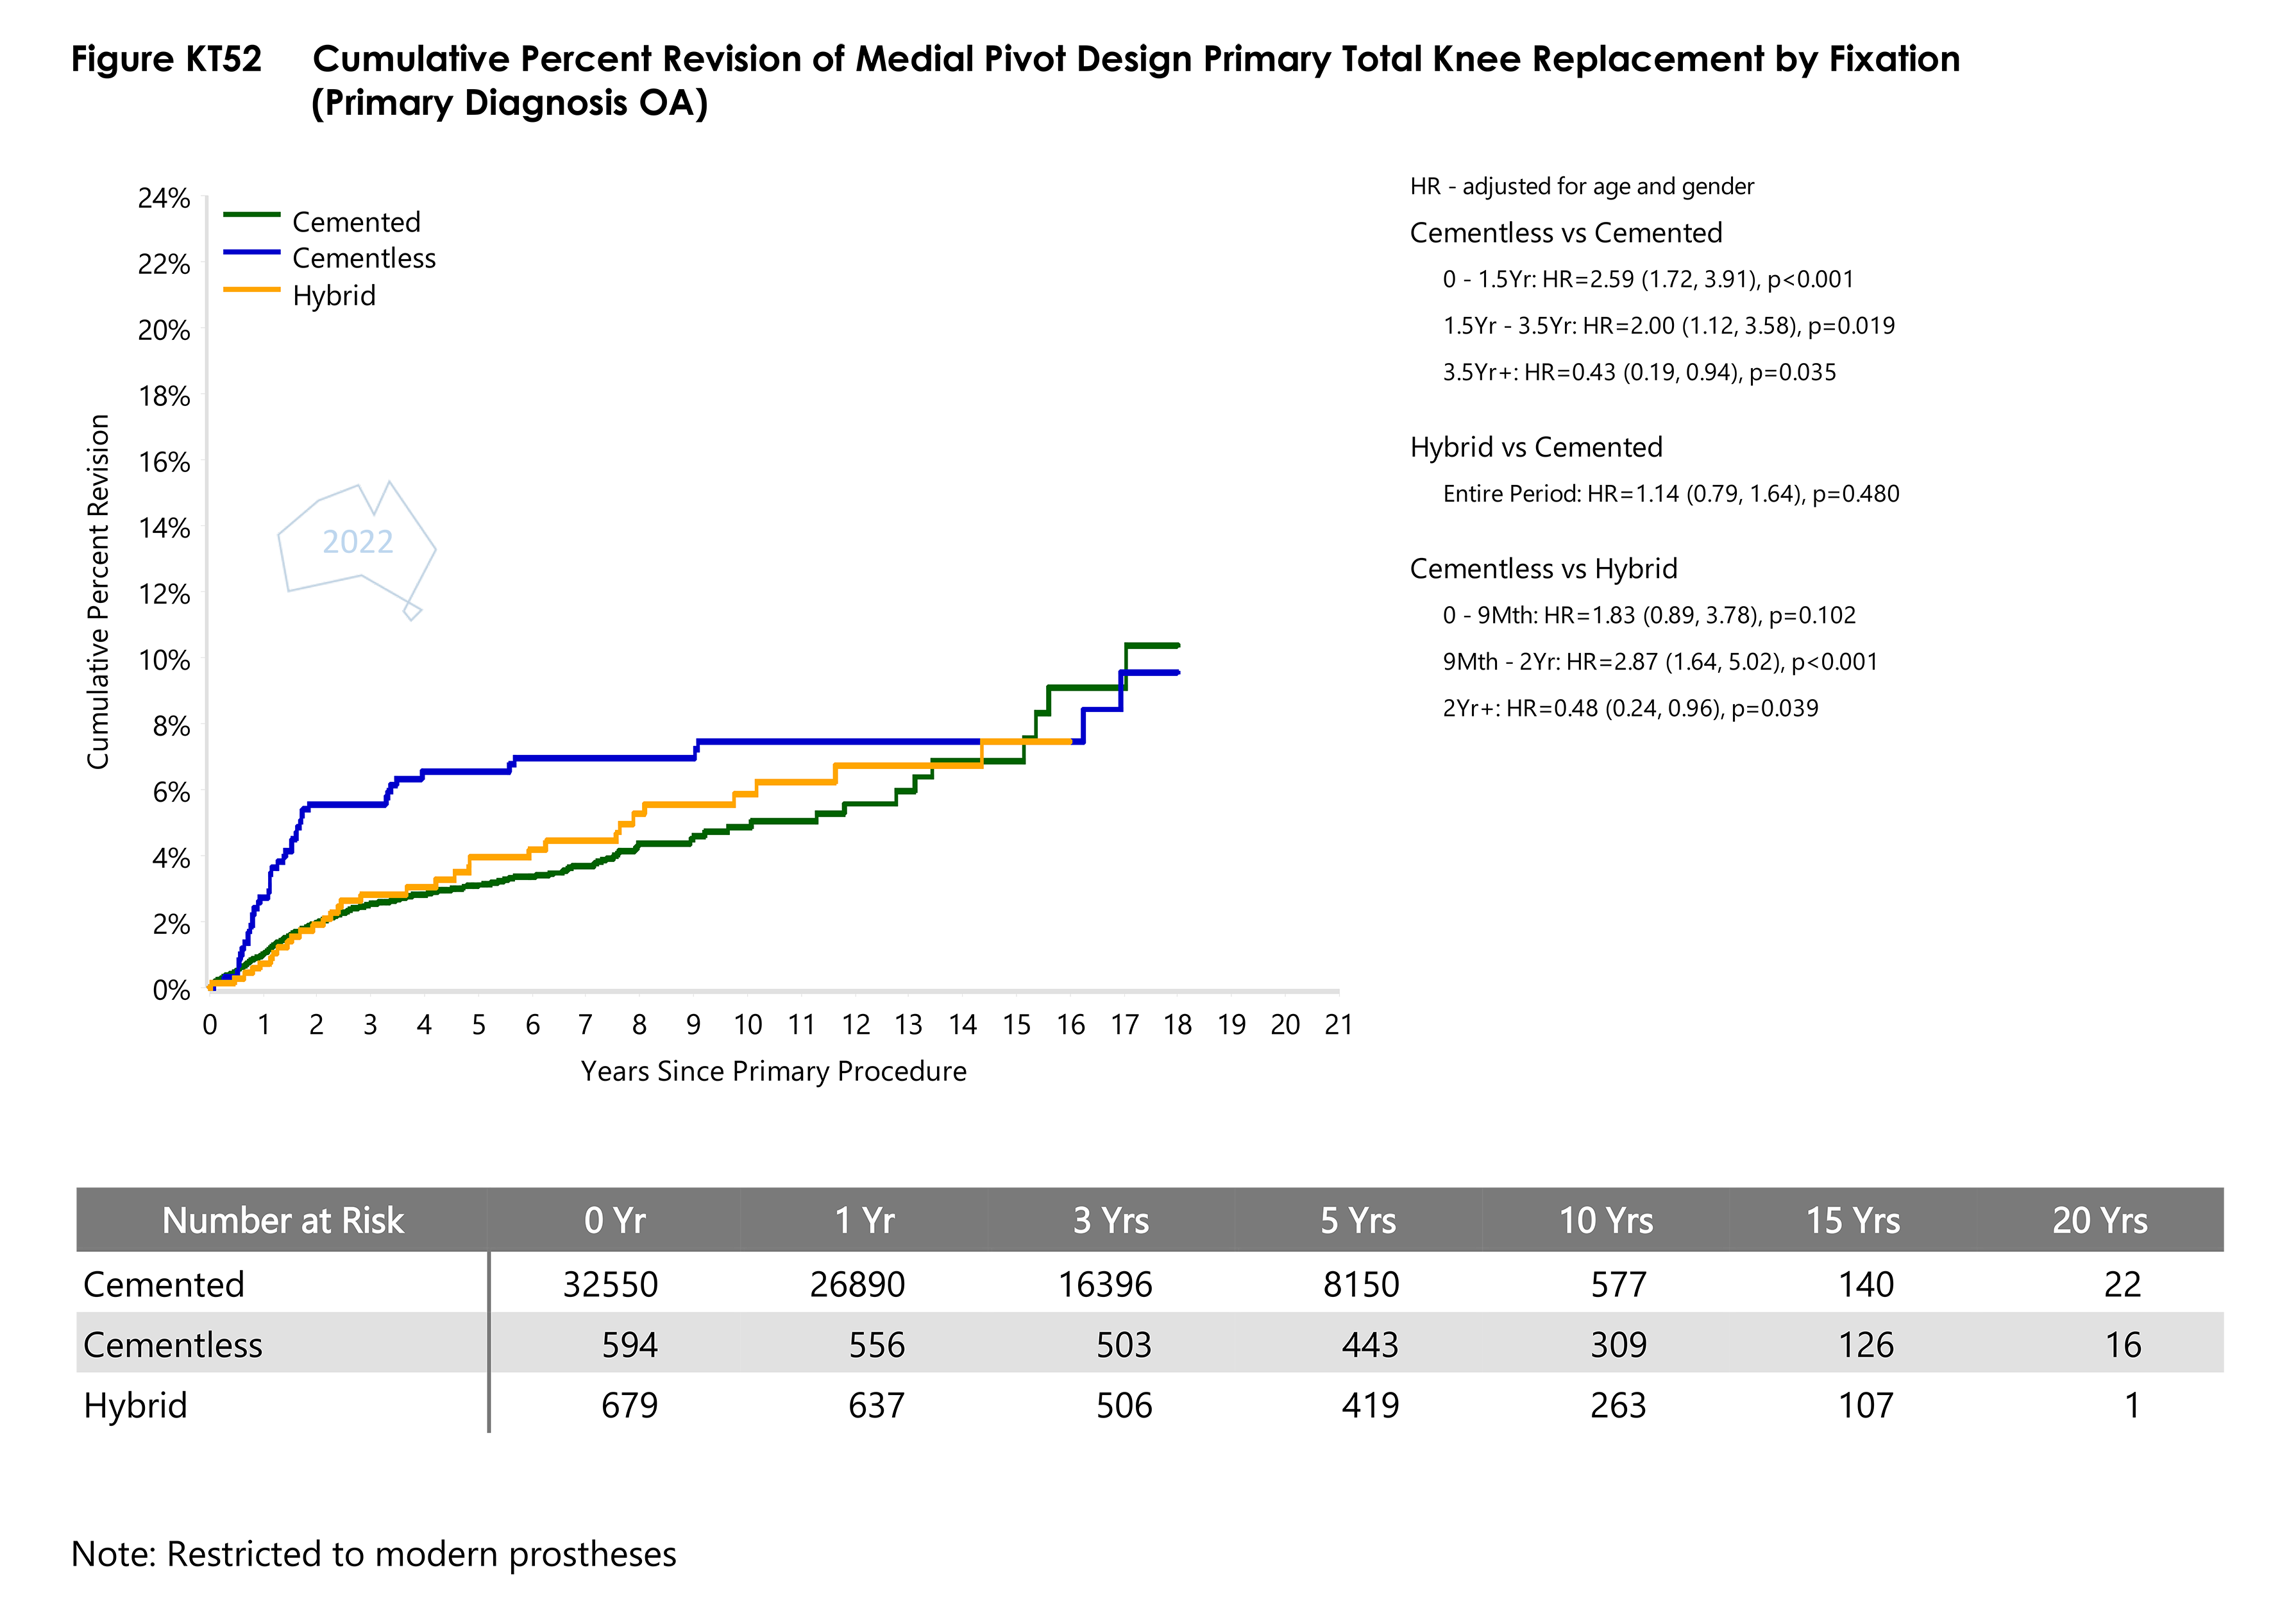
- Figure KT52 Cumulative Percent Revision of Medial Pivot Design Primary Total Knee Replacement by FixationPDF · 94 KB
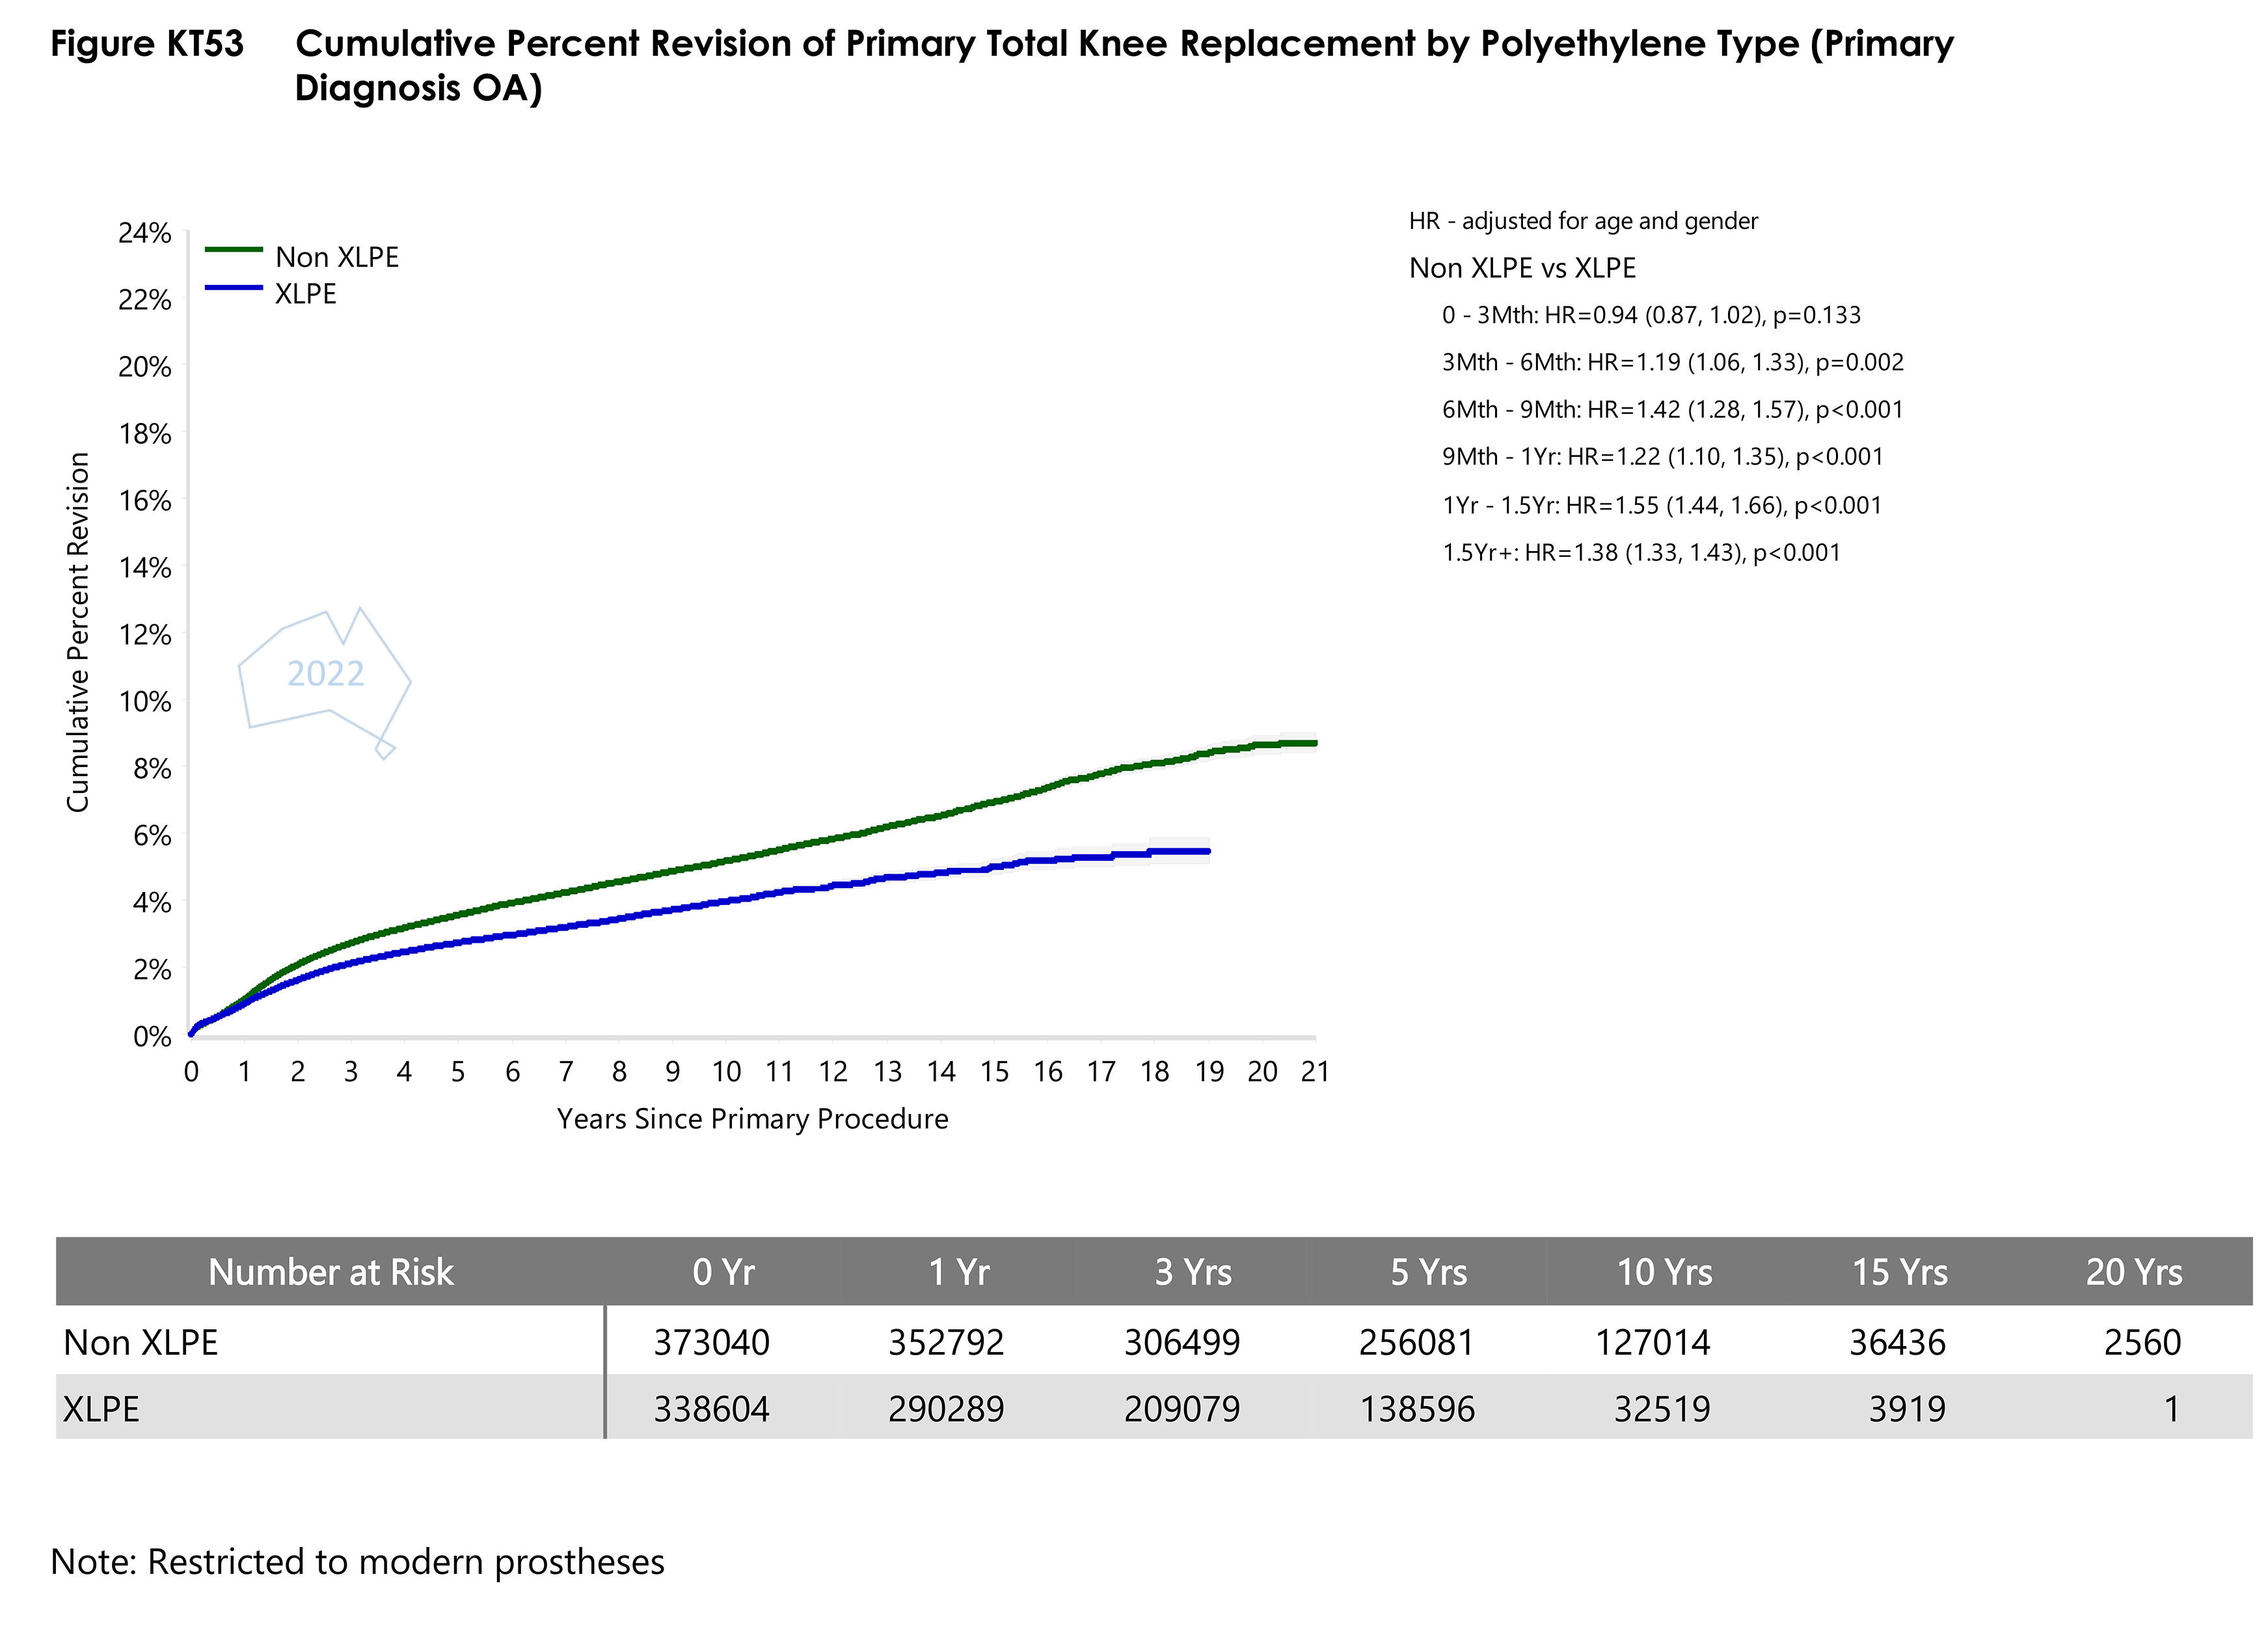
- Figure KT53 Cumulative Percent Revision of Primary Total Knee Replacement by Polyethylene TypePDF · 228 KB
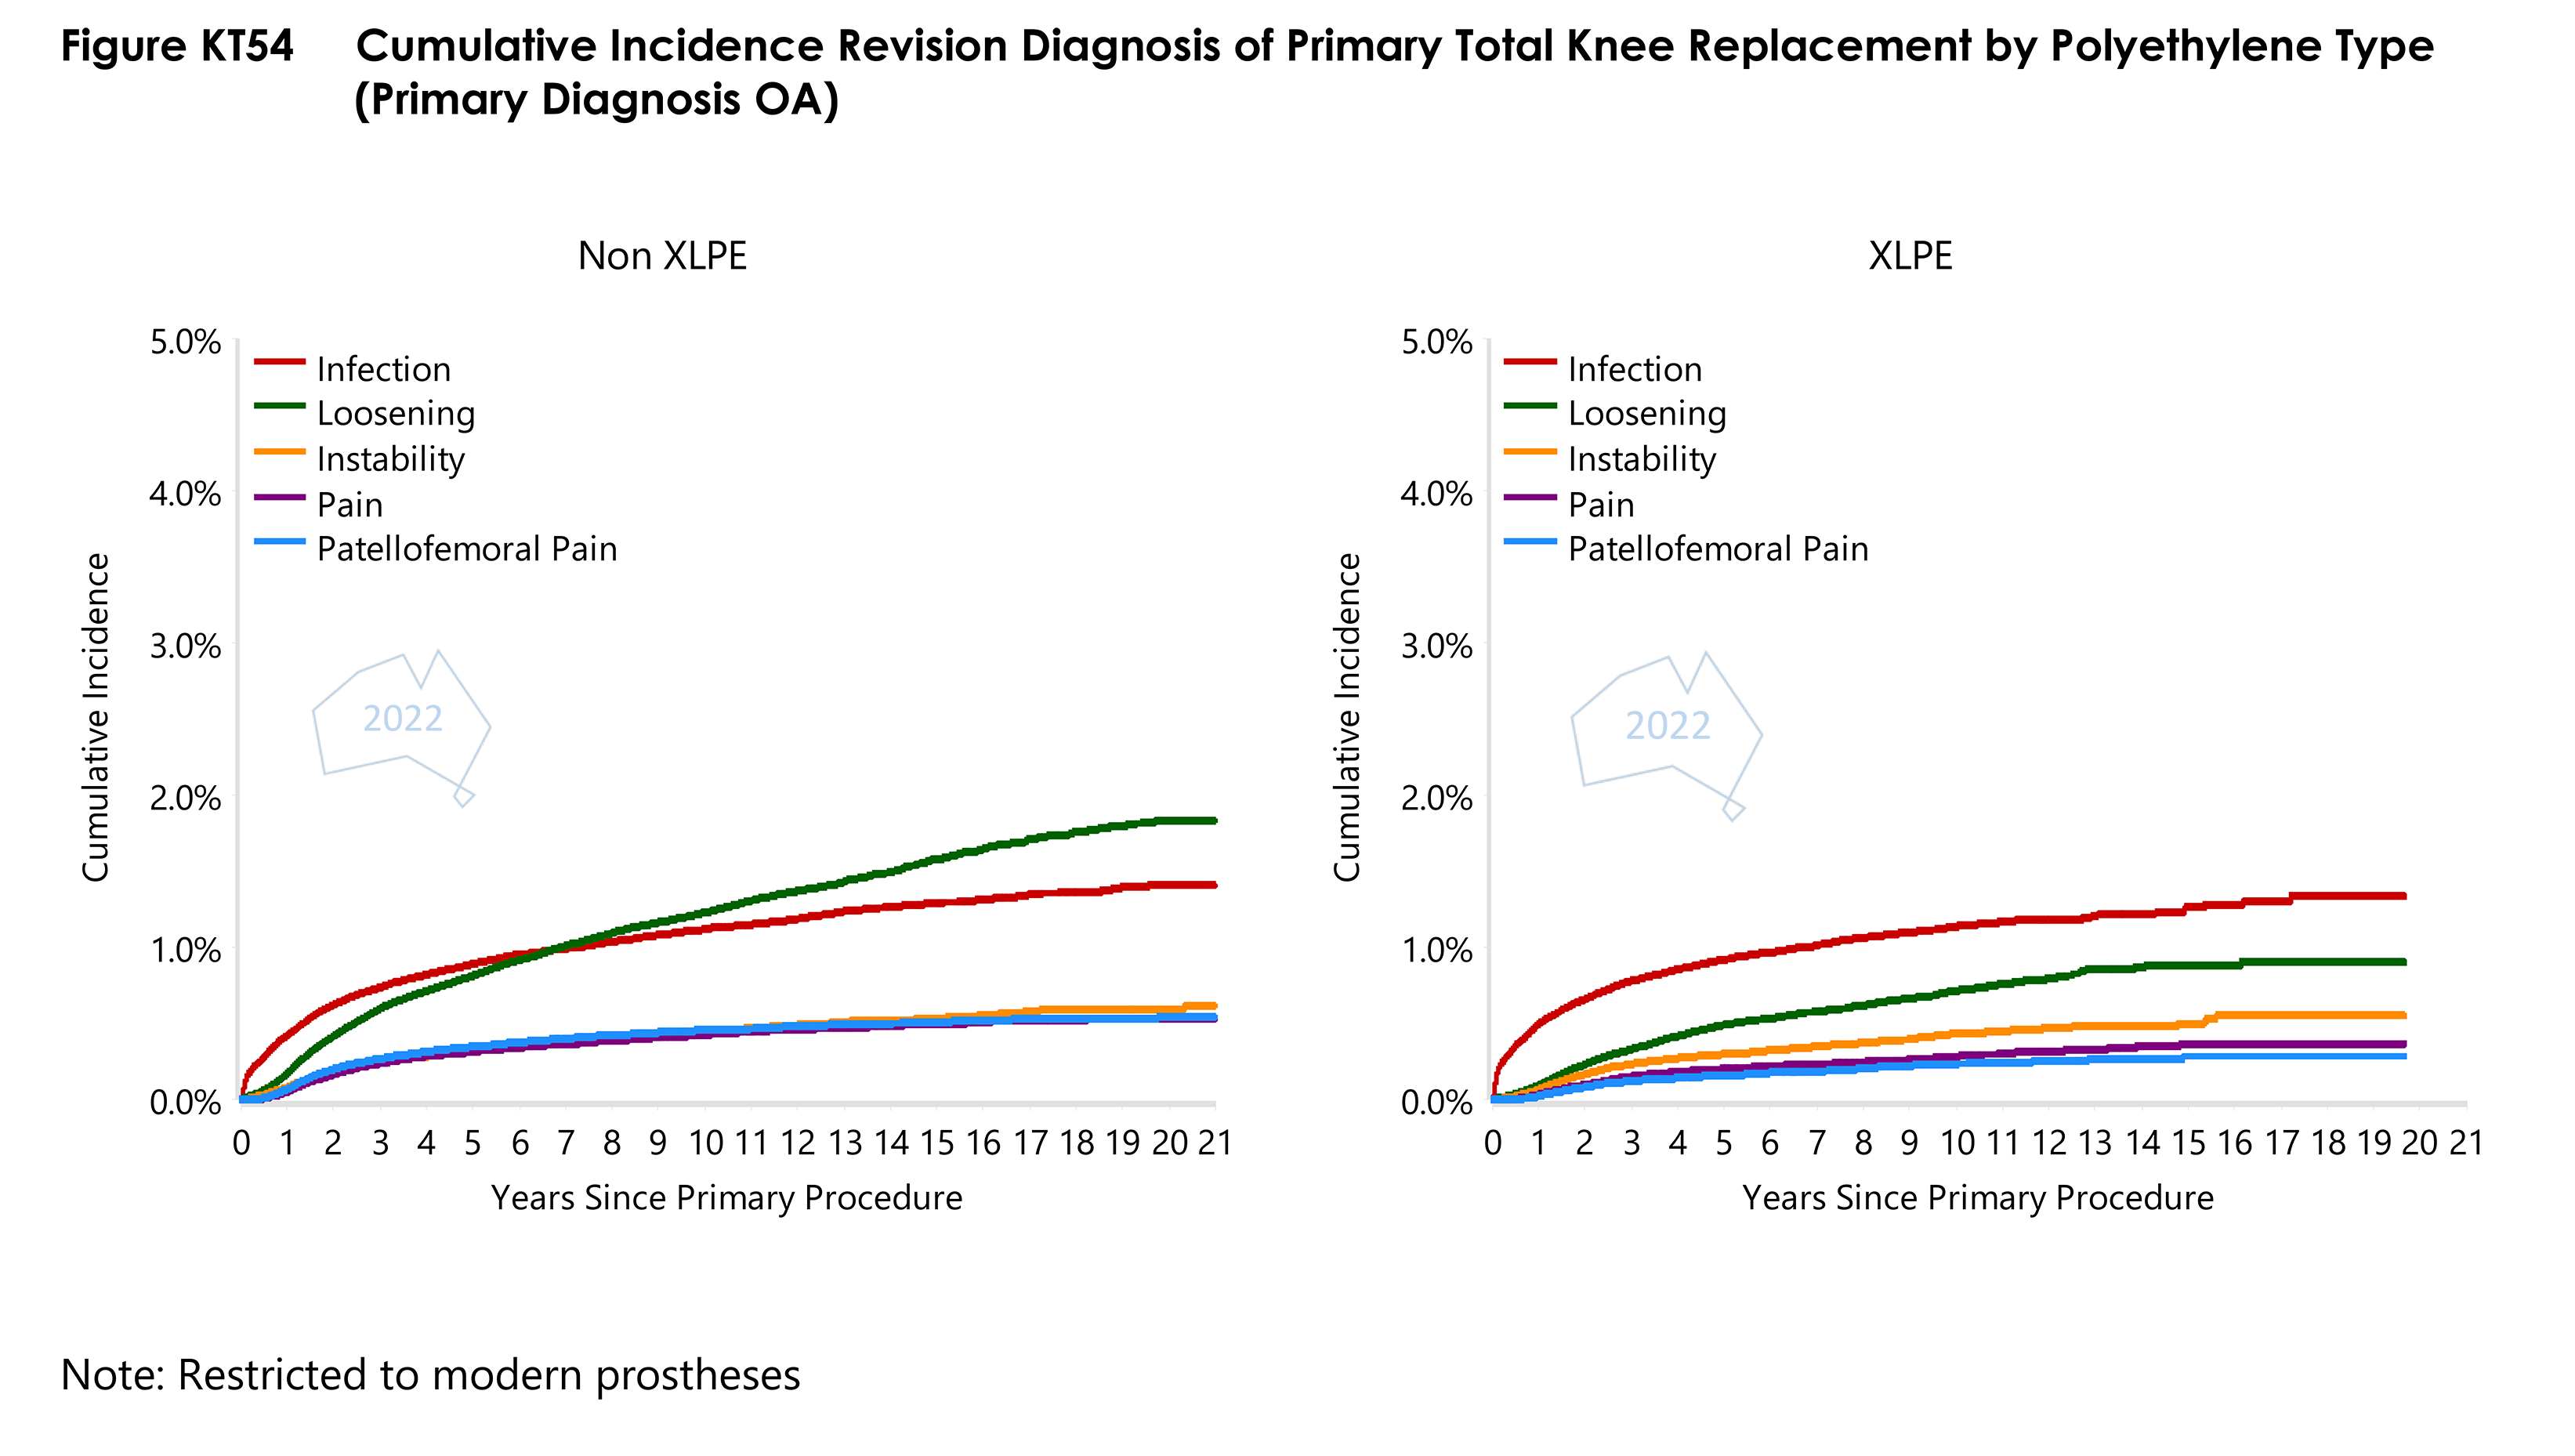
- Figure KT54 Cumulative Incidence Revision Diagnosis of Primary Total Knee Replacement by Polyethylene TypePDF · 319 KB
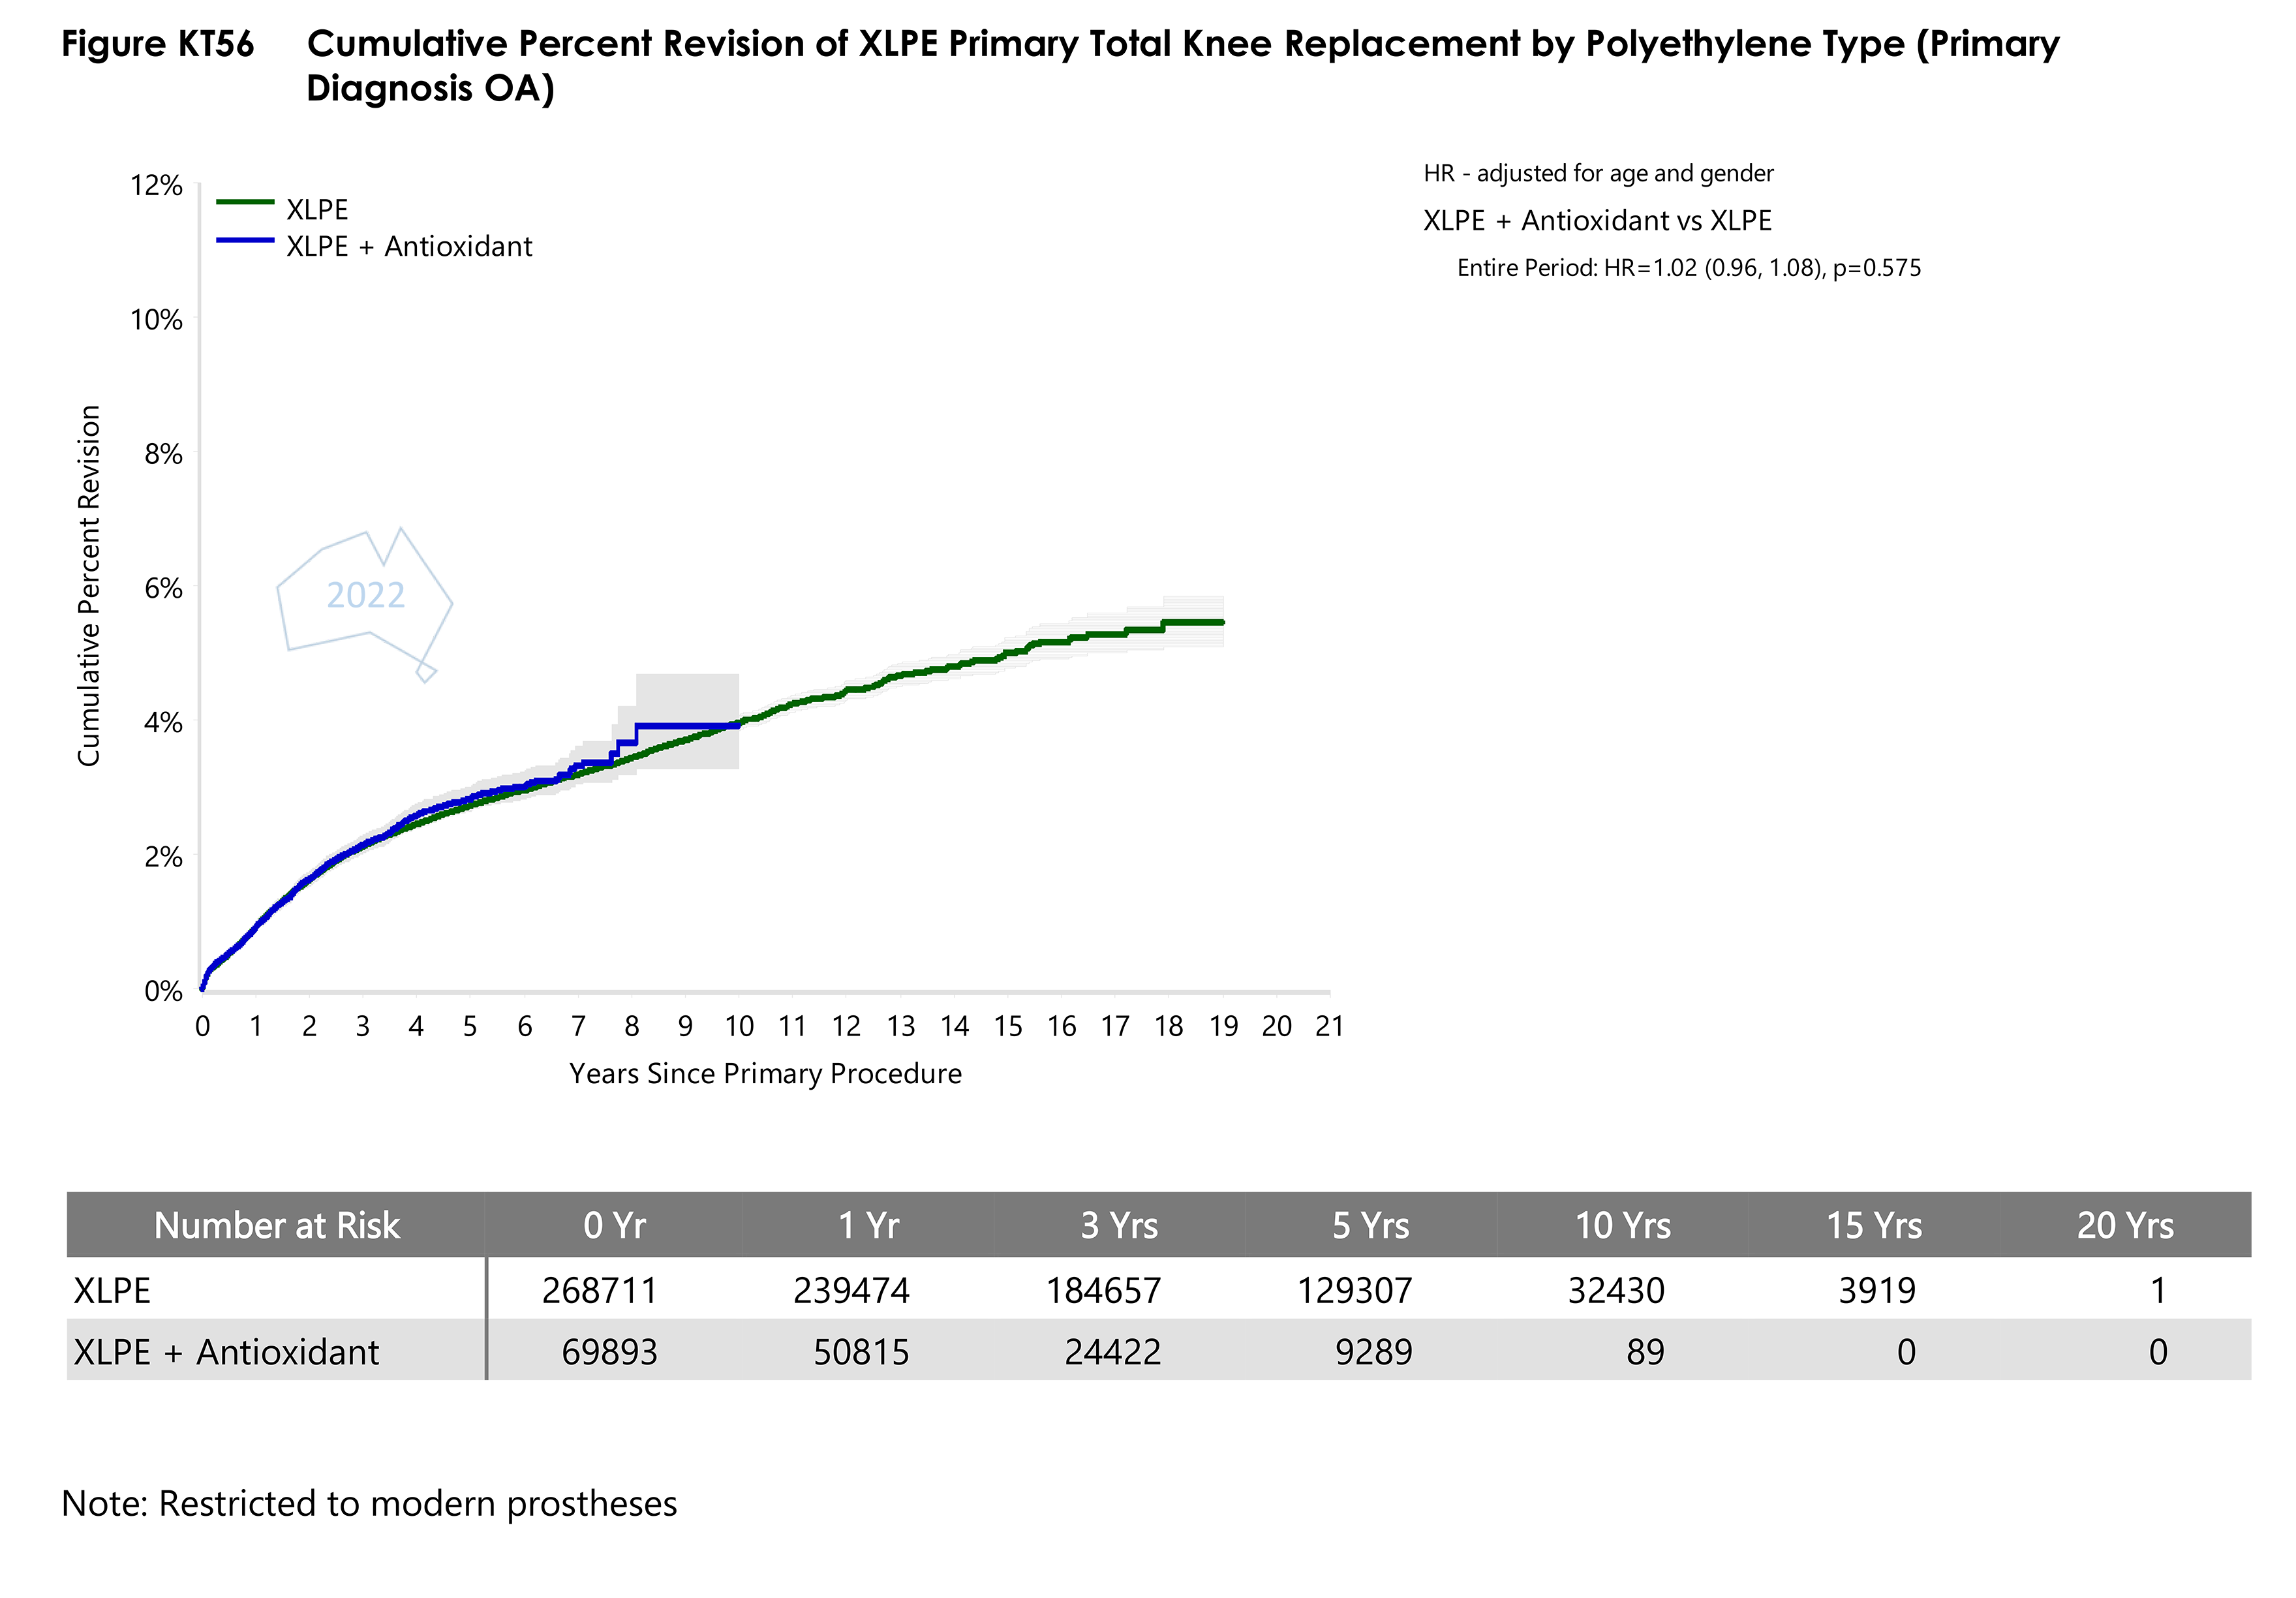
- Figure KT56 Cumulative Percent Revision of XLPE Primary Total Knee Replacement by Polyethylene TypePDF · 158 KB
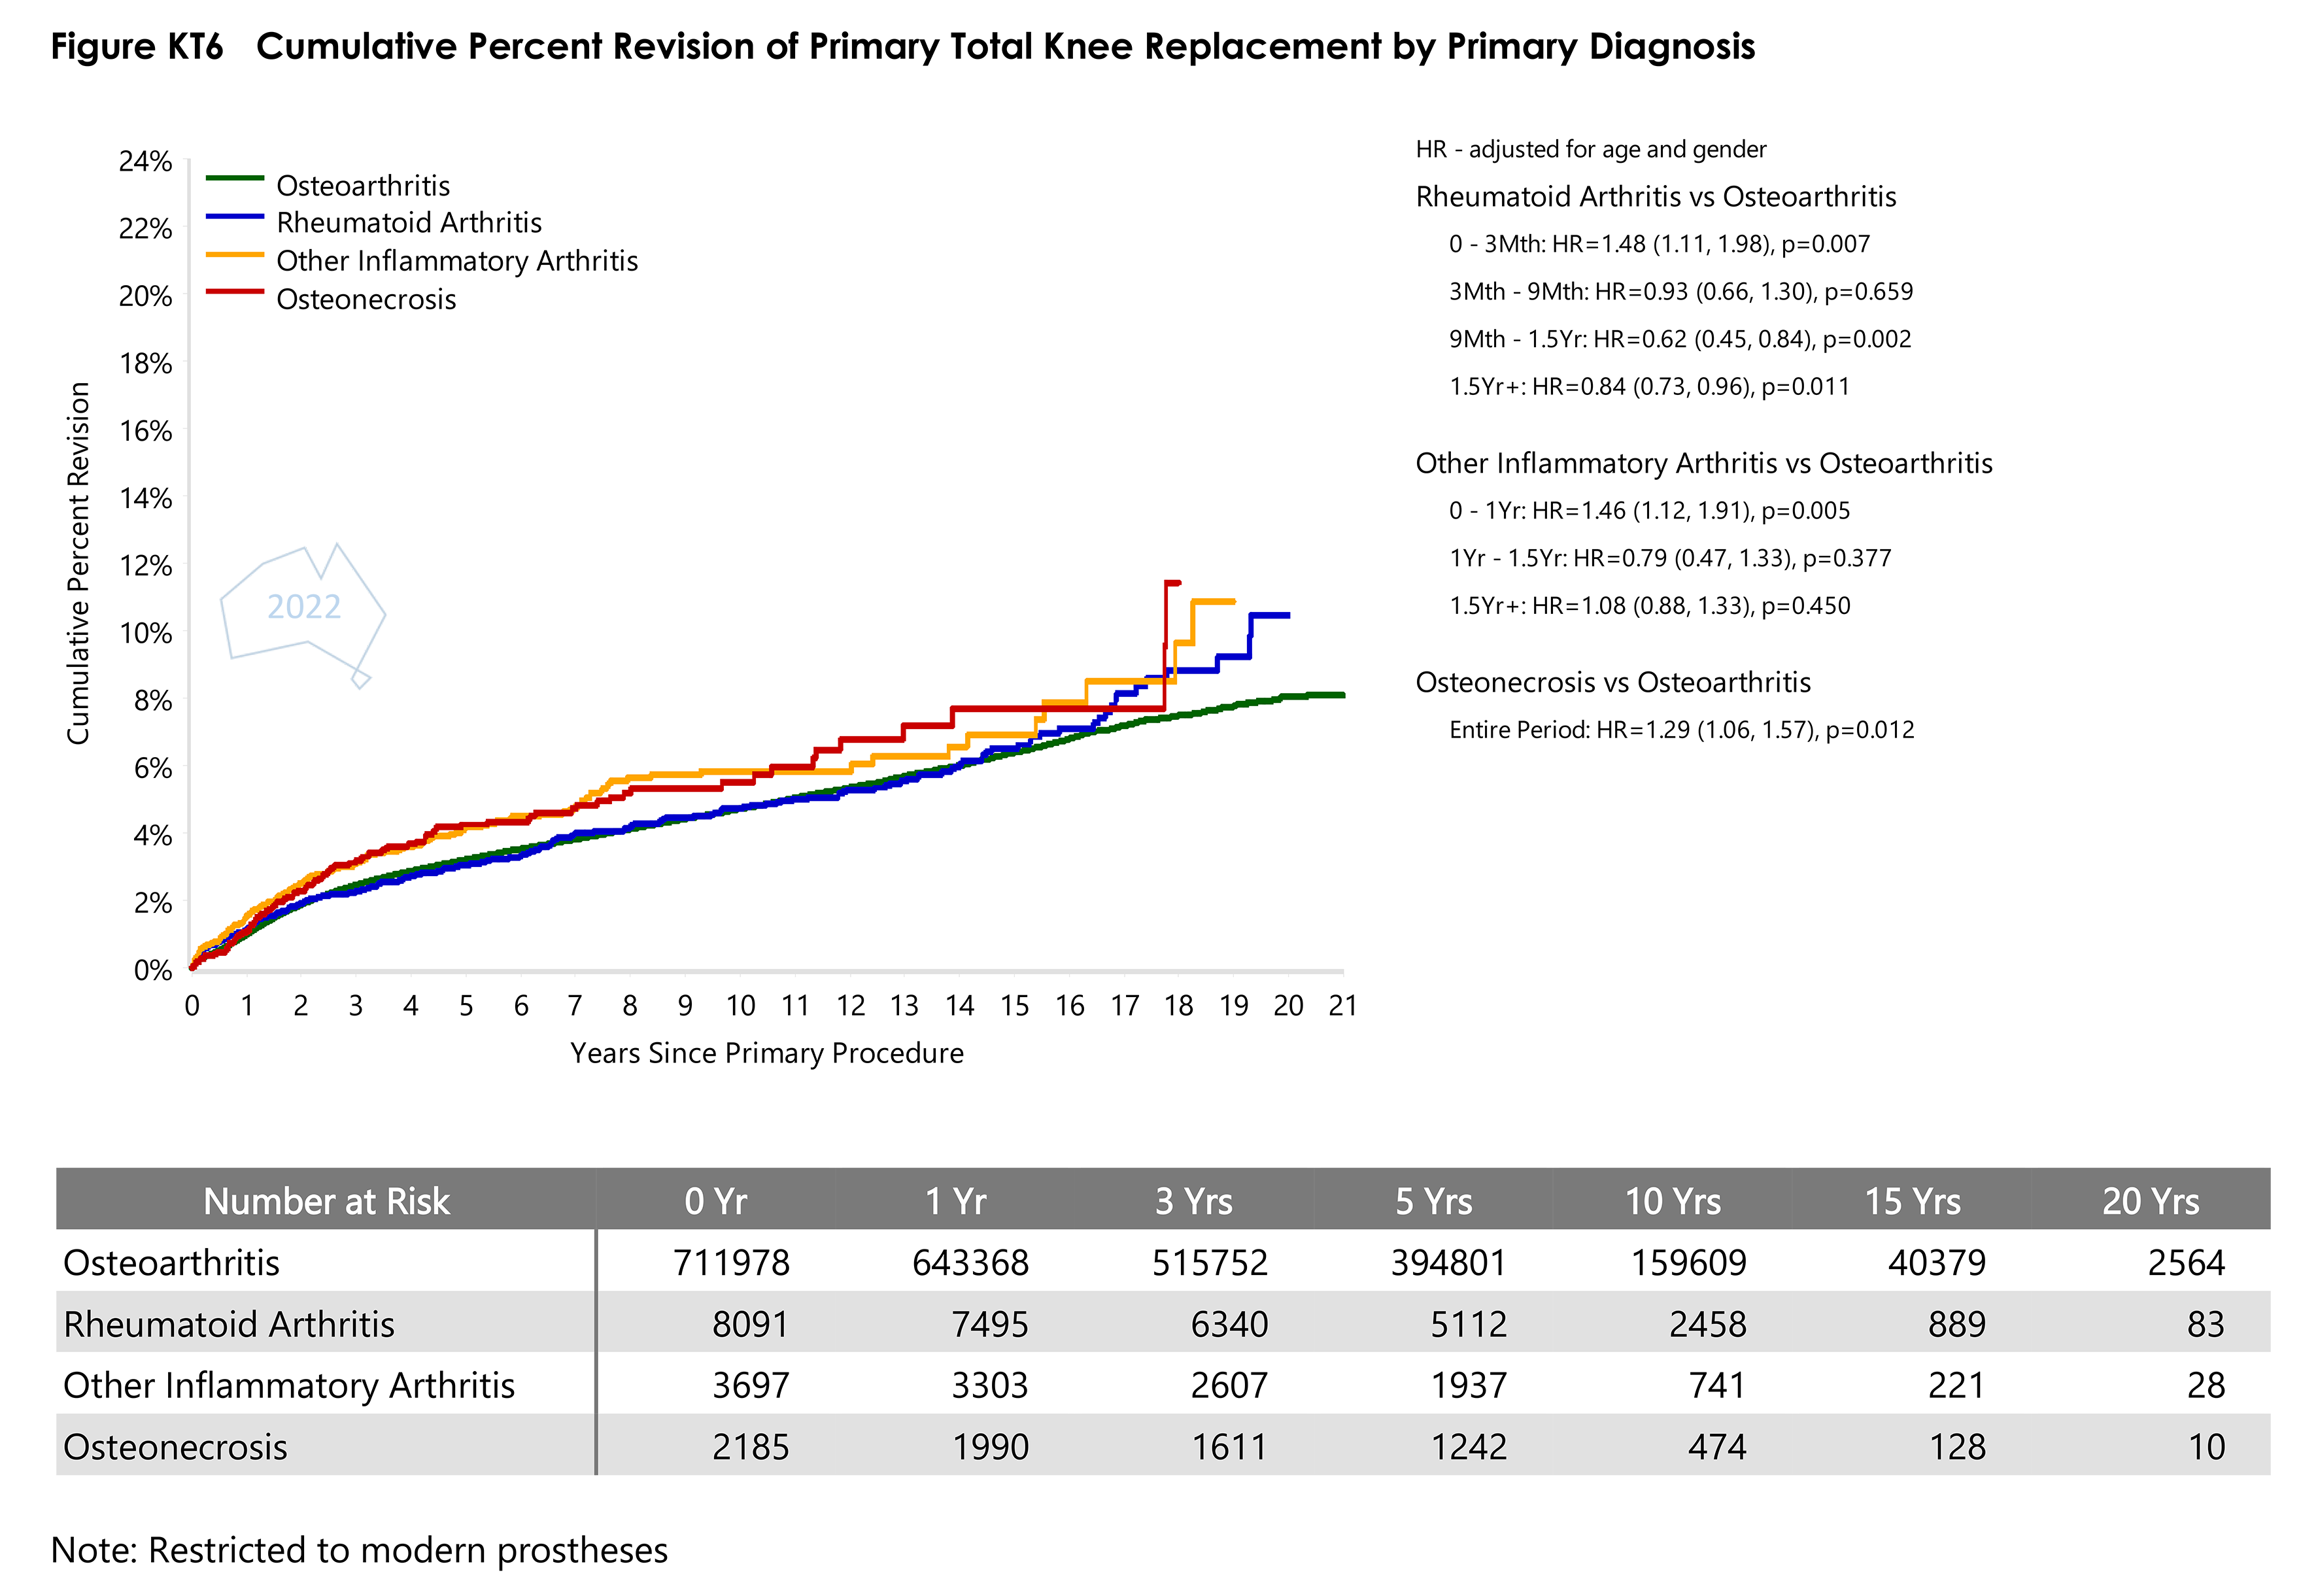
- Figure KT6 Cumulative Percent Revision of Primary Total Knee Replacement by Primary DiagnosisPDF · 191 KB
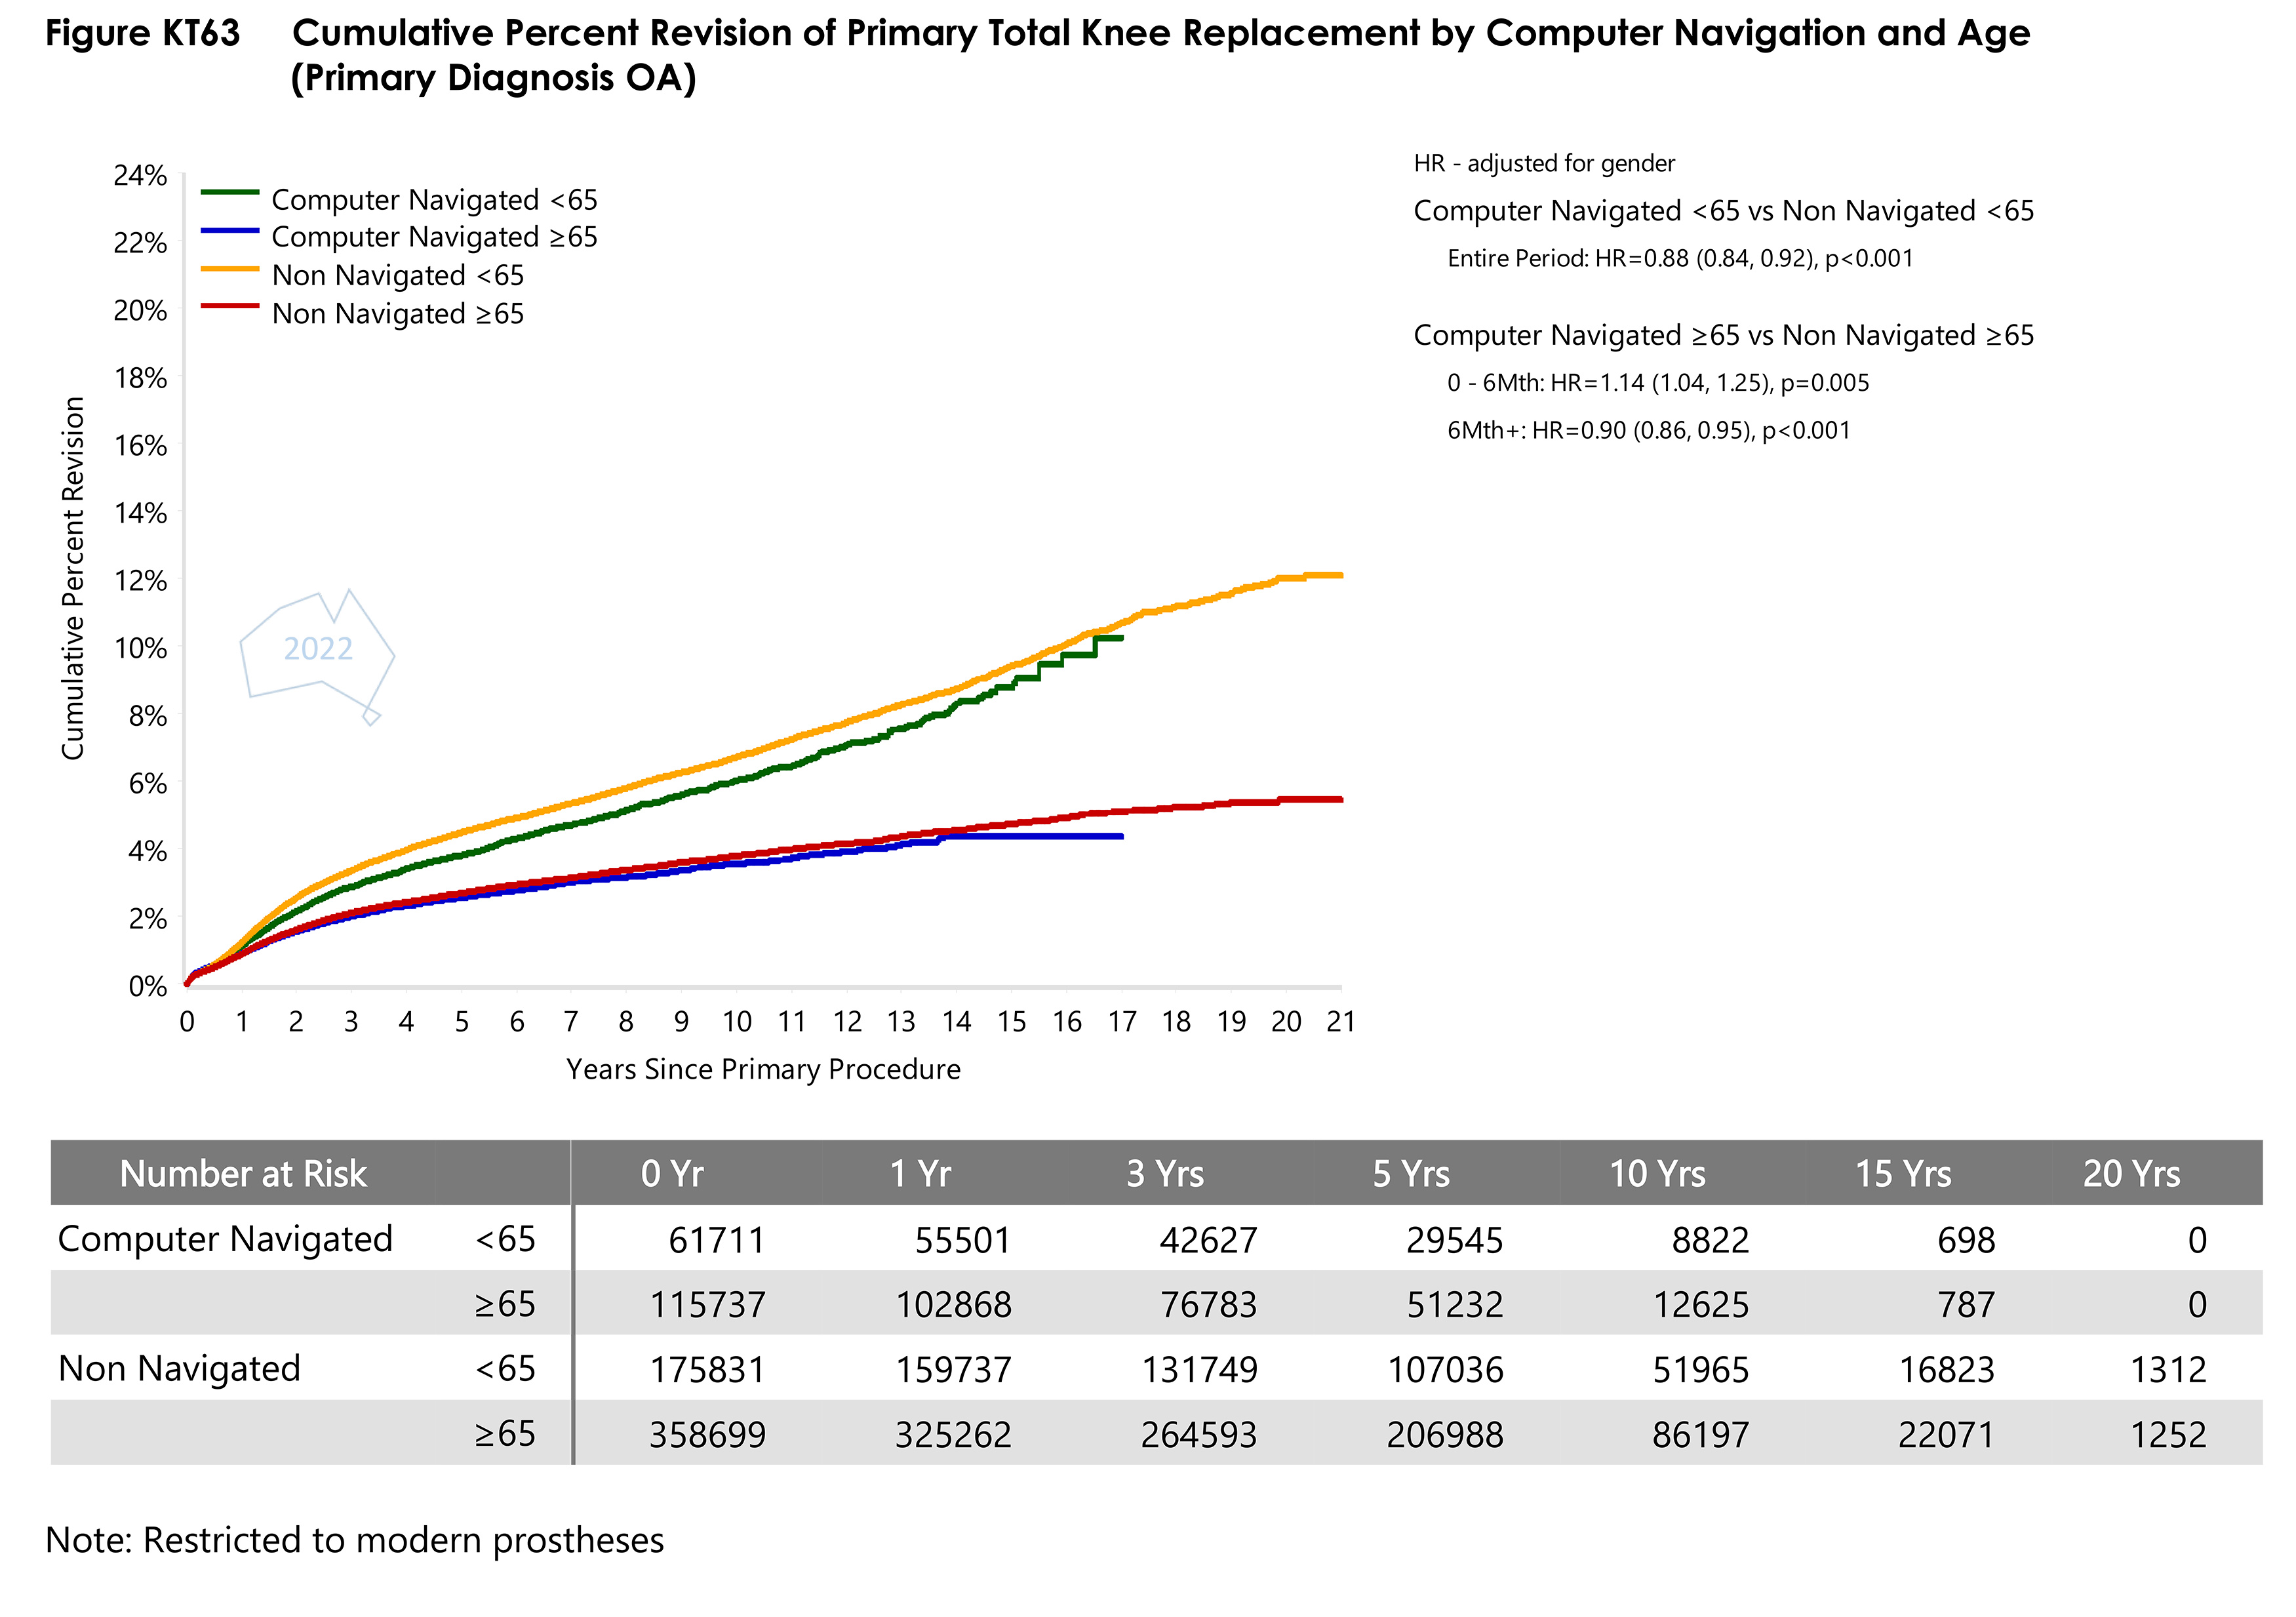
- Figure KT63 Cumulative Percent Revision of Primary Total Knee Replacement by Computer Navigation and AgePDF · 297 KB
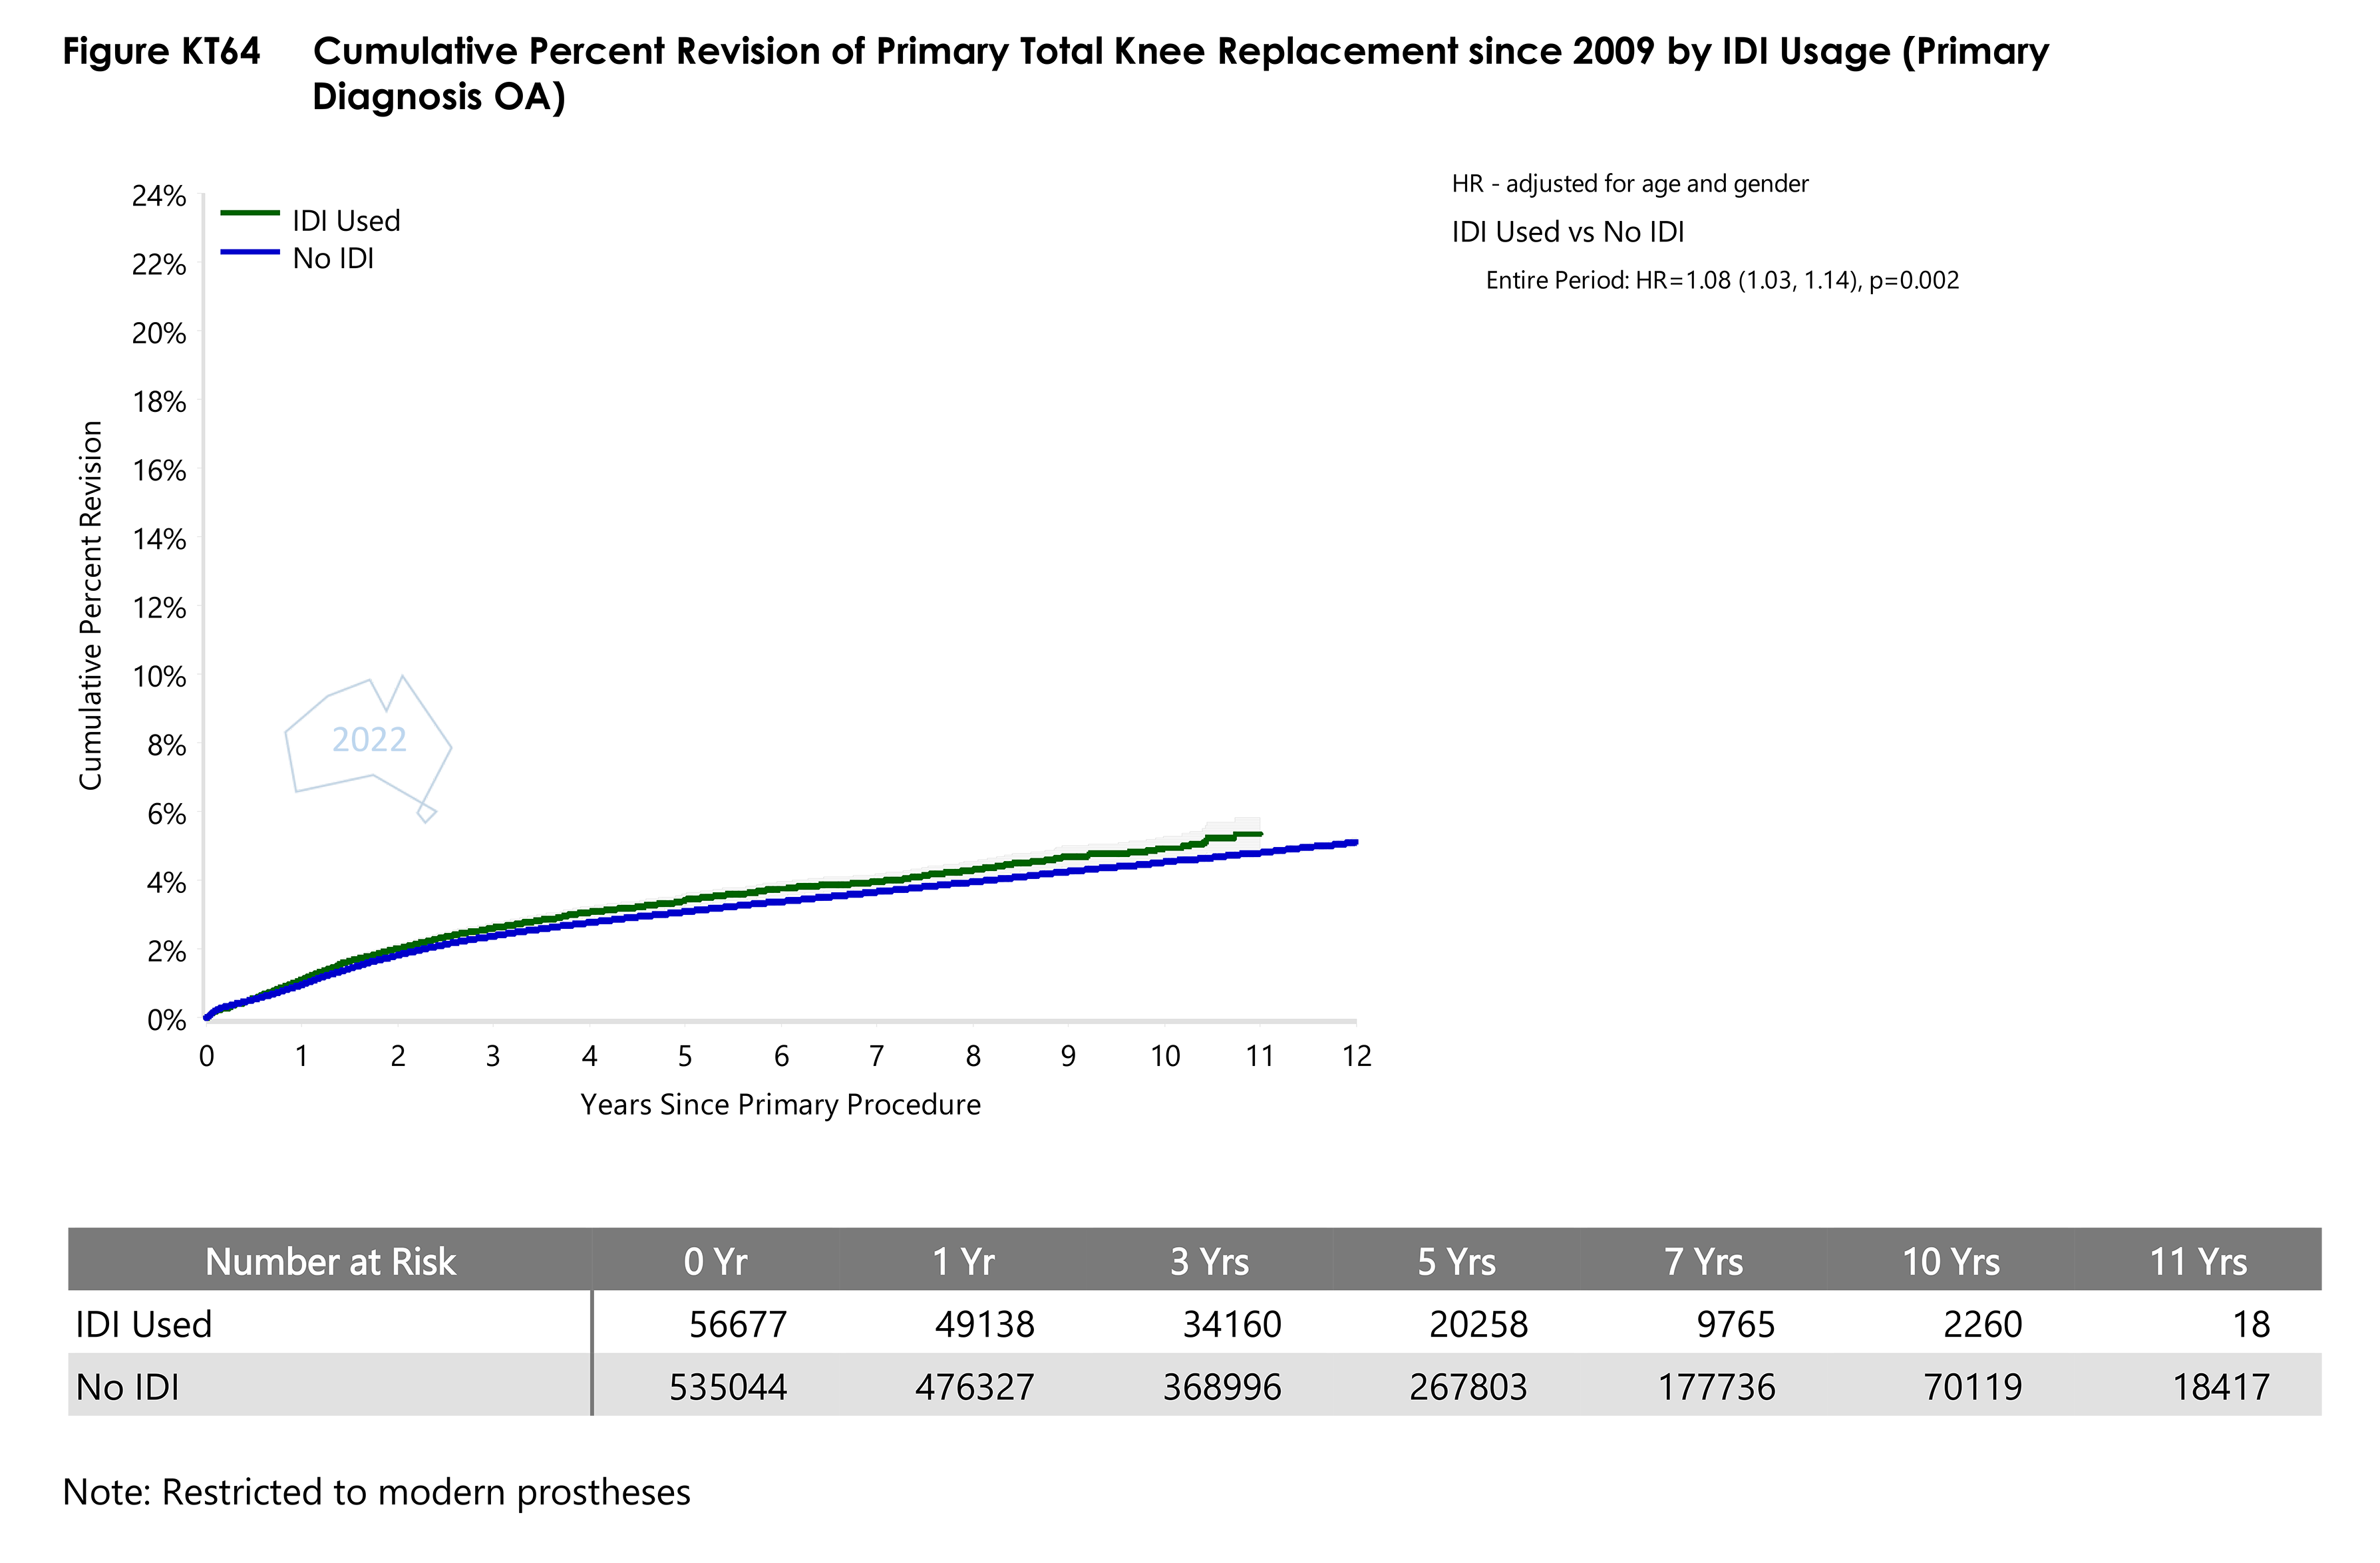
- Figure KT64 Cumulative Percent Revision of Primary Total Knee Replacement since 2009 by IDI UsagePDF · 204 KB
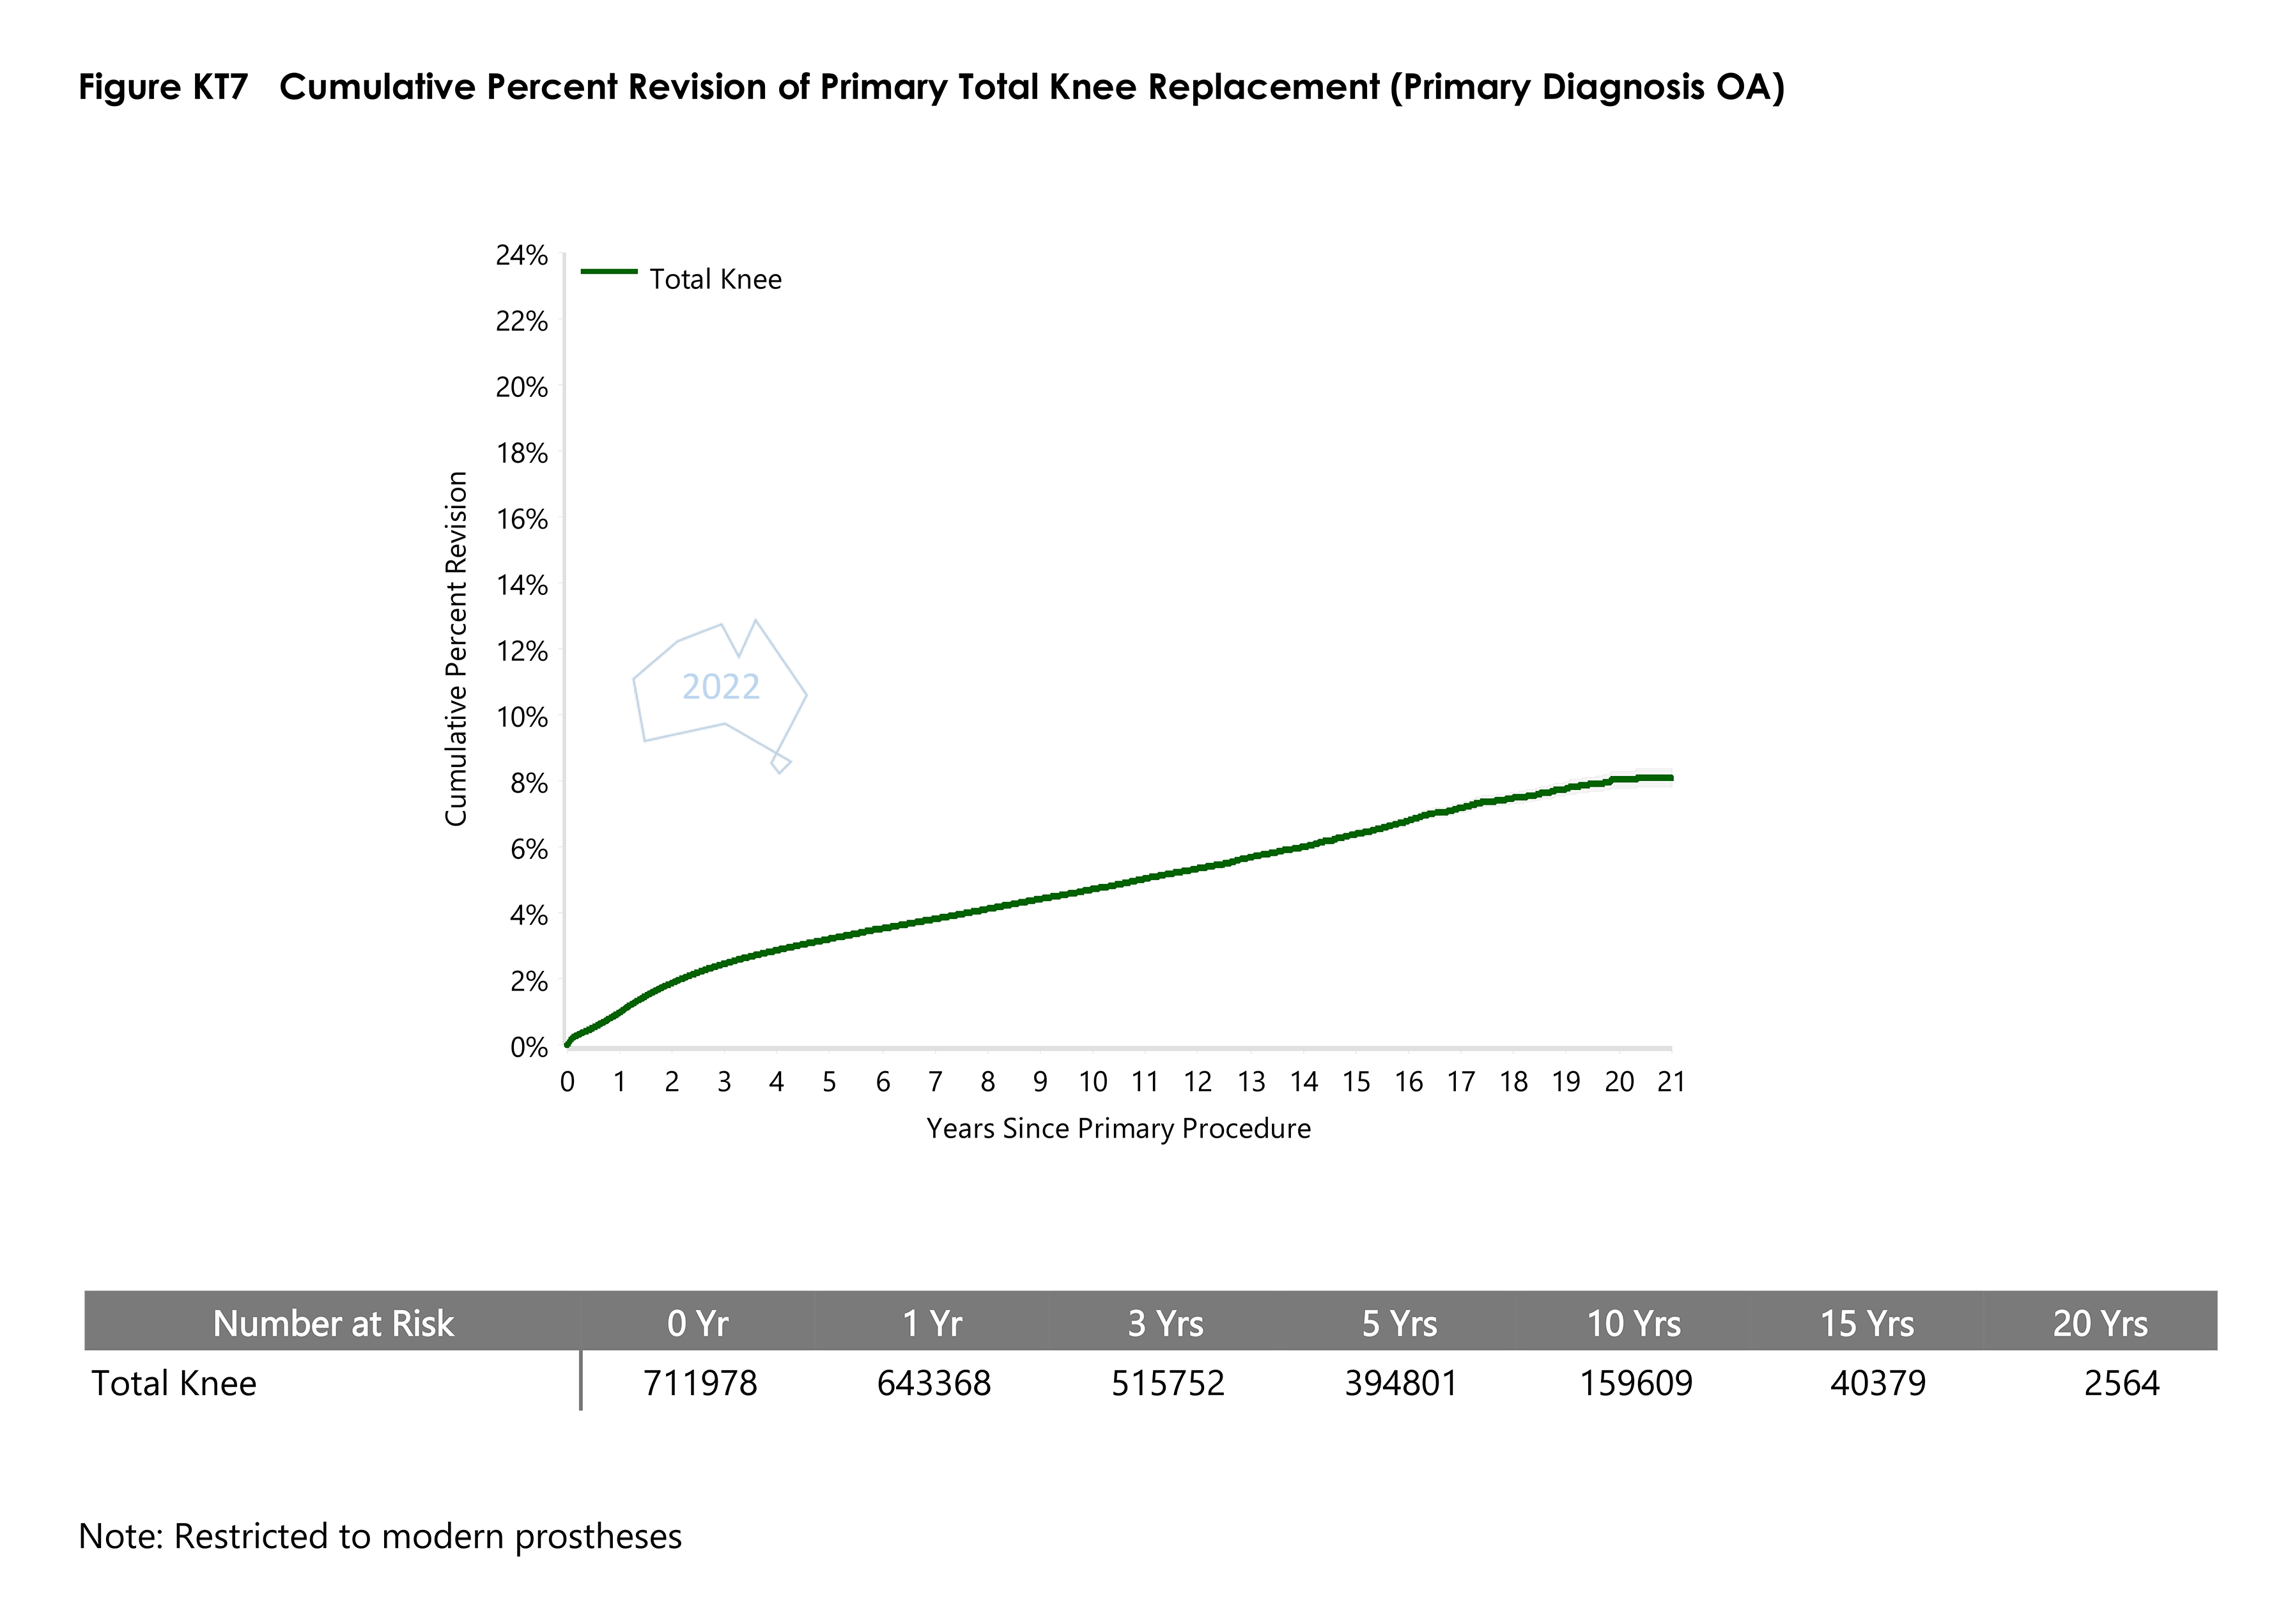
- Figure KT7 Cumulative Percent Revision of Primary Total Knee ReplacementPDF · 146 KB
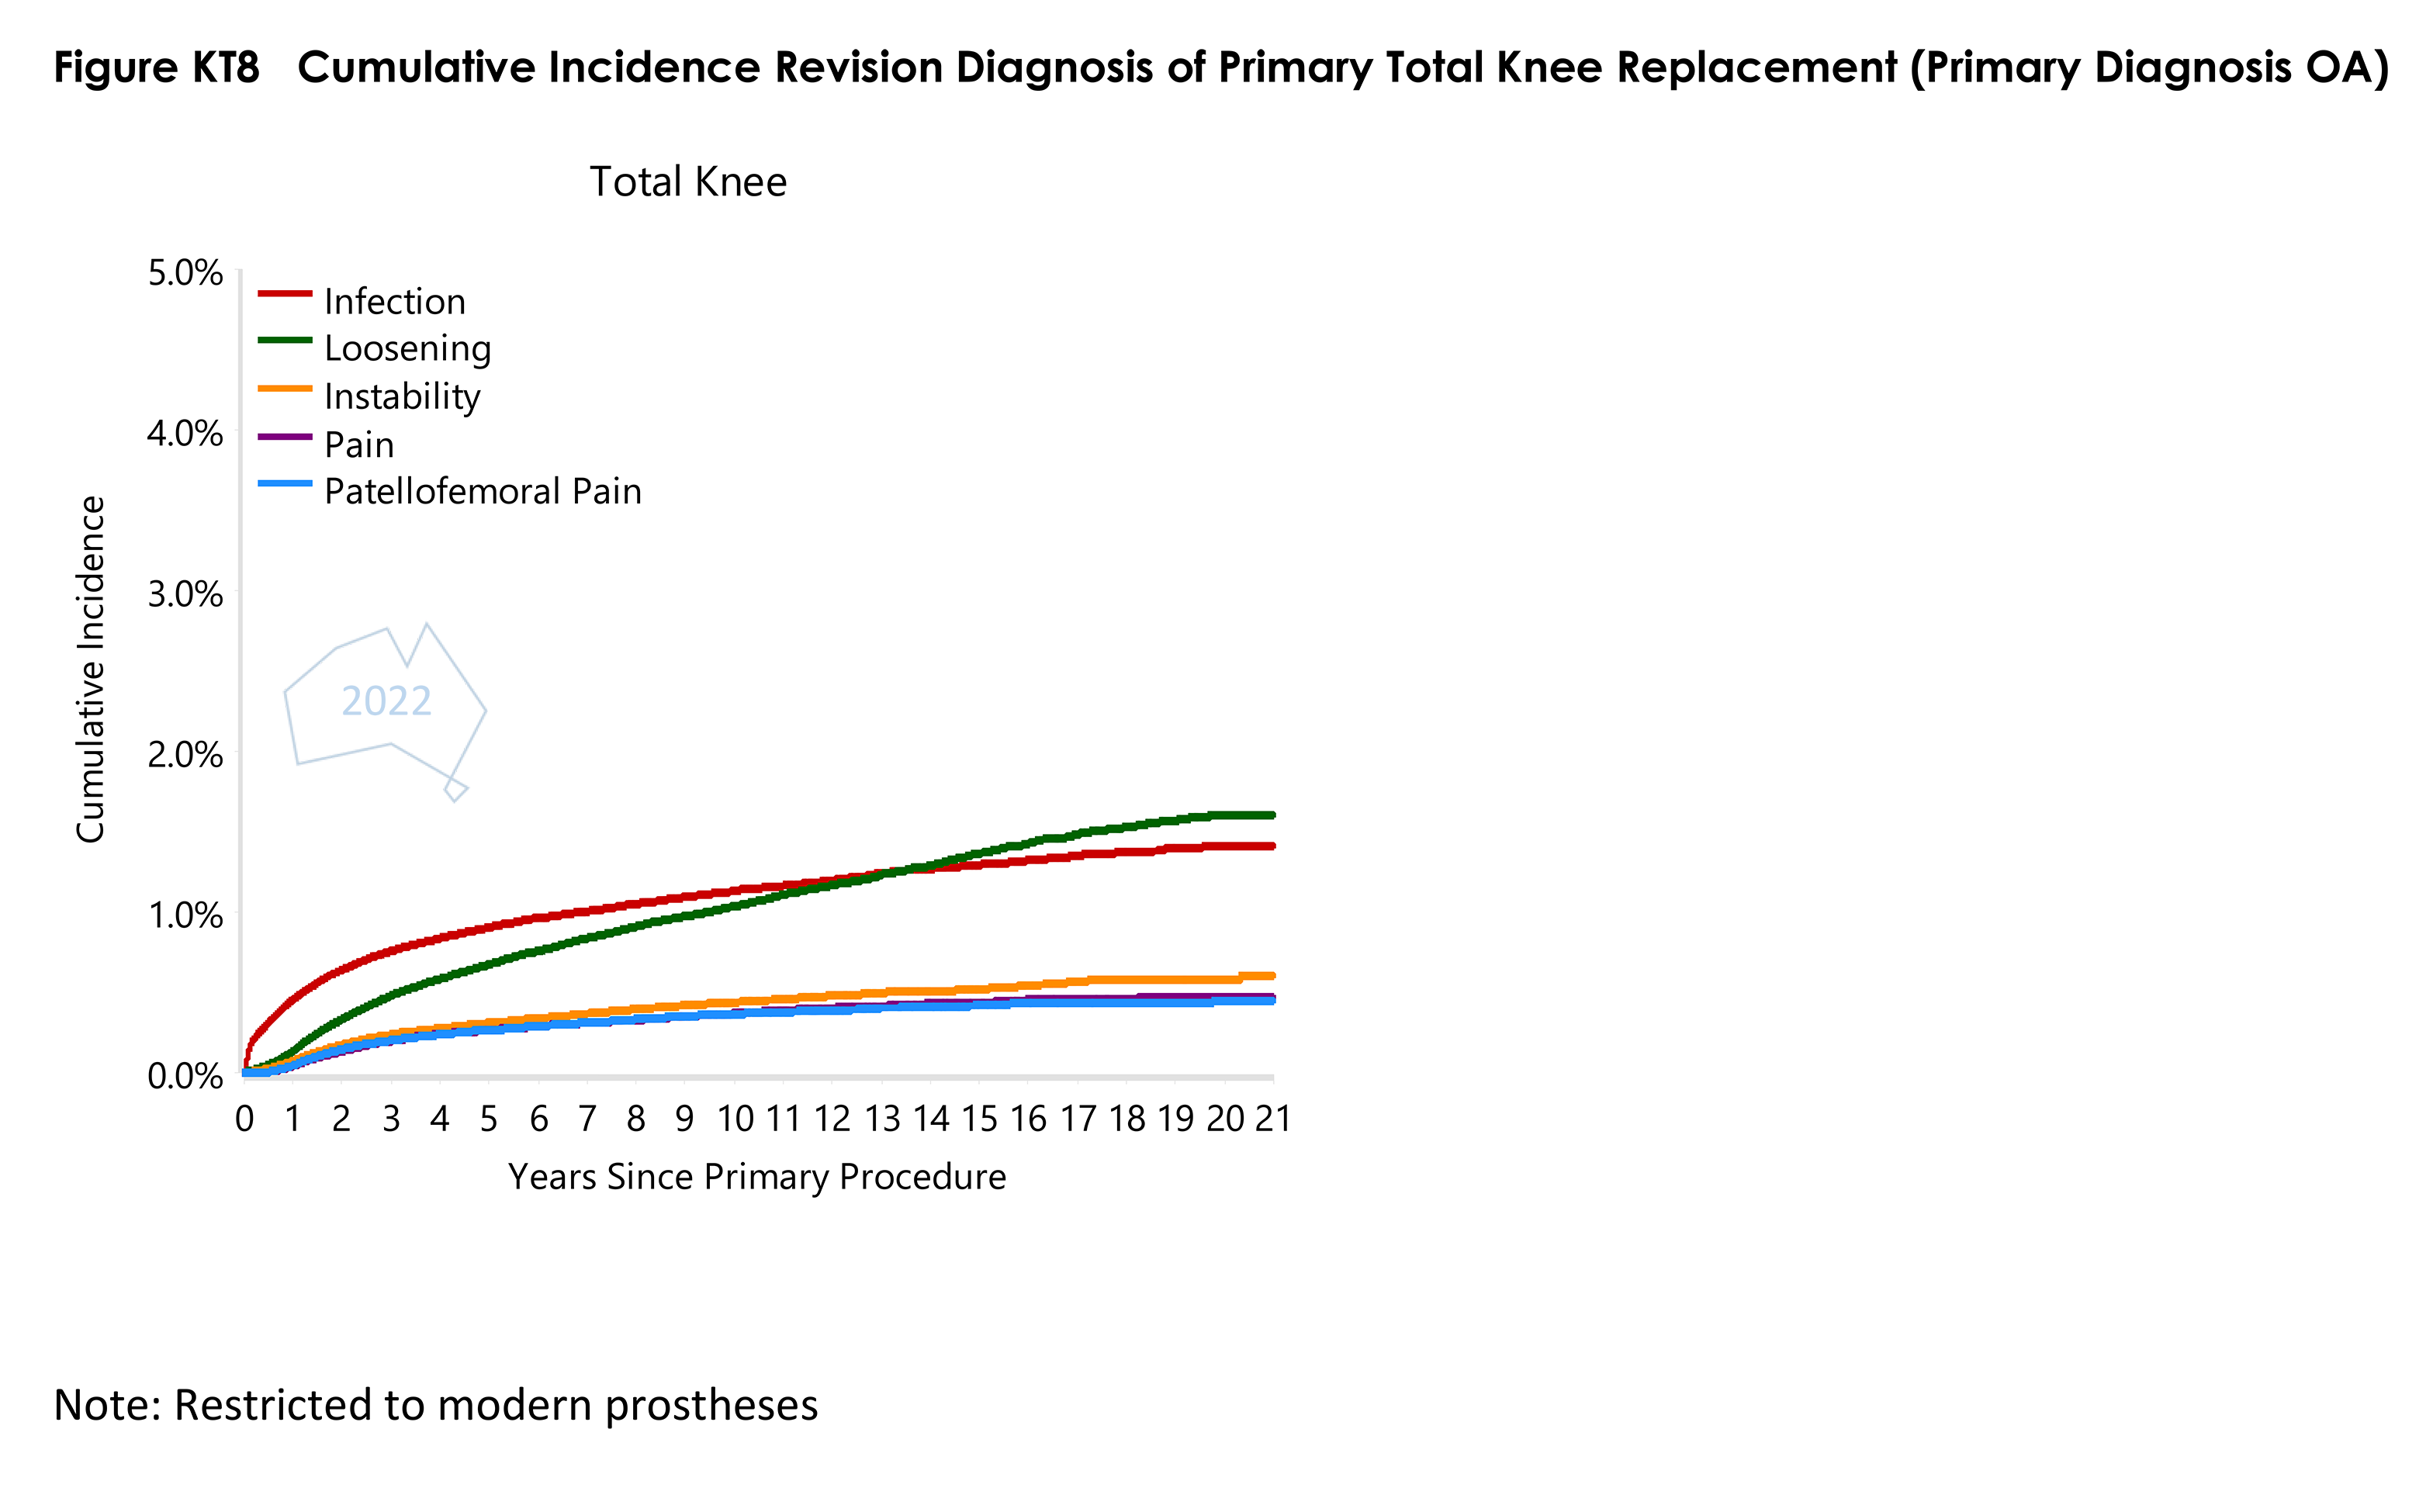
- Figure KT8 Cumulative Incidence Revision Diagnosis of Primary Total Knee ReplacementPDF · 250 KB
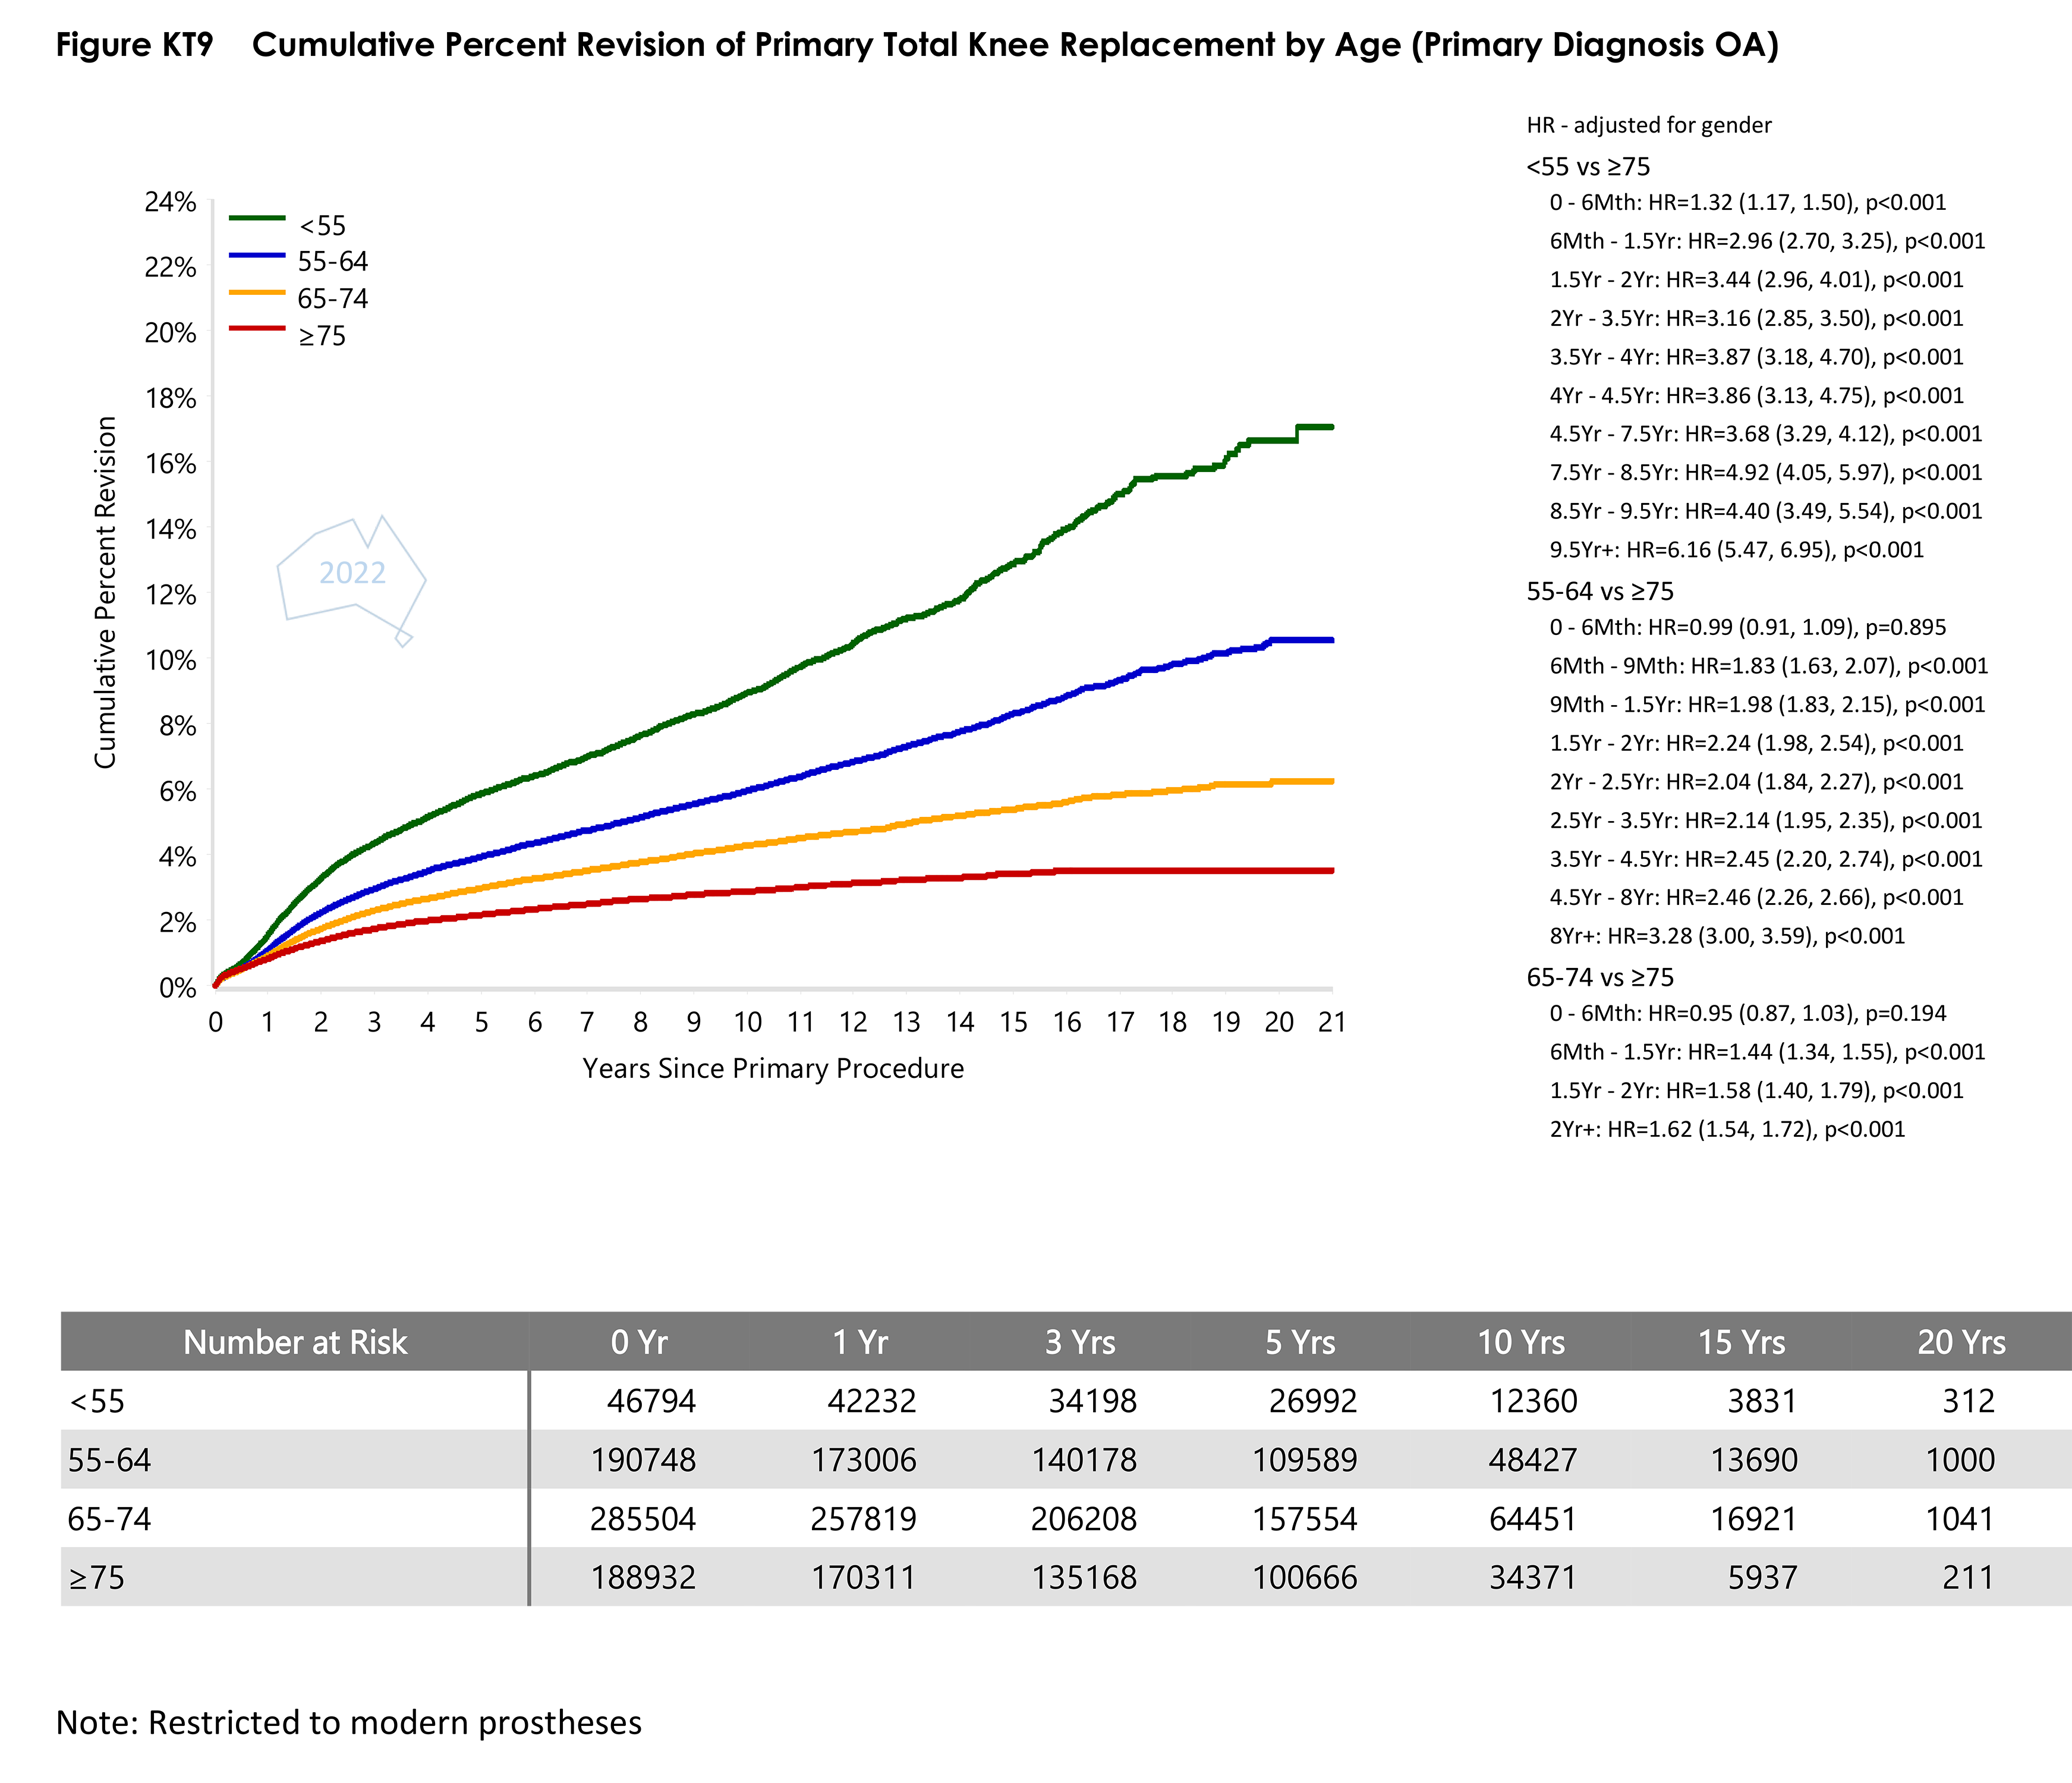
- Figure KT9 Cumulative Percent Revision of Primary Total Knee Replacement by AgePDF · 350 KB
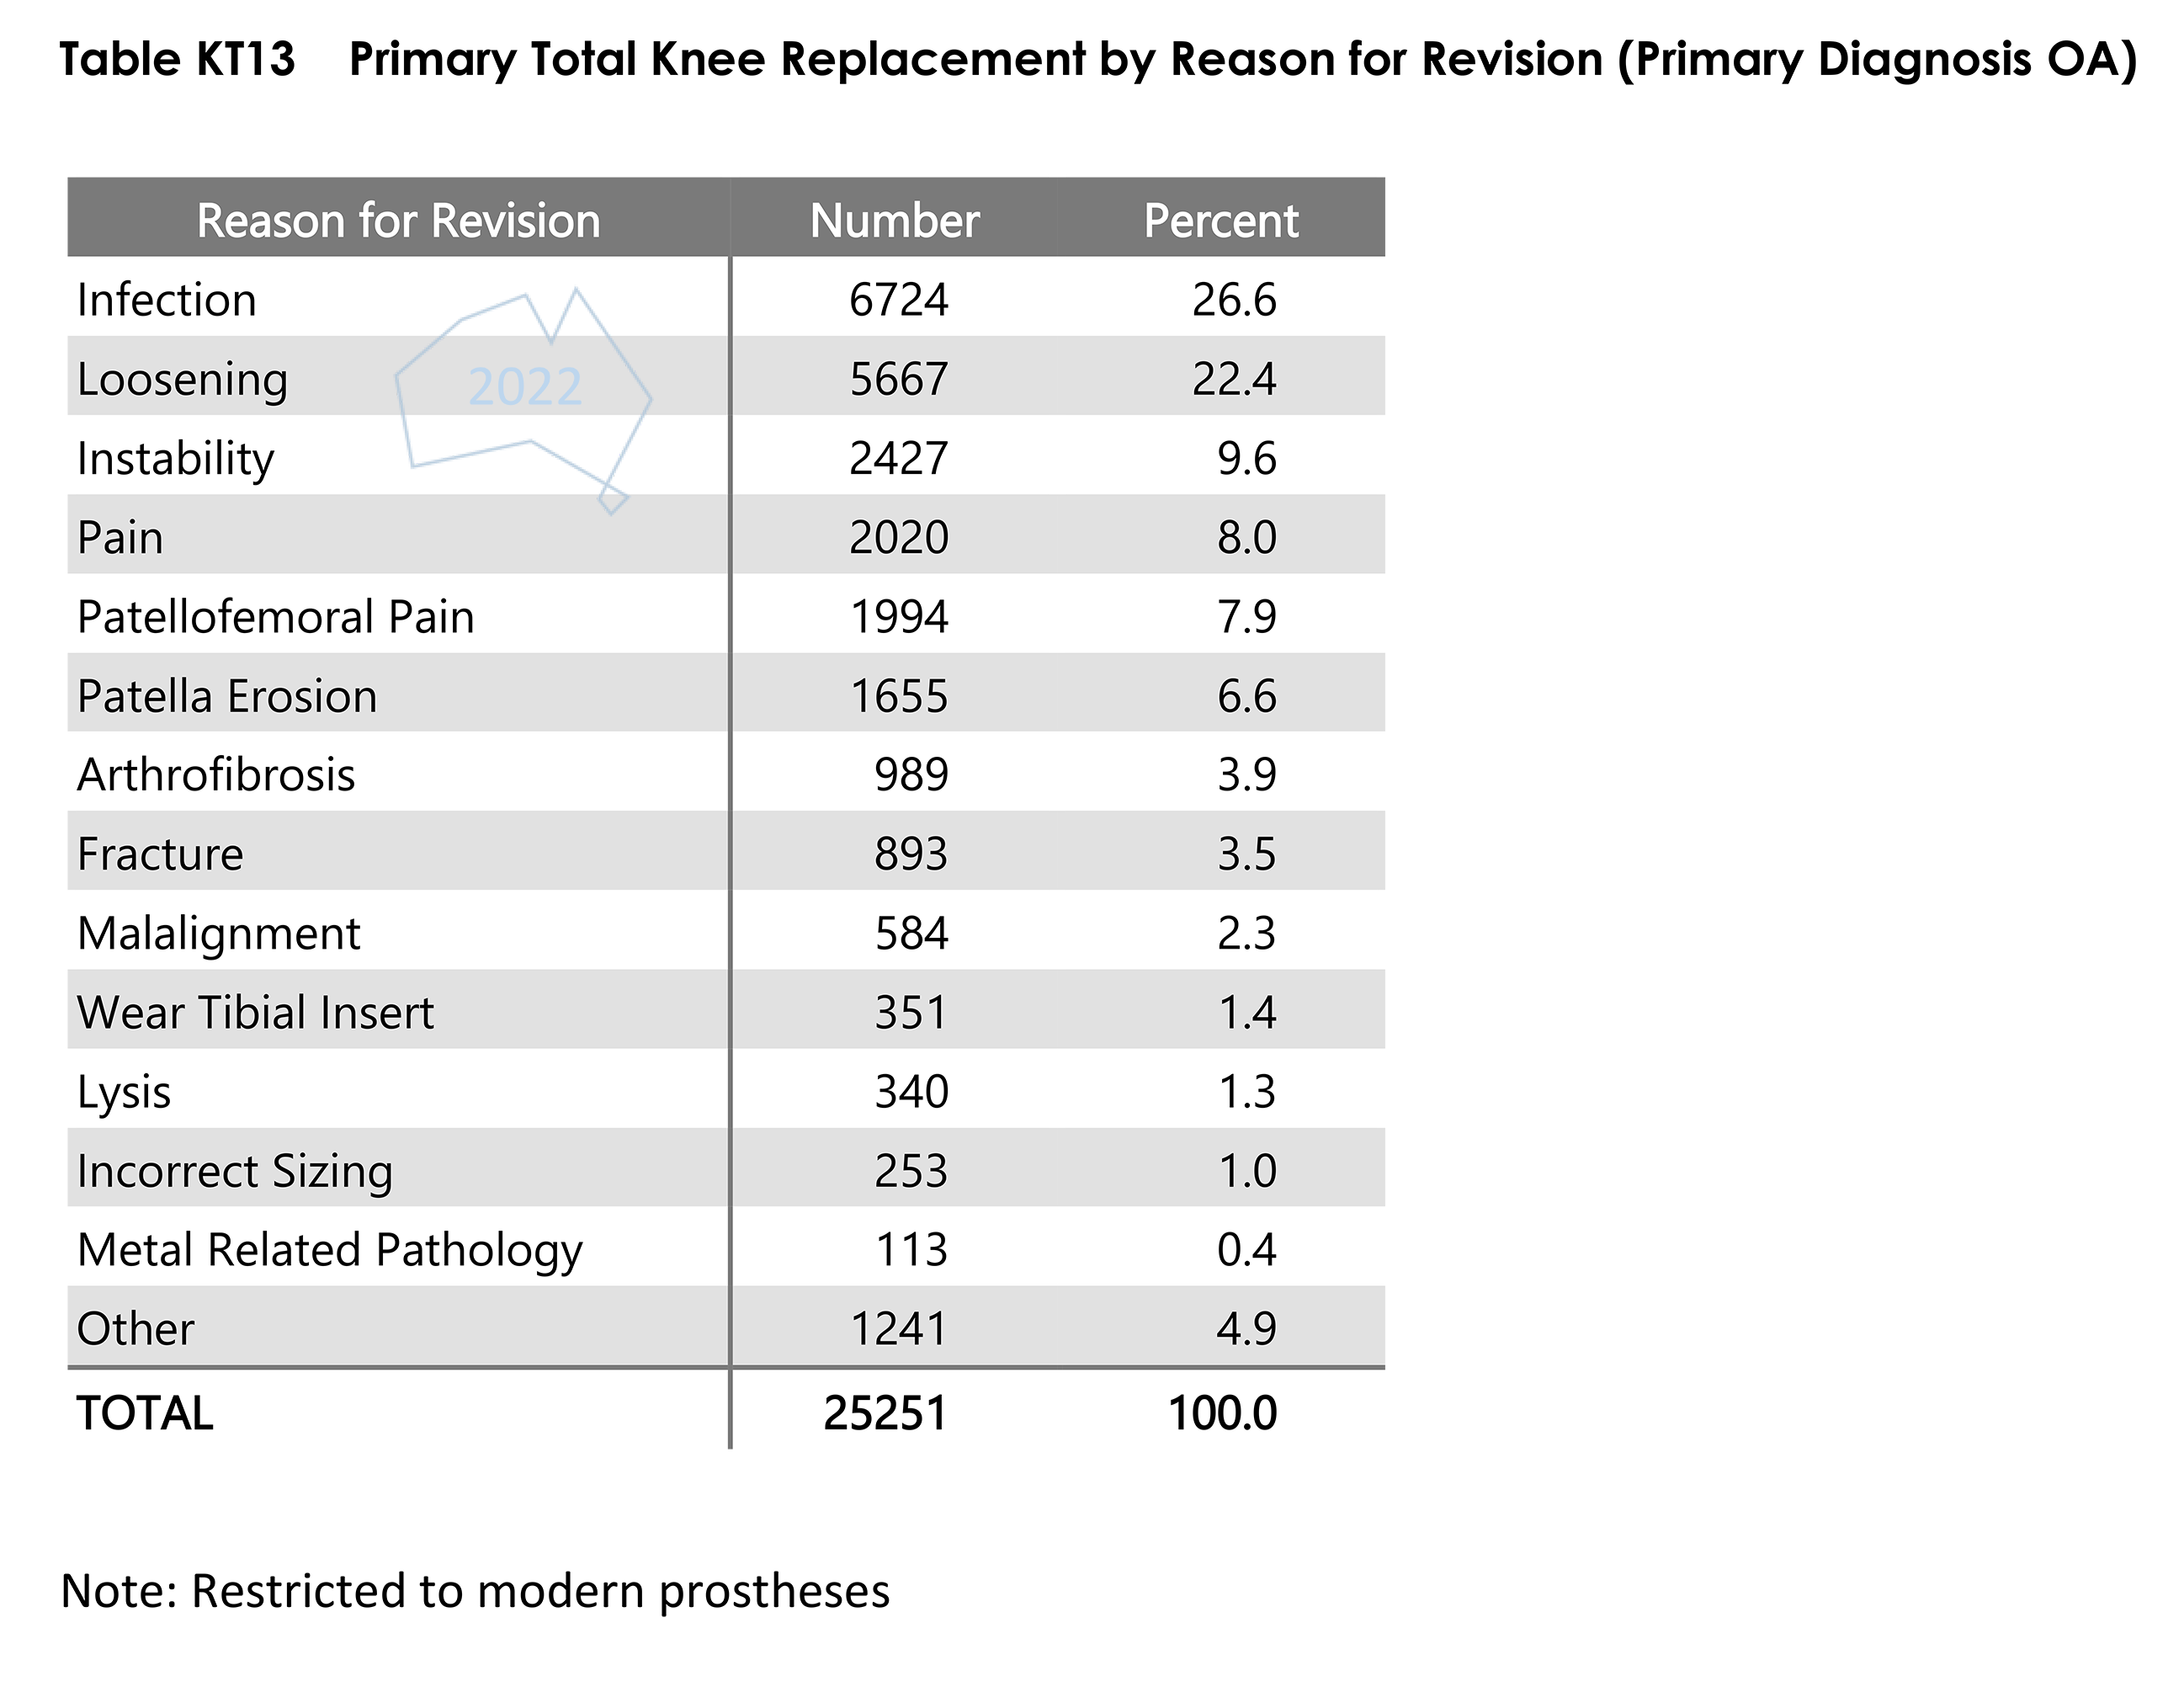
- Table KT13 Primary Total Knee Replacement by Reason for RevisionPDF · 77 KB
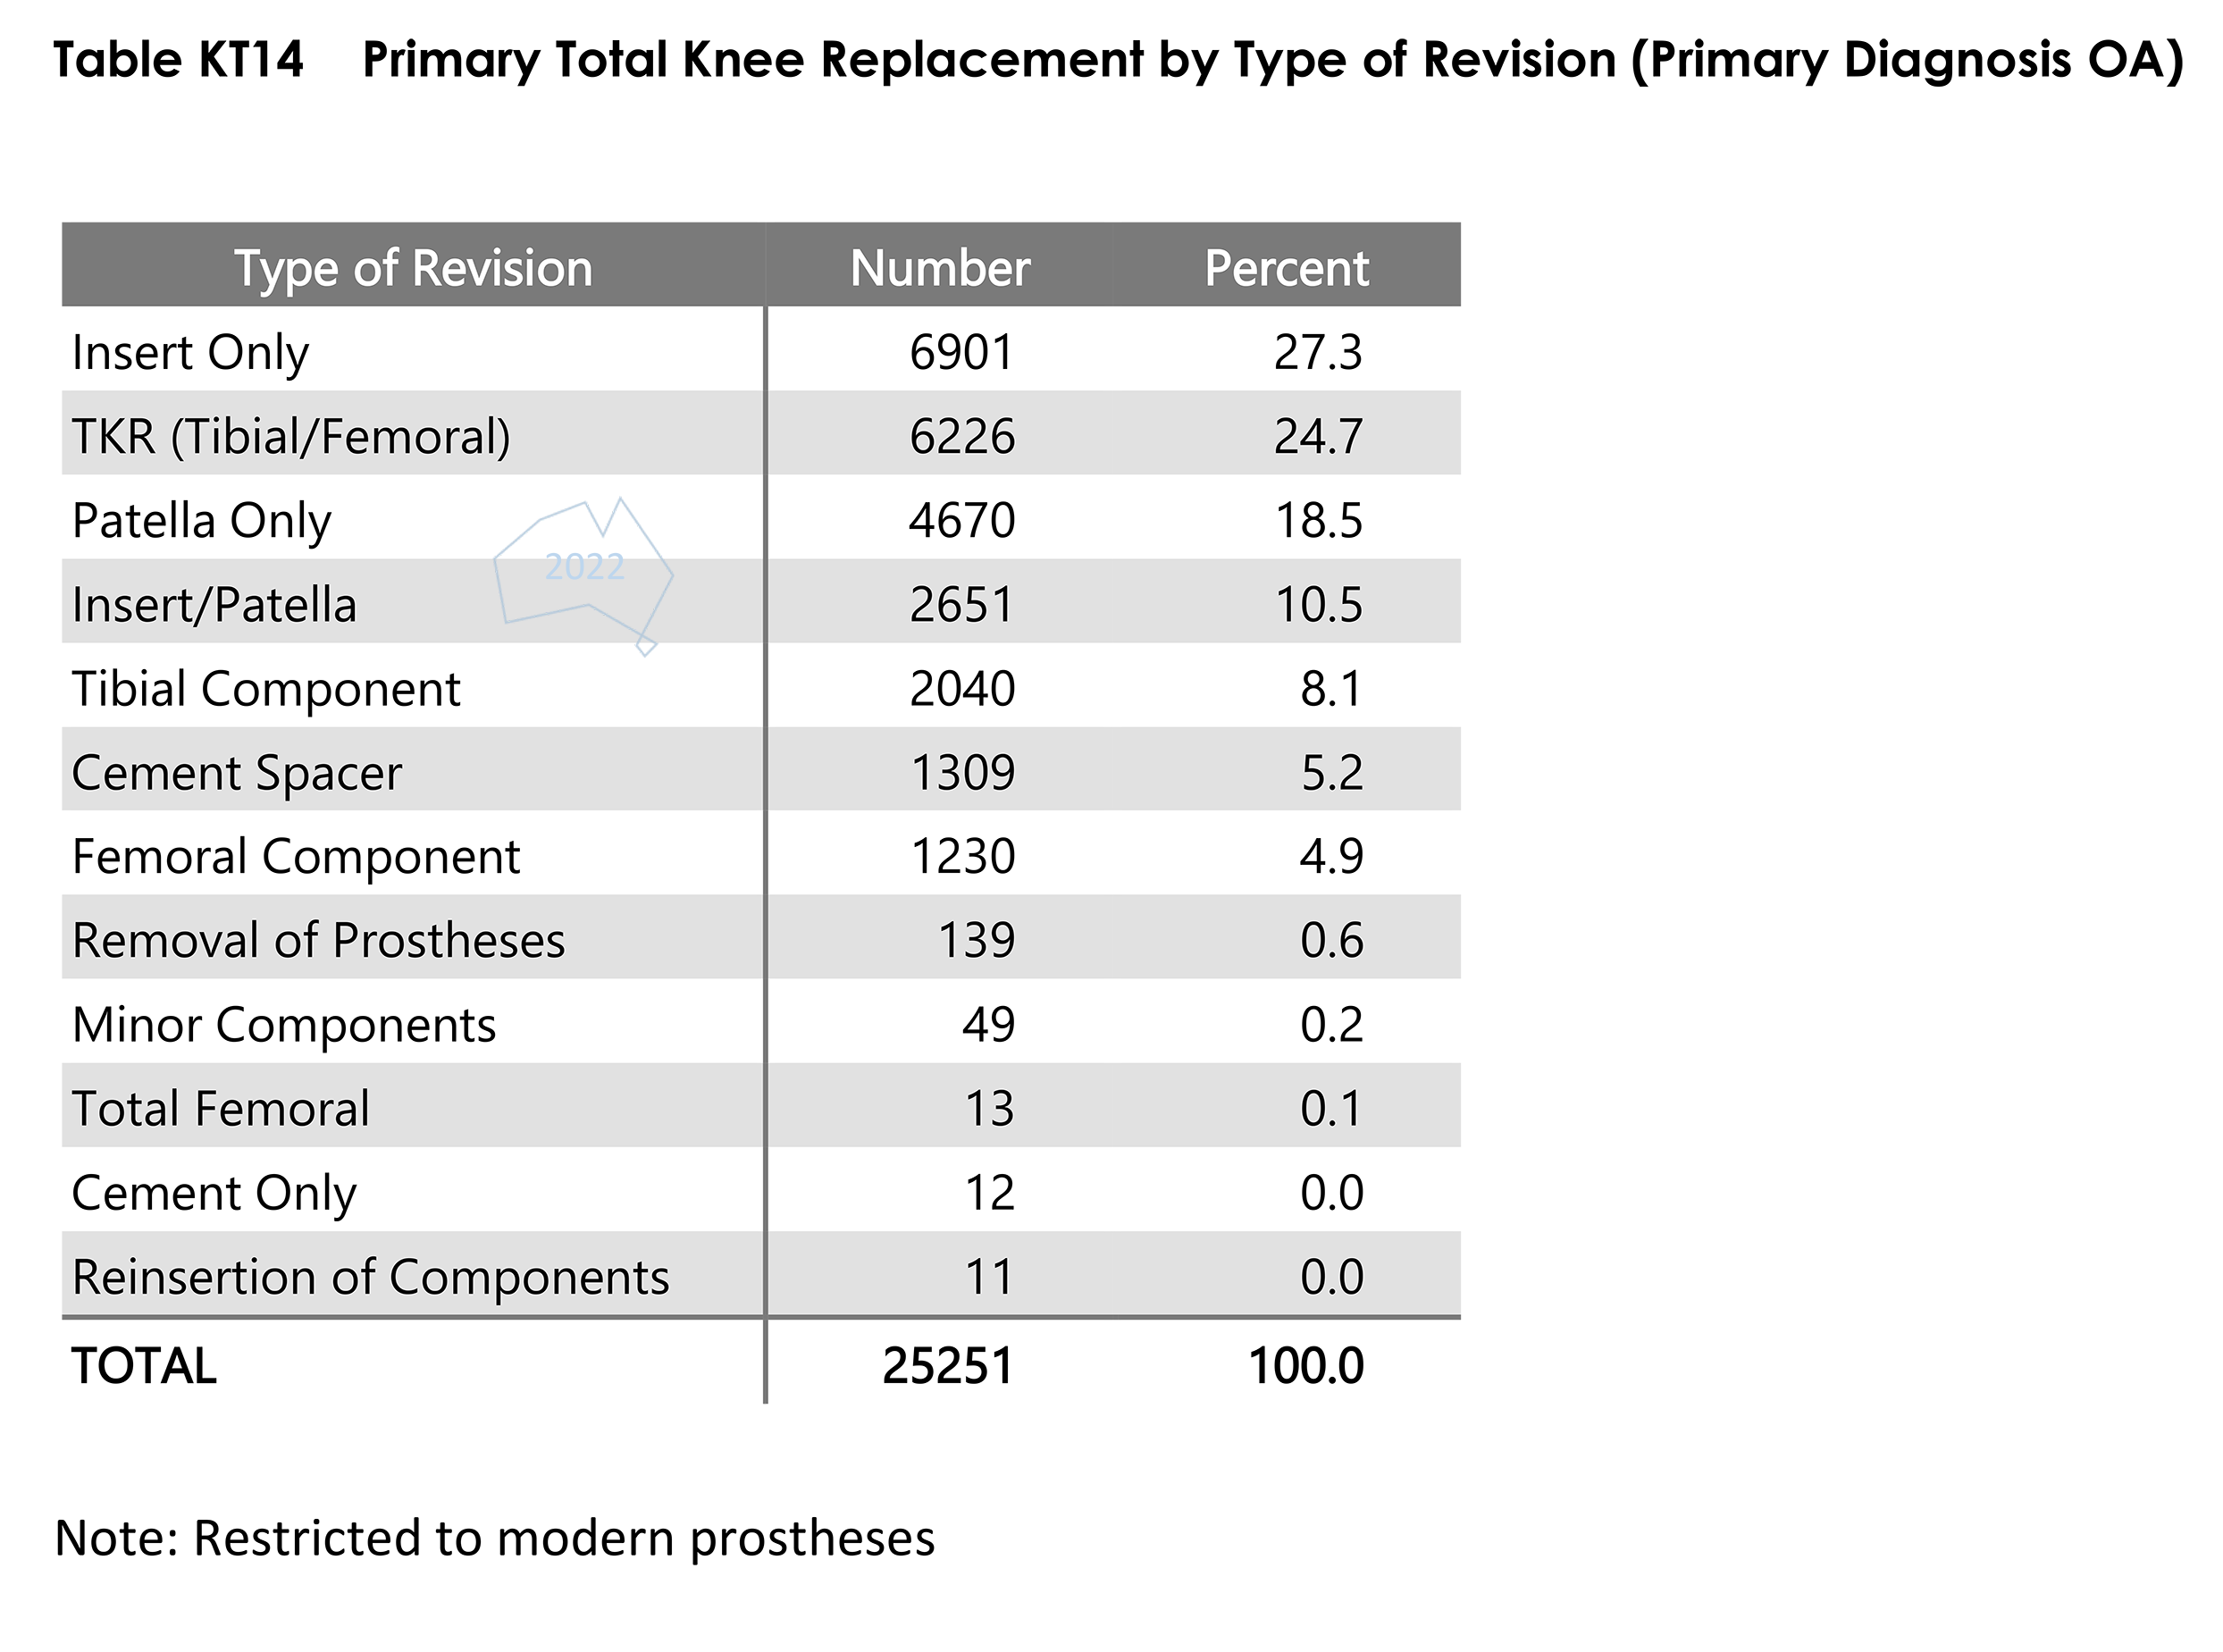
- Table KT14 Primary Total Knee Replacement by Type of RevisionPDF · 76 KB
PNG
- Figure KT10 Cumulative Percent Revision of Primary Total Knee Replacement by GenderPNG · 733 KB
- Figure KT11 Cumulative Incidence Revision Diagnosis of Primary Total Knee Replacement by Gender copyPNG · 676 KB
- Figure KT14 Cumulative Percent Revision of Primary Total Knee Replacement by ASA Score copyPNG · 878 KB
- Figure KT17 Cumulative Incidence Revision Diagnosis of Primary Total Knee Replacement by BMI Category-1 copyPNG · 1.7 MB
- Figure KT31 Cumulative Percent Revision of Primary Total Knee Replacement by Bearing Mobility copyPNG · 697 KB
- Figure KT34 Cumulative Percent Revision of Primary Total Knee Replacement by Stability copyPNG · 906 KB
- Figure KT45 Cumulative Percent Revision of Primary Total Knee Replacement by Patella Usage copyPNG · 719 KB
- Figure KT46 Cumulative Percent Revision of Primary Total Knee Replacement by Stability and Patella Usage copyPNG · 1.2 MB
- Figure KT47 Cumulative Percent Revision of Primary Total Knee Replacement by Stability and Patella Usage copyPNG · 1.0 MB
- Figure KT50 Cumulative Percent Revision of Minimally Stabilised Primary Total Knee Replacement by Fixation copyPNG · 853 KB
- Figure KT52 Cumulative Percent Revision of Medial Pivot Design Primary Total Knee Replacement by Fixation copyPNG · 695 KB
- Figure KT53 Cumulative Percent Revision of Primary Total Knee Replacement by Polyethylene Type copyPNG · 773 KB
- Figure KT54 Cumulative Incidence Revision Diagnosis of Primary Total Knee Replacement by Polyethylene Type copyPNG · 698 KB
- Figure KT56 Cumulative Percent Revision of XLPE Primary Total Knee Replacement by Polyethylene Type copyPNG · 589 KB
- Figure KT6 Cumulative Percent Revision of Primary Total Knee Replacement by Primary Diagnosis copyPNG · 875 KB
- Figure KT63 Cumulative Percent Revision of Primary Total Knee Replacement by Computer Navigation and Age copyPNG · 980 KB
- Figure KT64 Cumulative Percent Revision of Primary Total Knee Replacement since 2009 by IDI Usage copyPNG · 659 KB
- Figure KT7 Cumulative Percent Revision of Primary Total Knee Replacement-1 copyPNG · 450 KB
- Figure KT8 Cumulative Incidence Revision Diagnosis of Primary Total Knee Replacement copyPNG · 460 KB
- Figure KT9 Cumulative Percent Revision of Primary Total Knee Replacement by Age copyPNG · 1.3 MB
- Table KT13 Primary Total Knee Replacement by Reason for Revision copyPNG · 557 KB
- Table KT14 Primary Total Knee Replacement by Type of Revision copyPNG · 523 KB
Shoulders
All Shoulders
All Shoulders
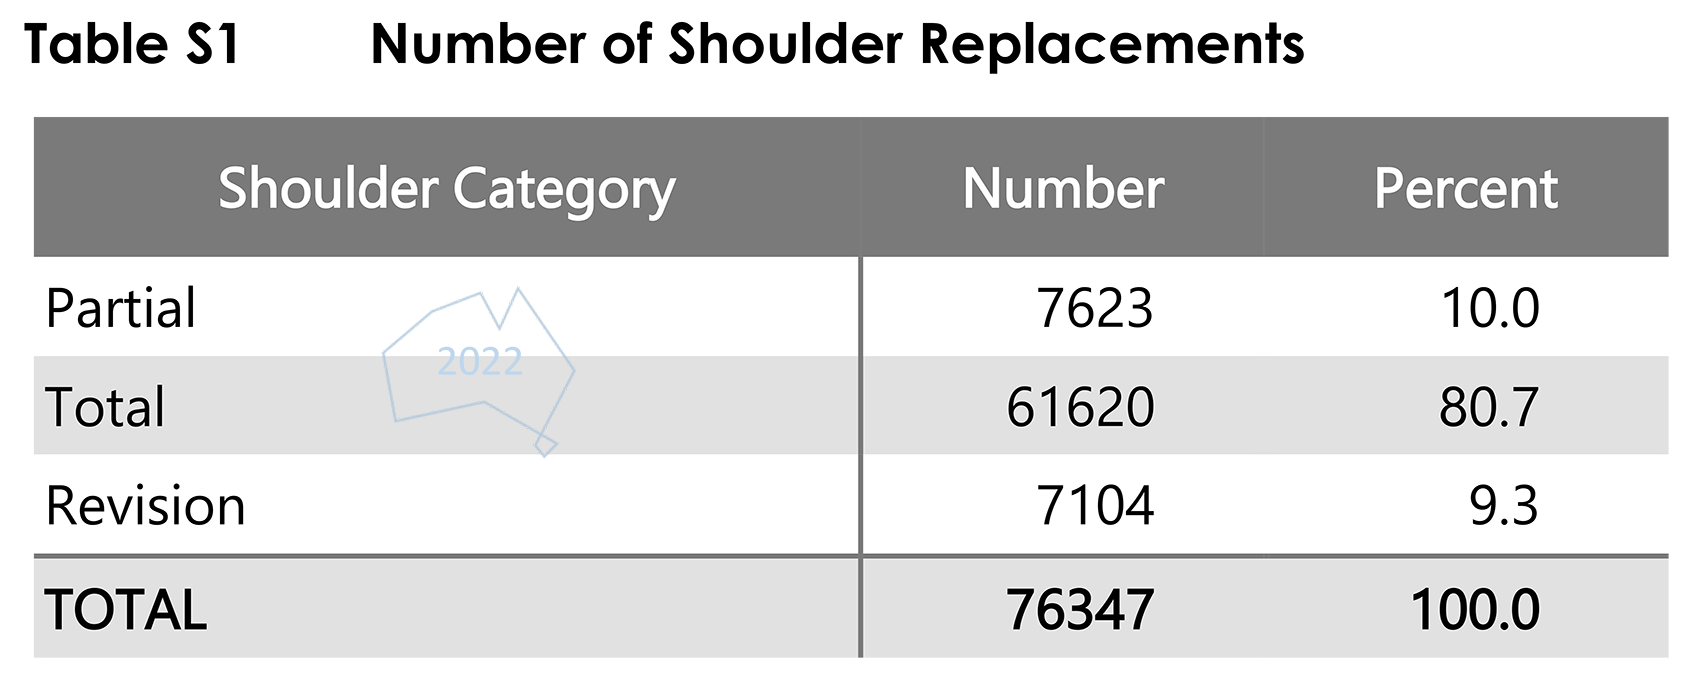
- Number of Shoulder ReplacementsPDF · 71 KB
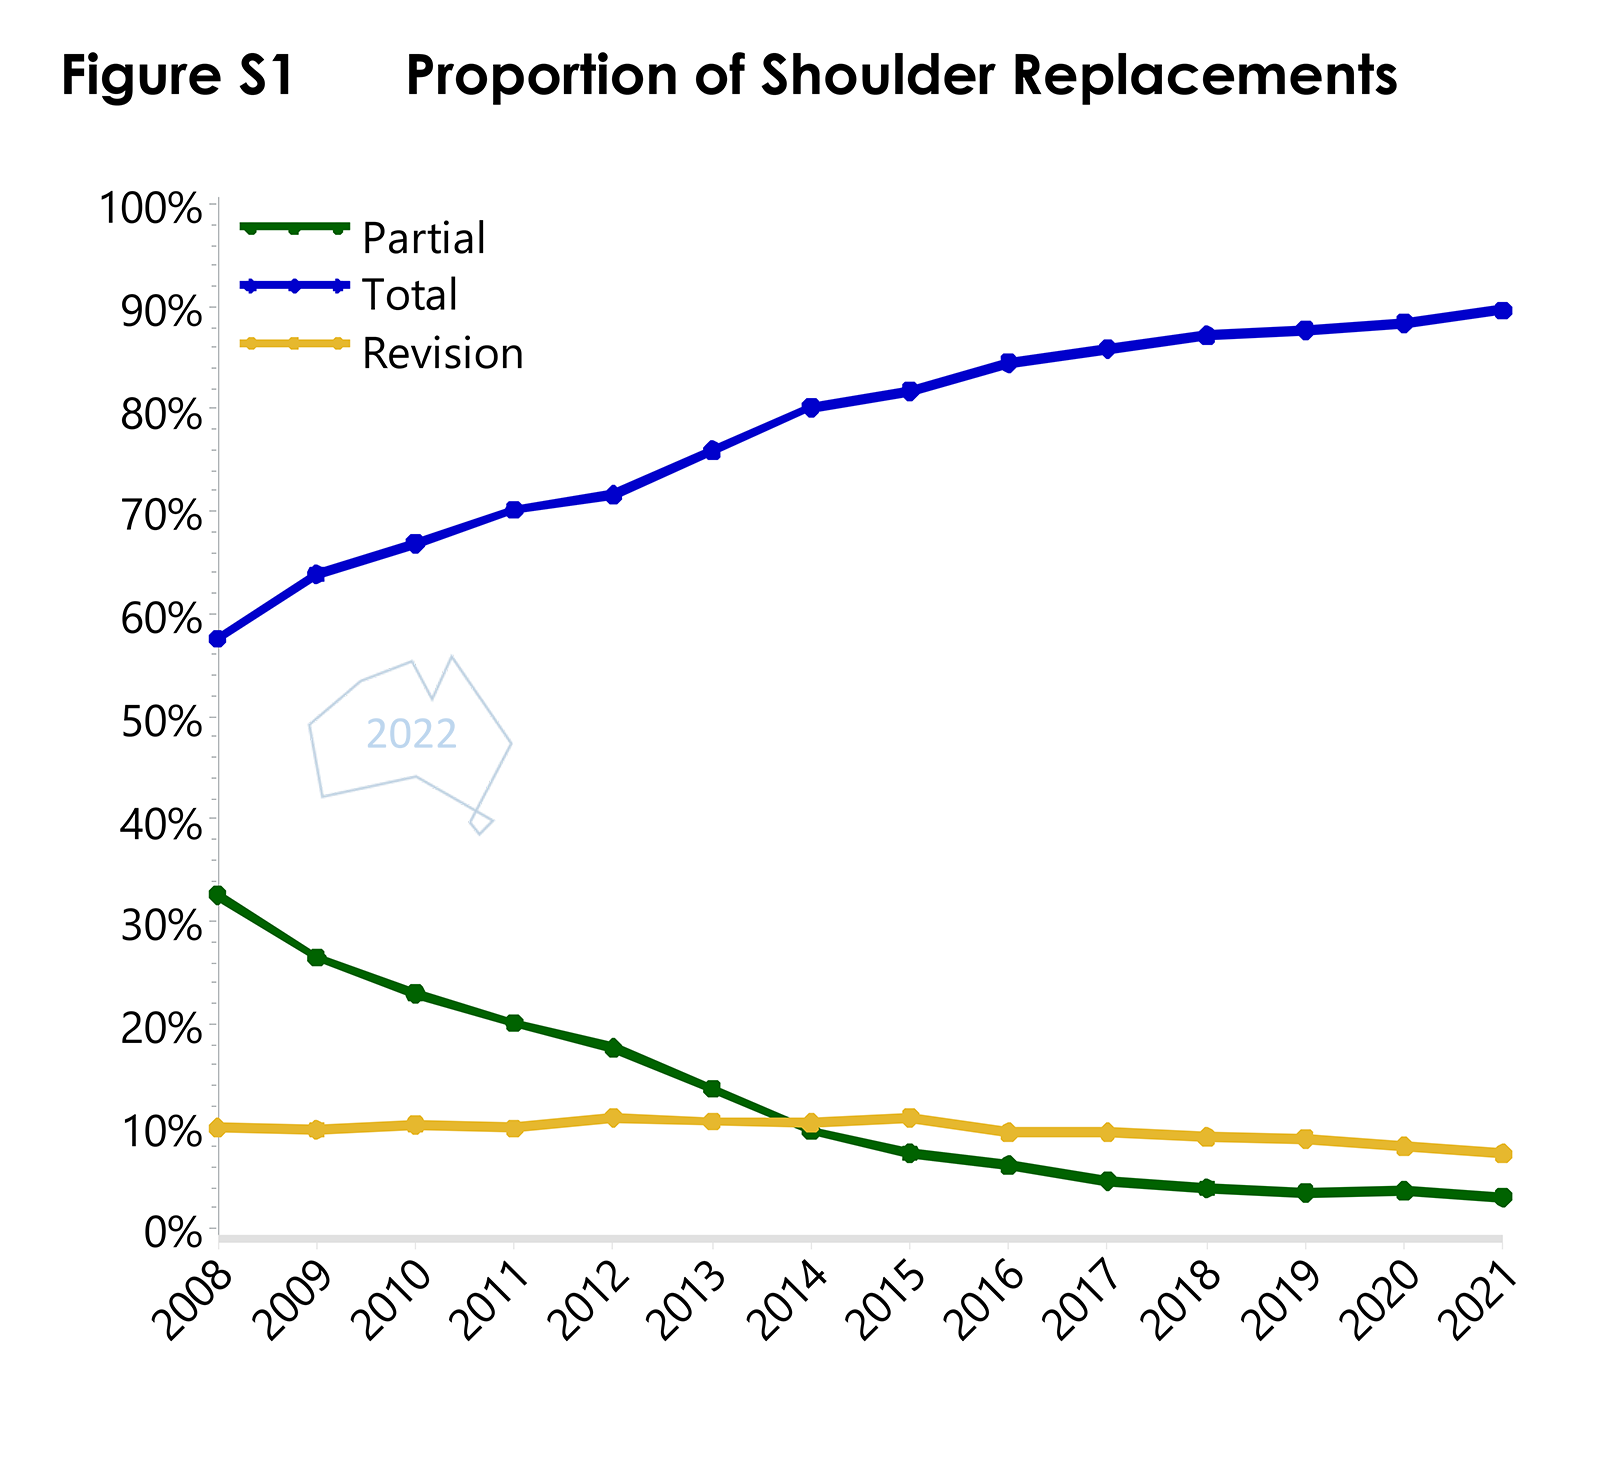
- Proportion of Shoulder ReplacementsPDF · 62 KB
PNG
- Number of Shoulder ReplacementsPNG · 189 KB
- Proportion of Shoulder Replacements copyPNG · 339 KB
Partial Shoulders
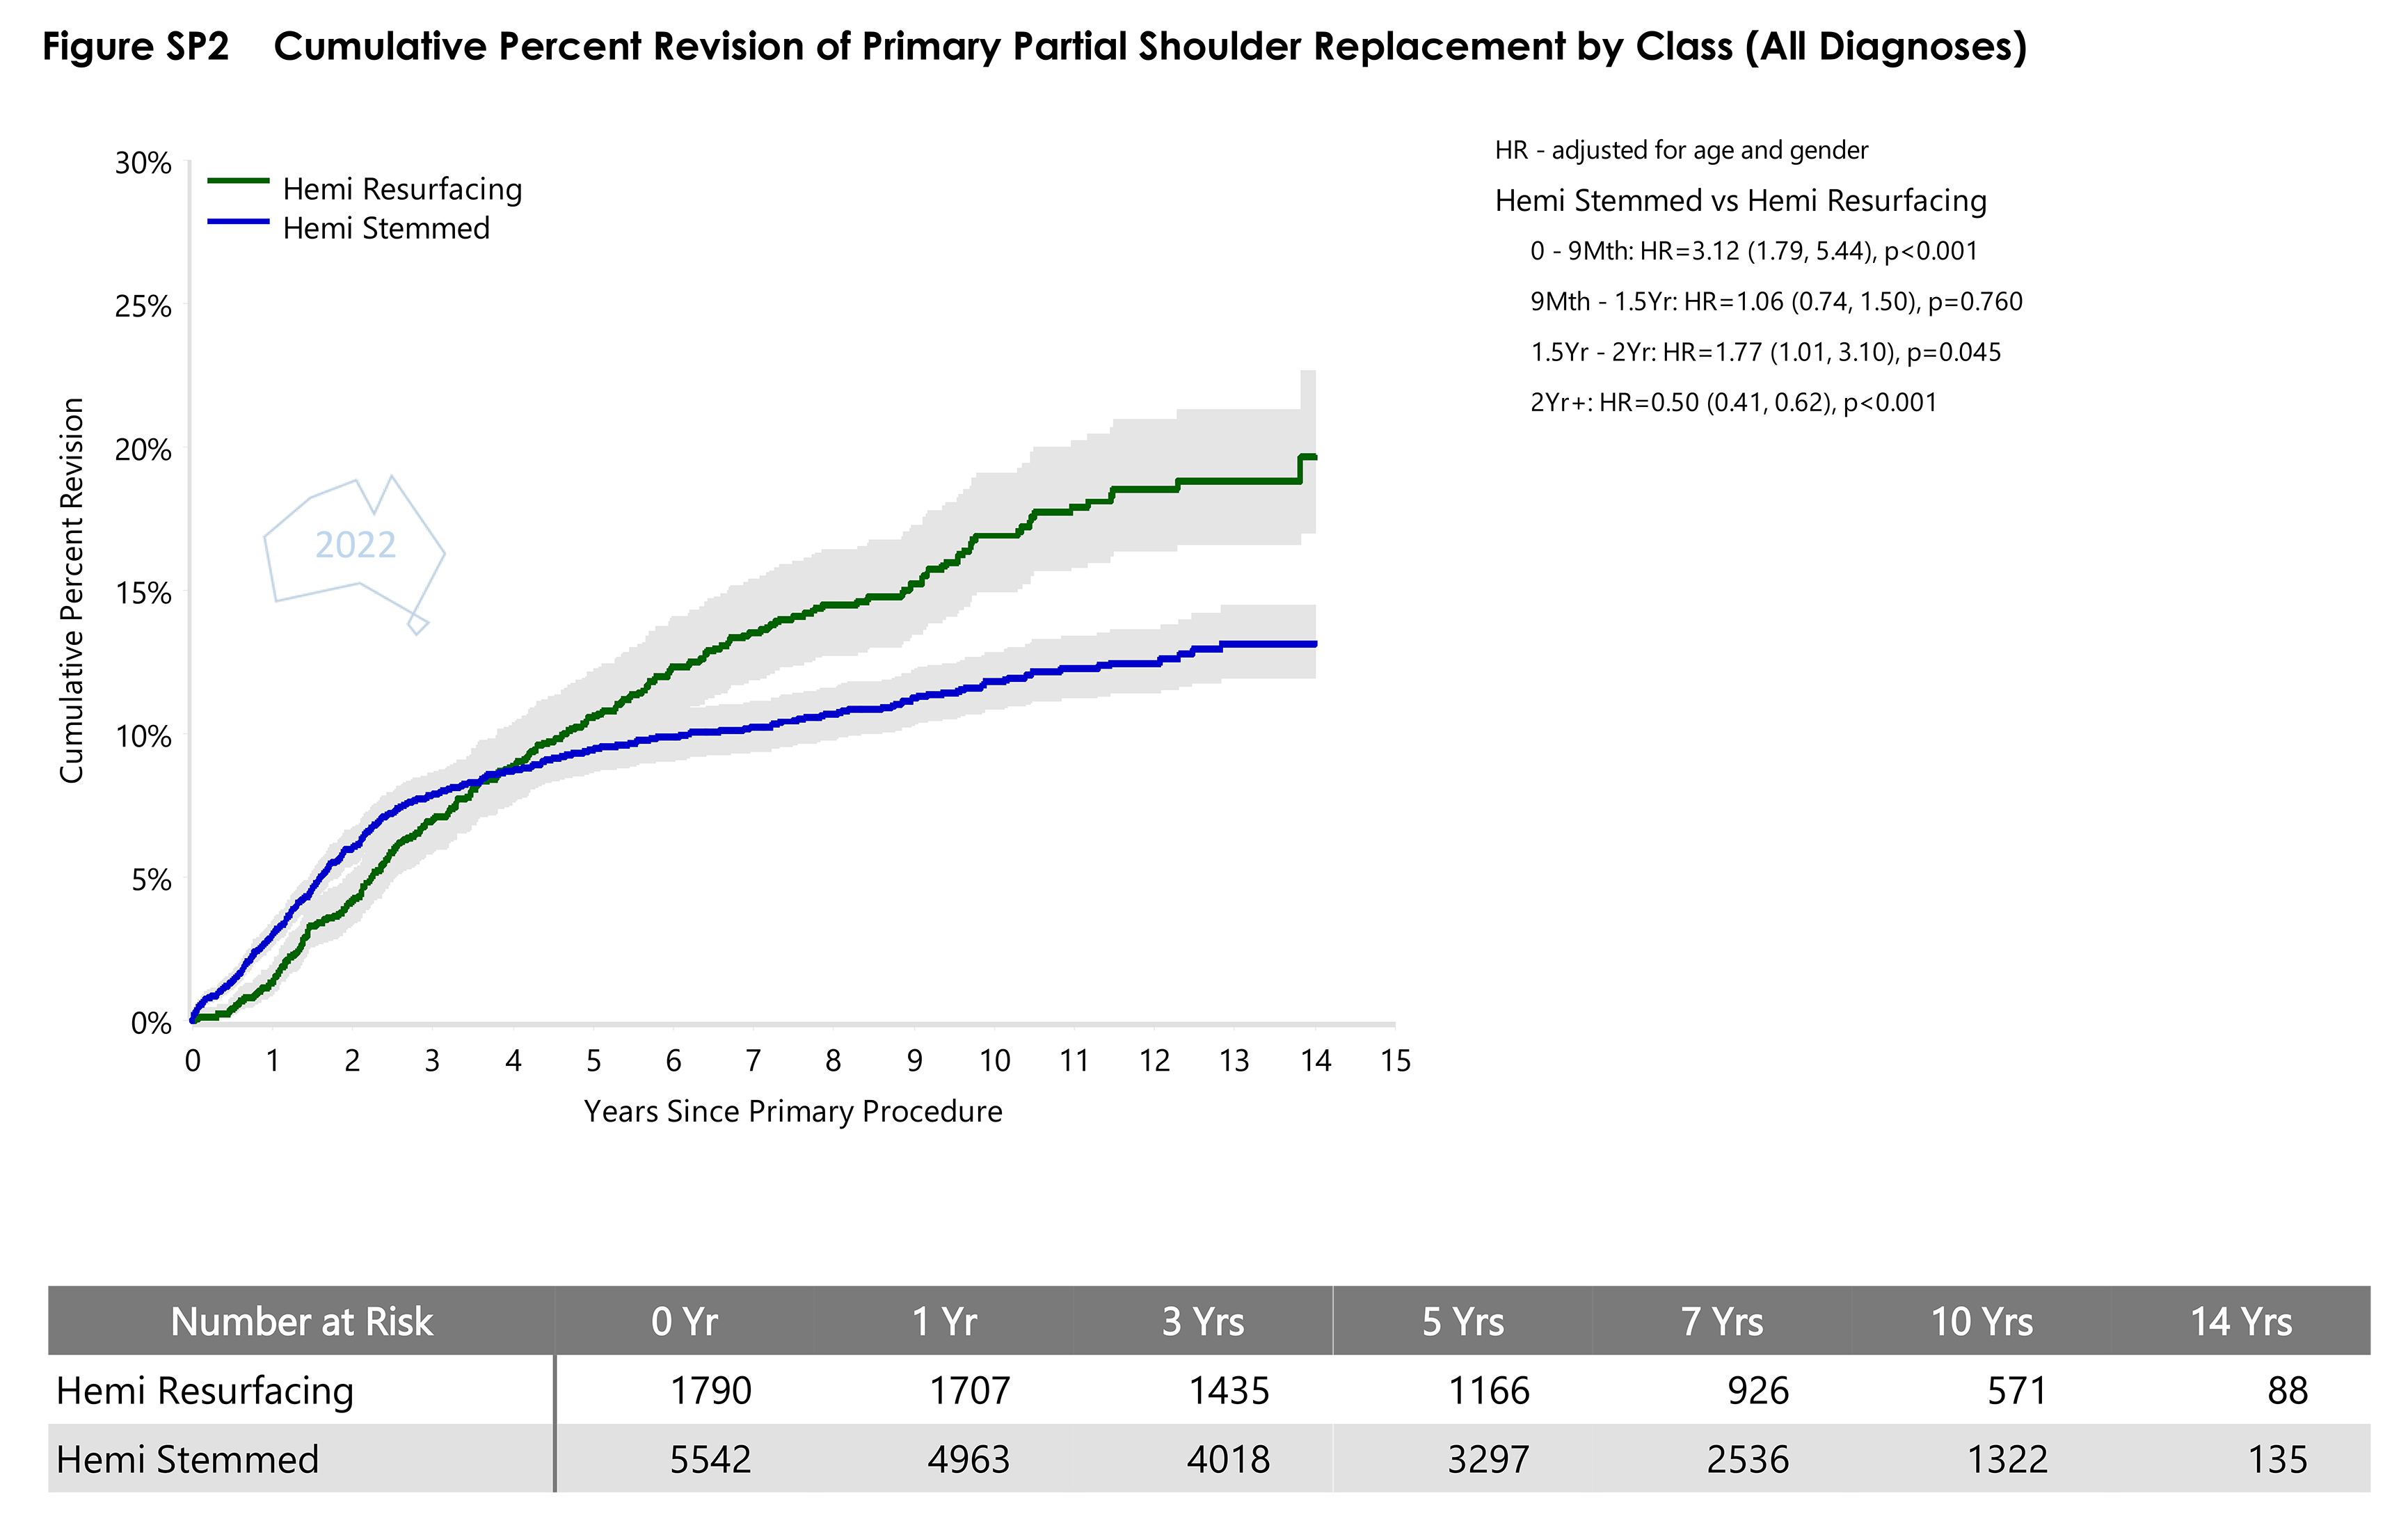
- Figure SP2 Cumulative Percent Revision of Primary Partial Shoulder Replacement by ClassPDF · 107 KB
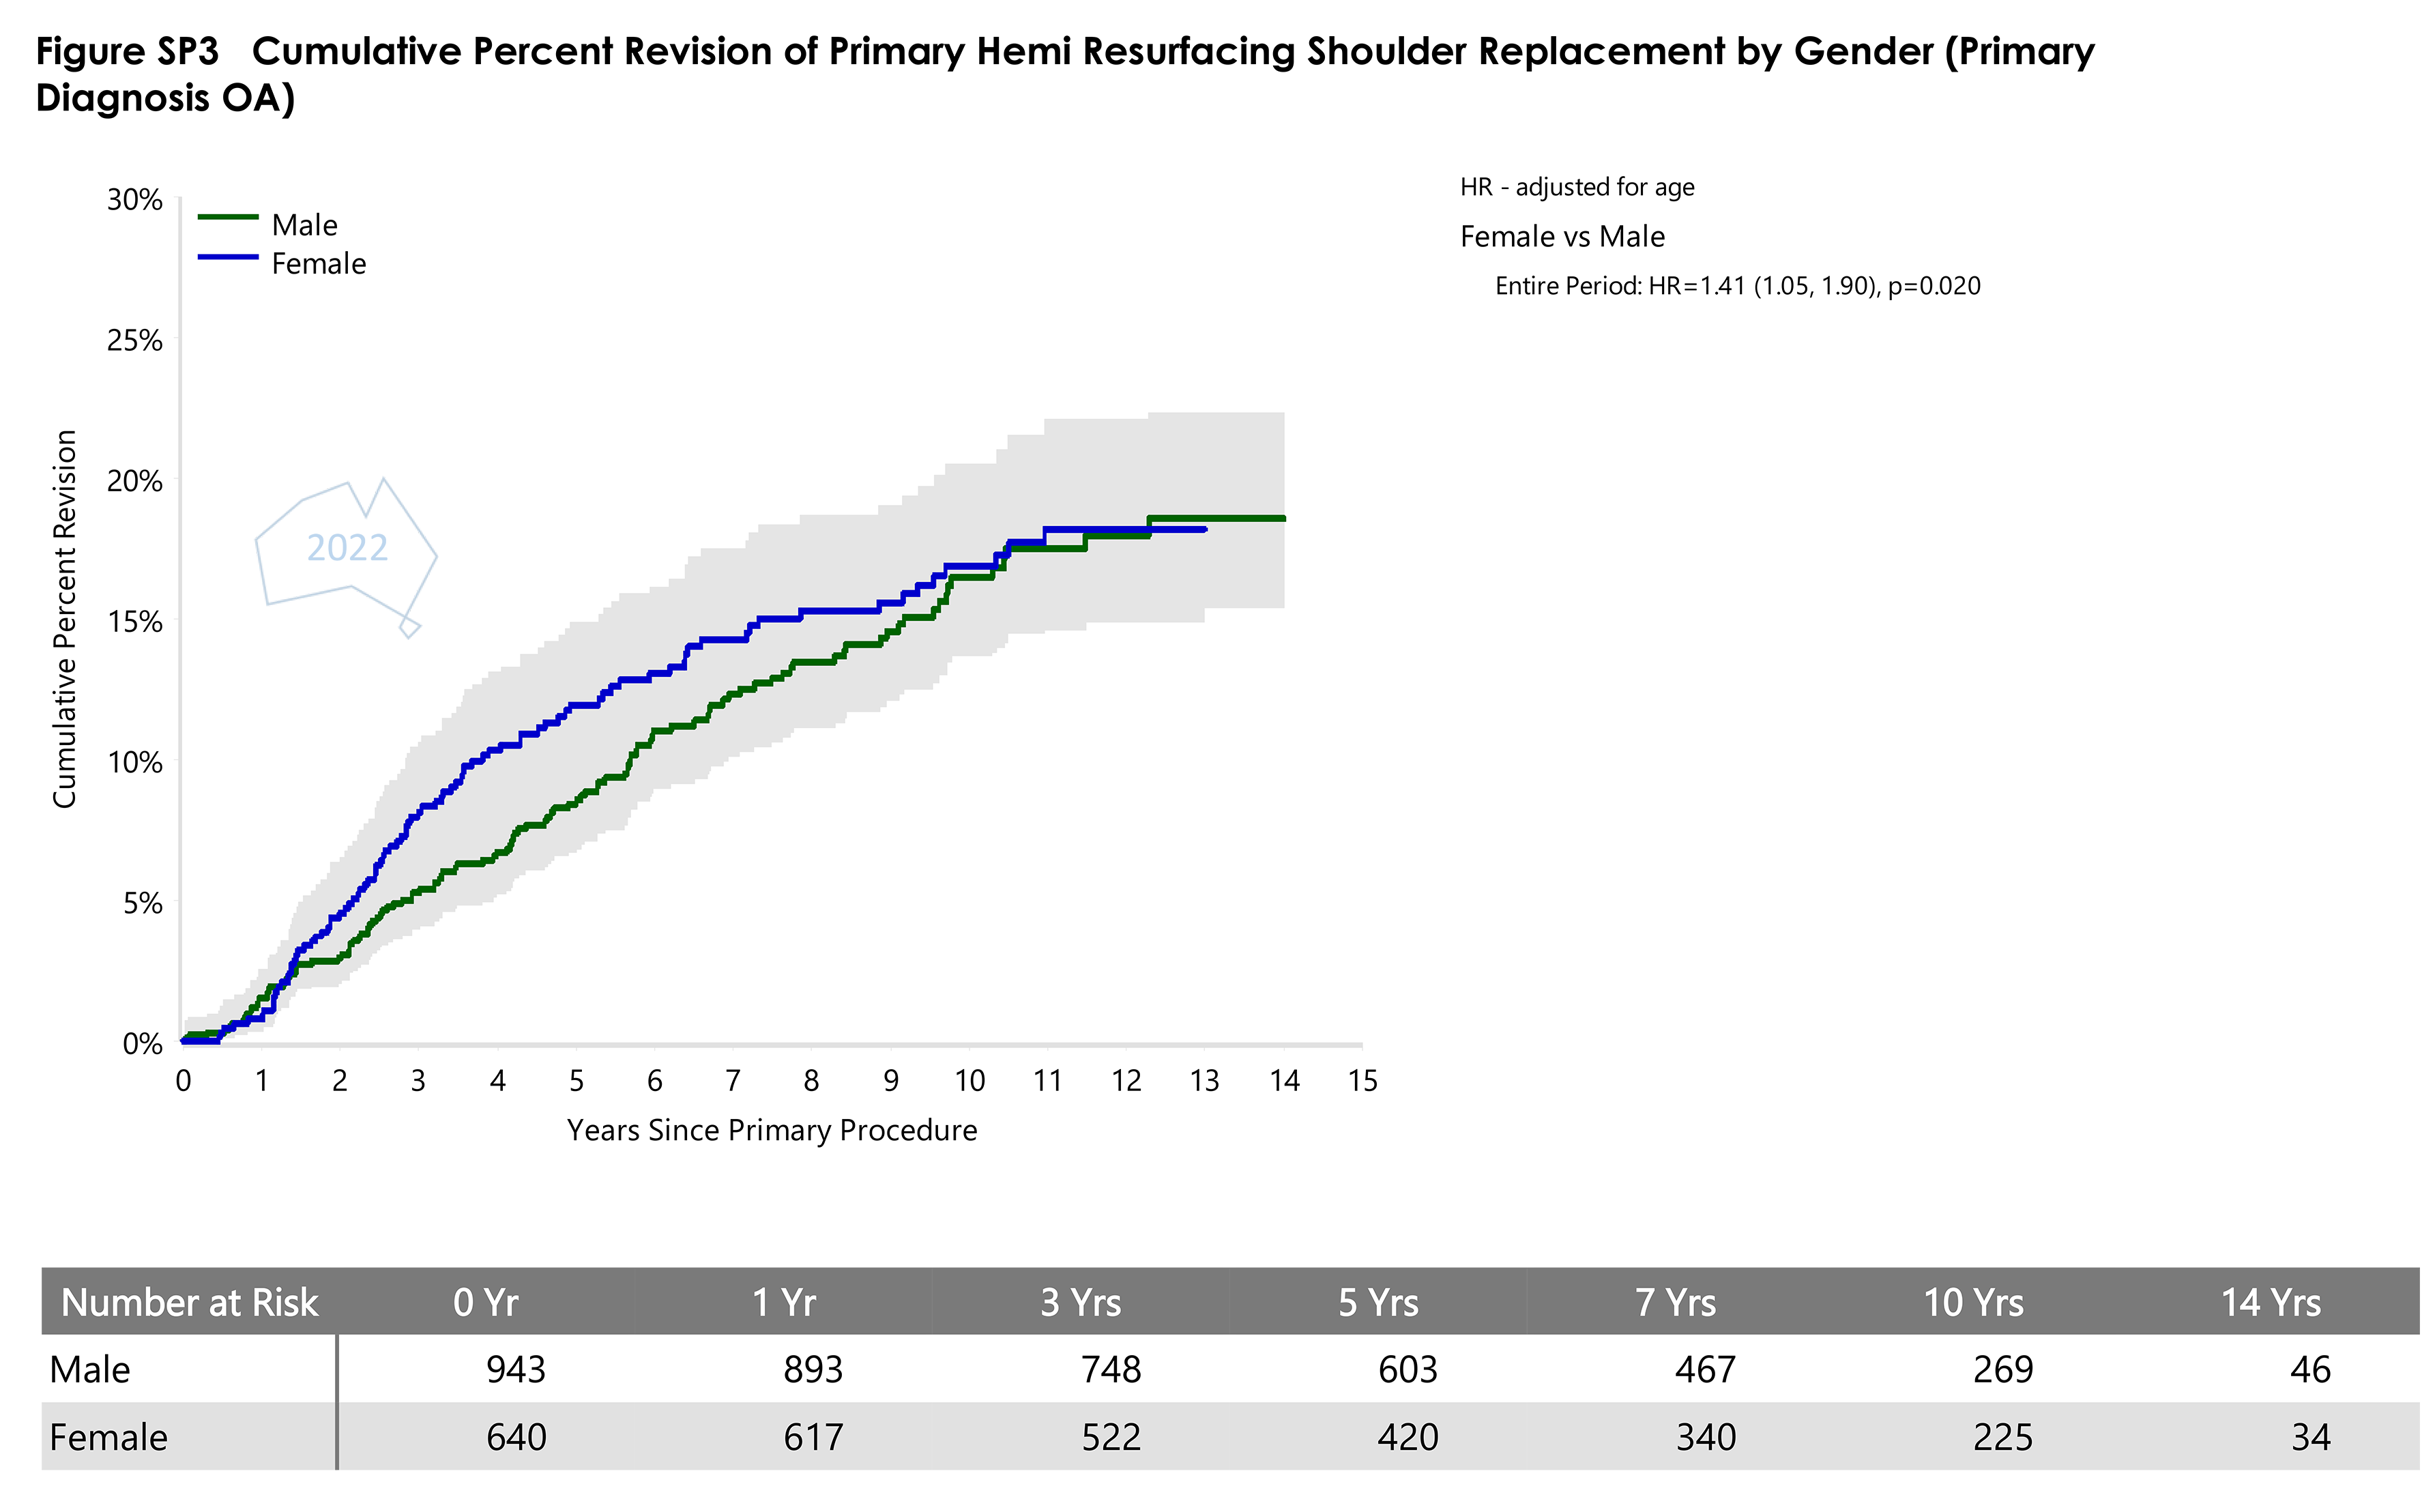
- Figure SP3 Cumulative Percent Revision of Primary Hemi Resurfacing Shoulder Replacement by GenderPDF · 85 KB
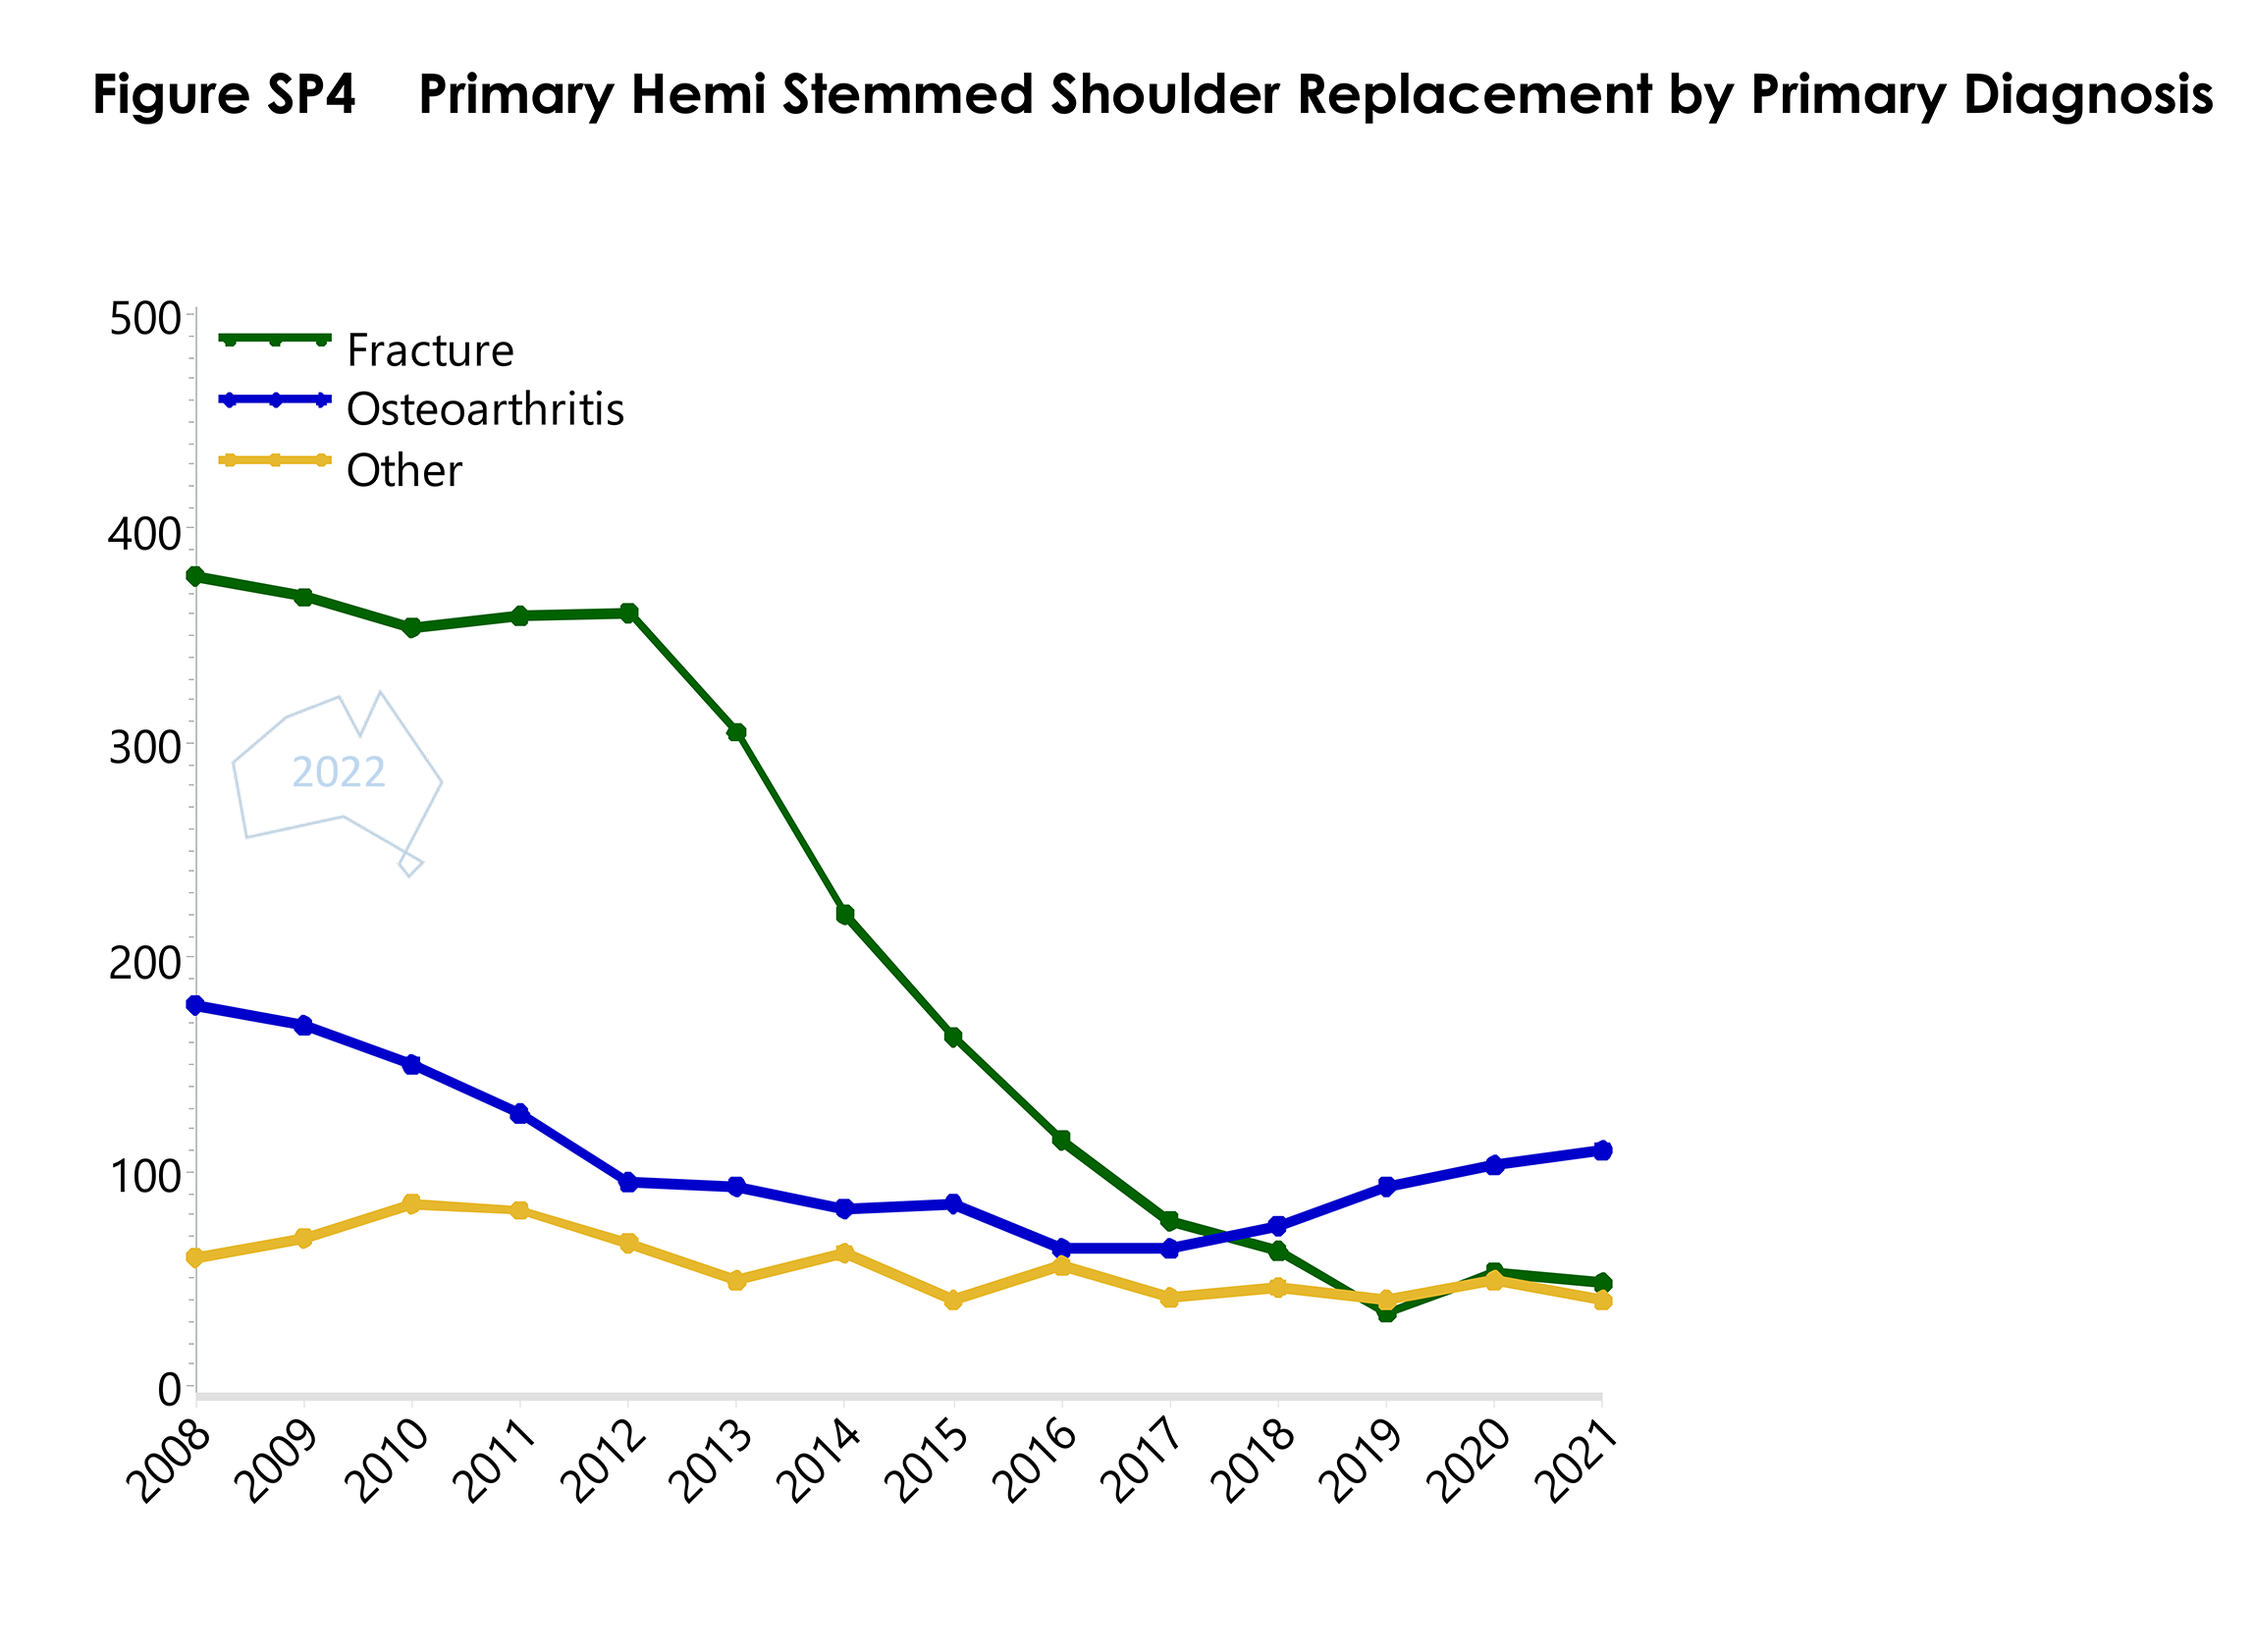
- Figure SP4 Primary Hemi Stemmed Shoulder Replacement by Primary DiagnosisPDF · 62 KB
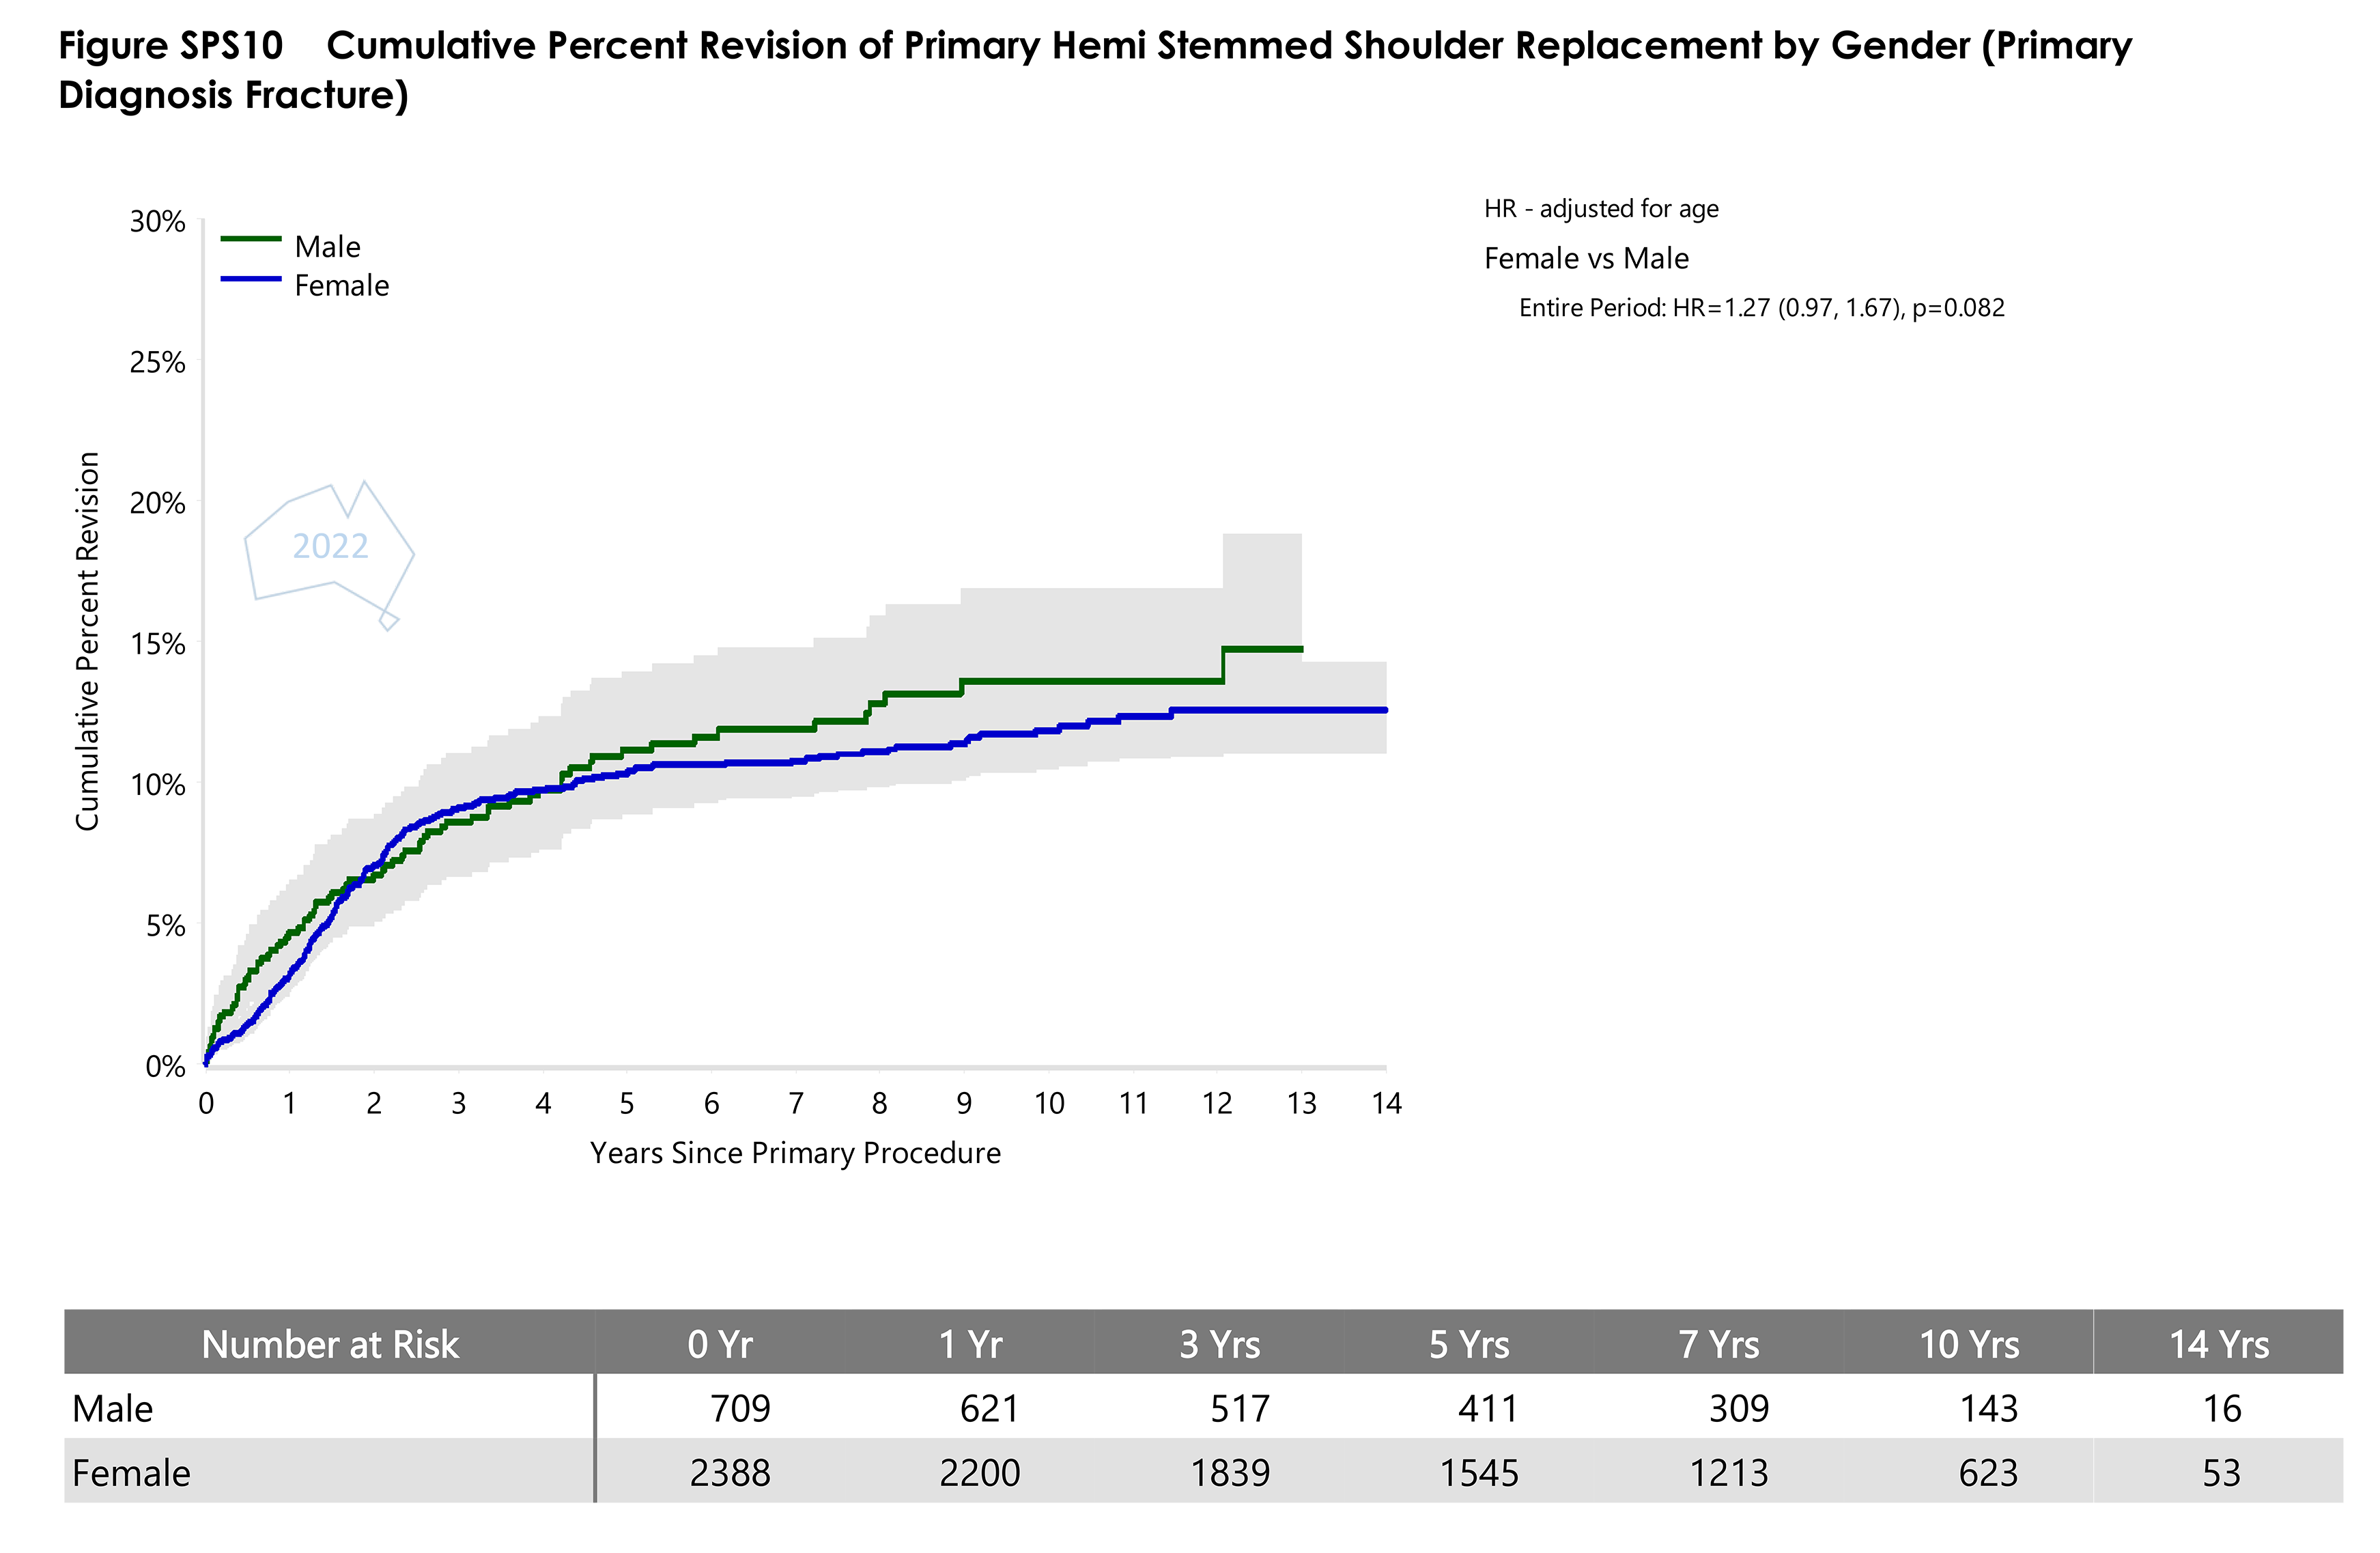
- Figure SPS10 Cumulative Percent Revision of Primary Hemi Stemmed Shoulder Replacement by GenderPDF · 79 KB
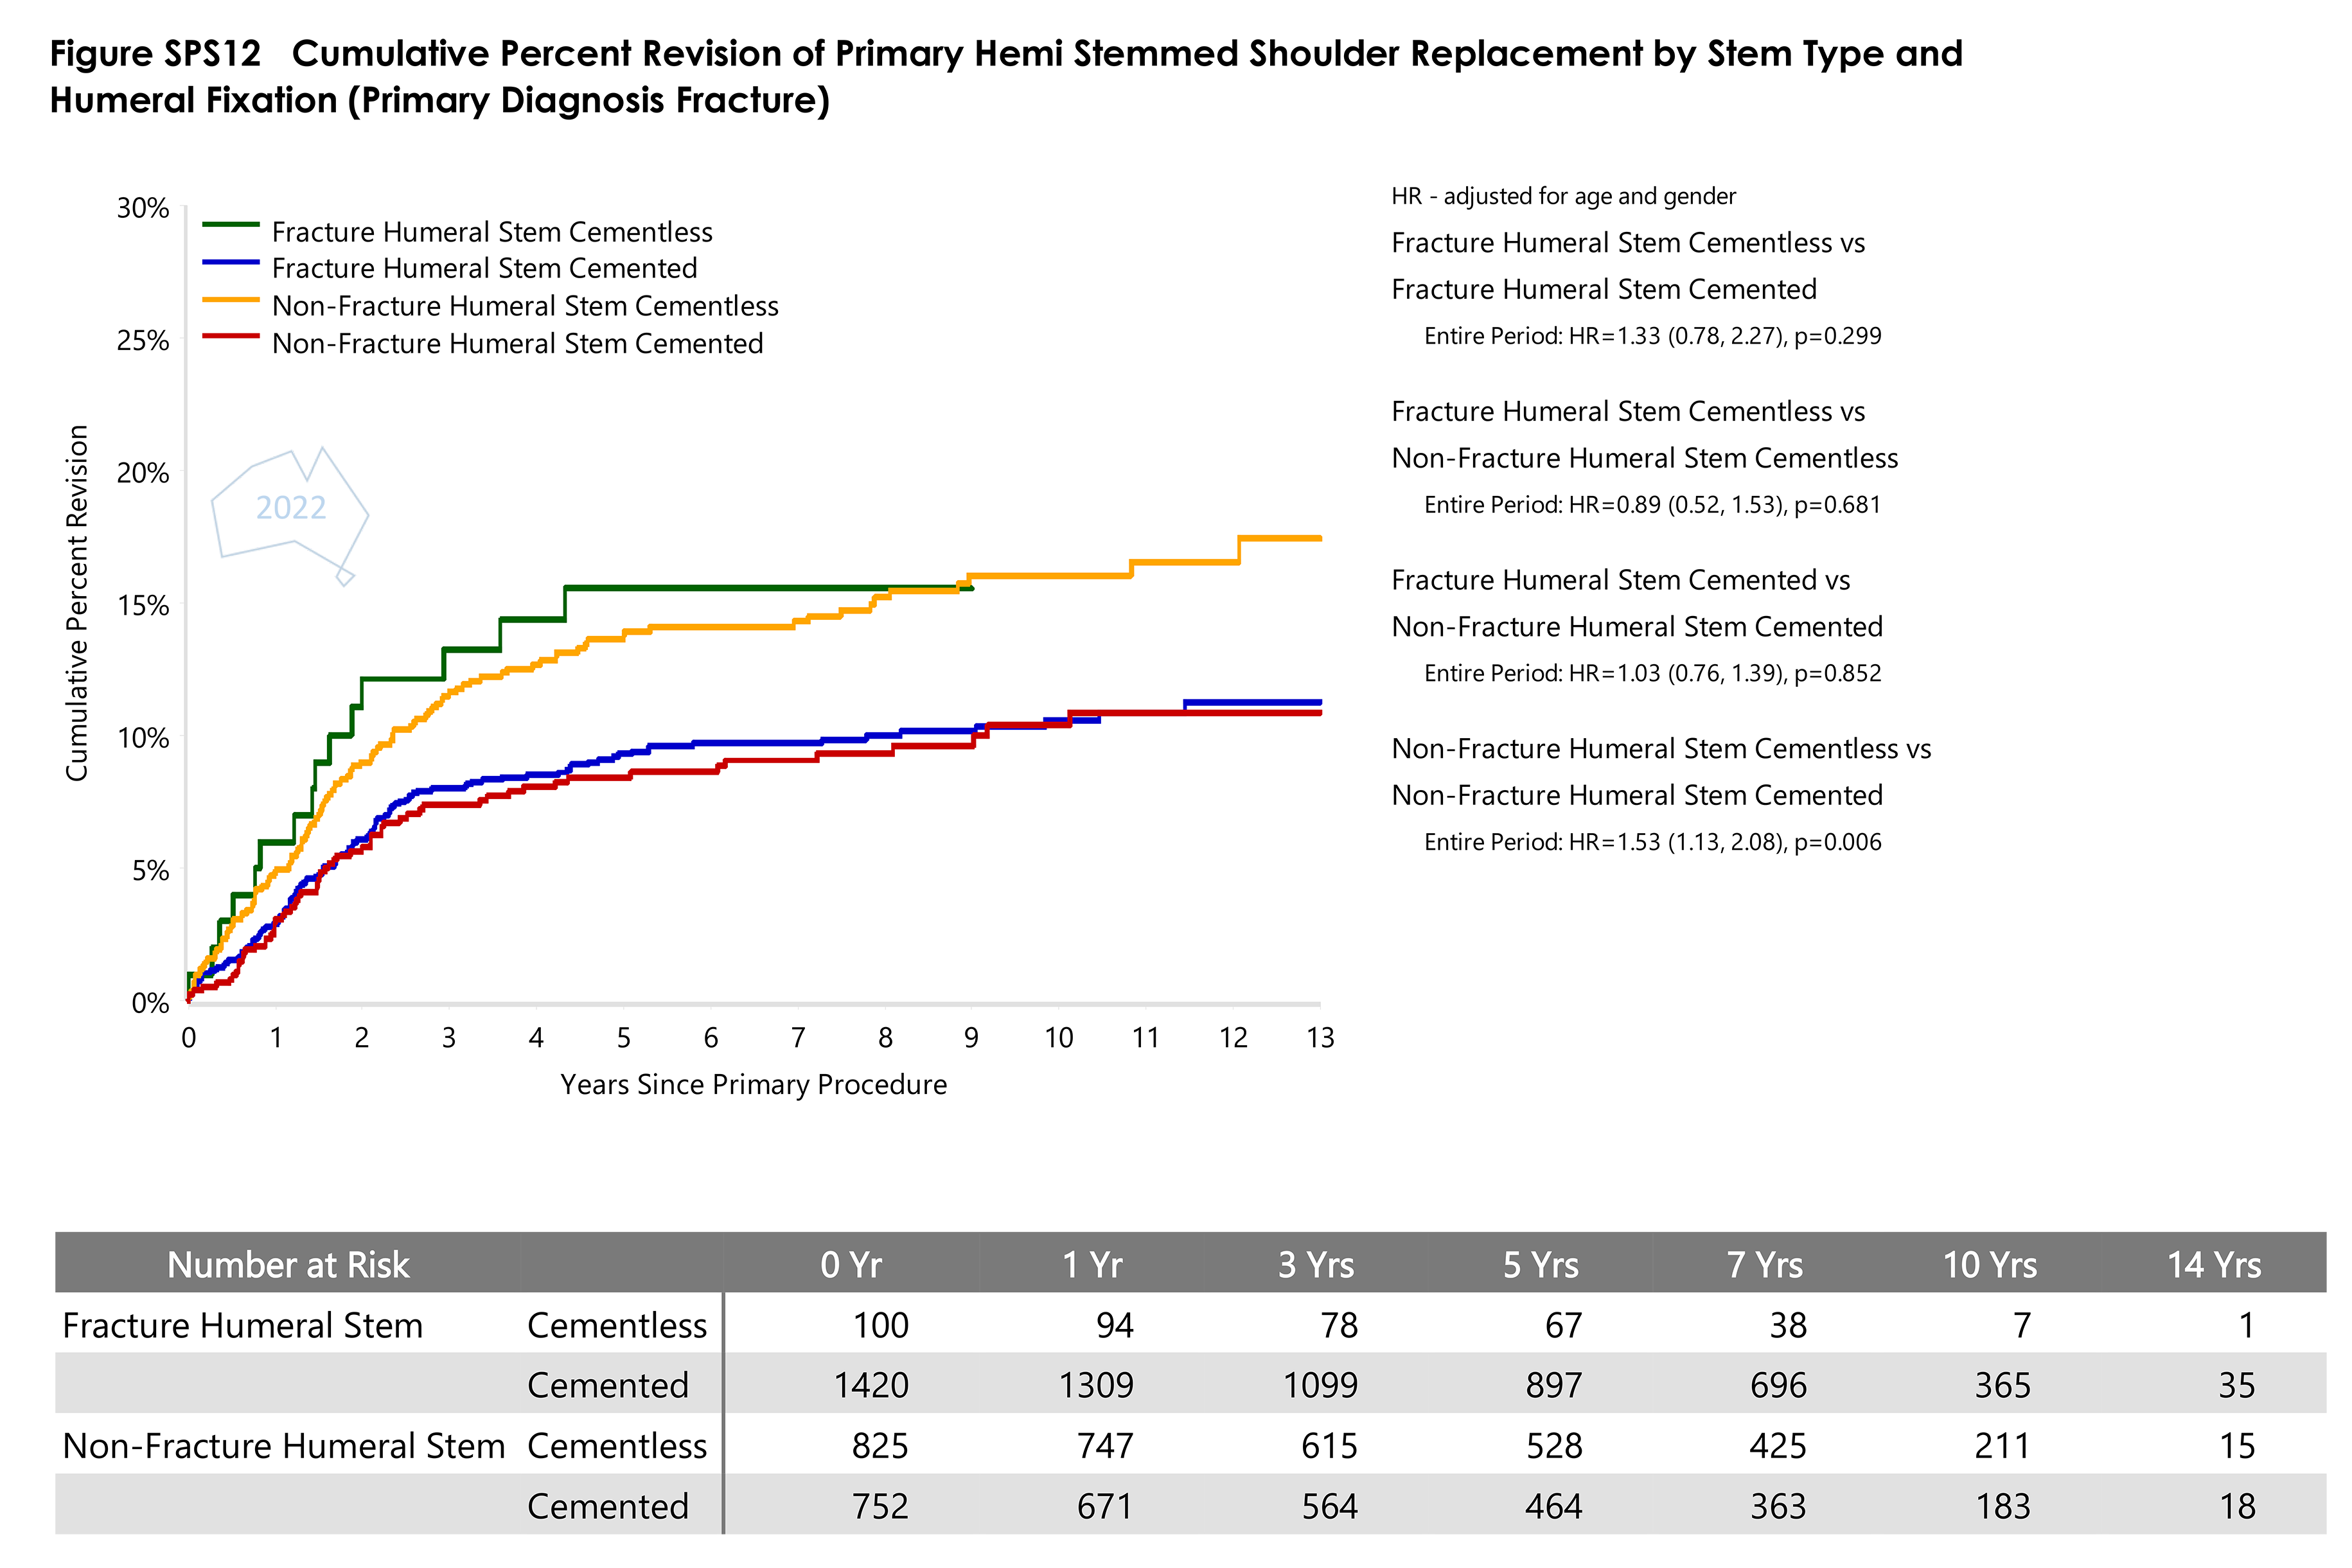
- Figure SPS12 Cumulative Percent Revision of Primary Hemi Stemmed Shoulder Replacement by Stem Type and Humeral FixationPDF · 82 KB
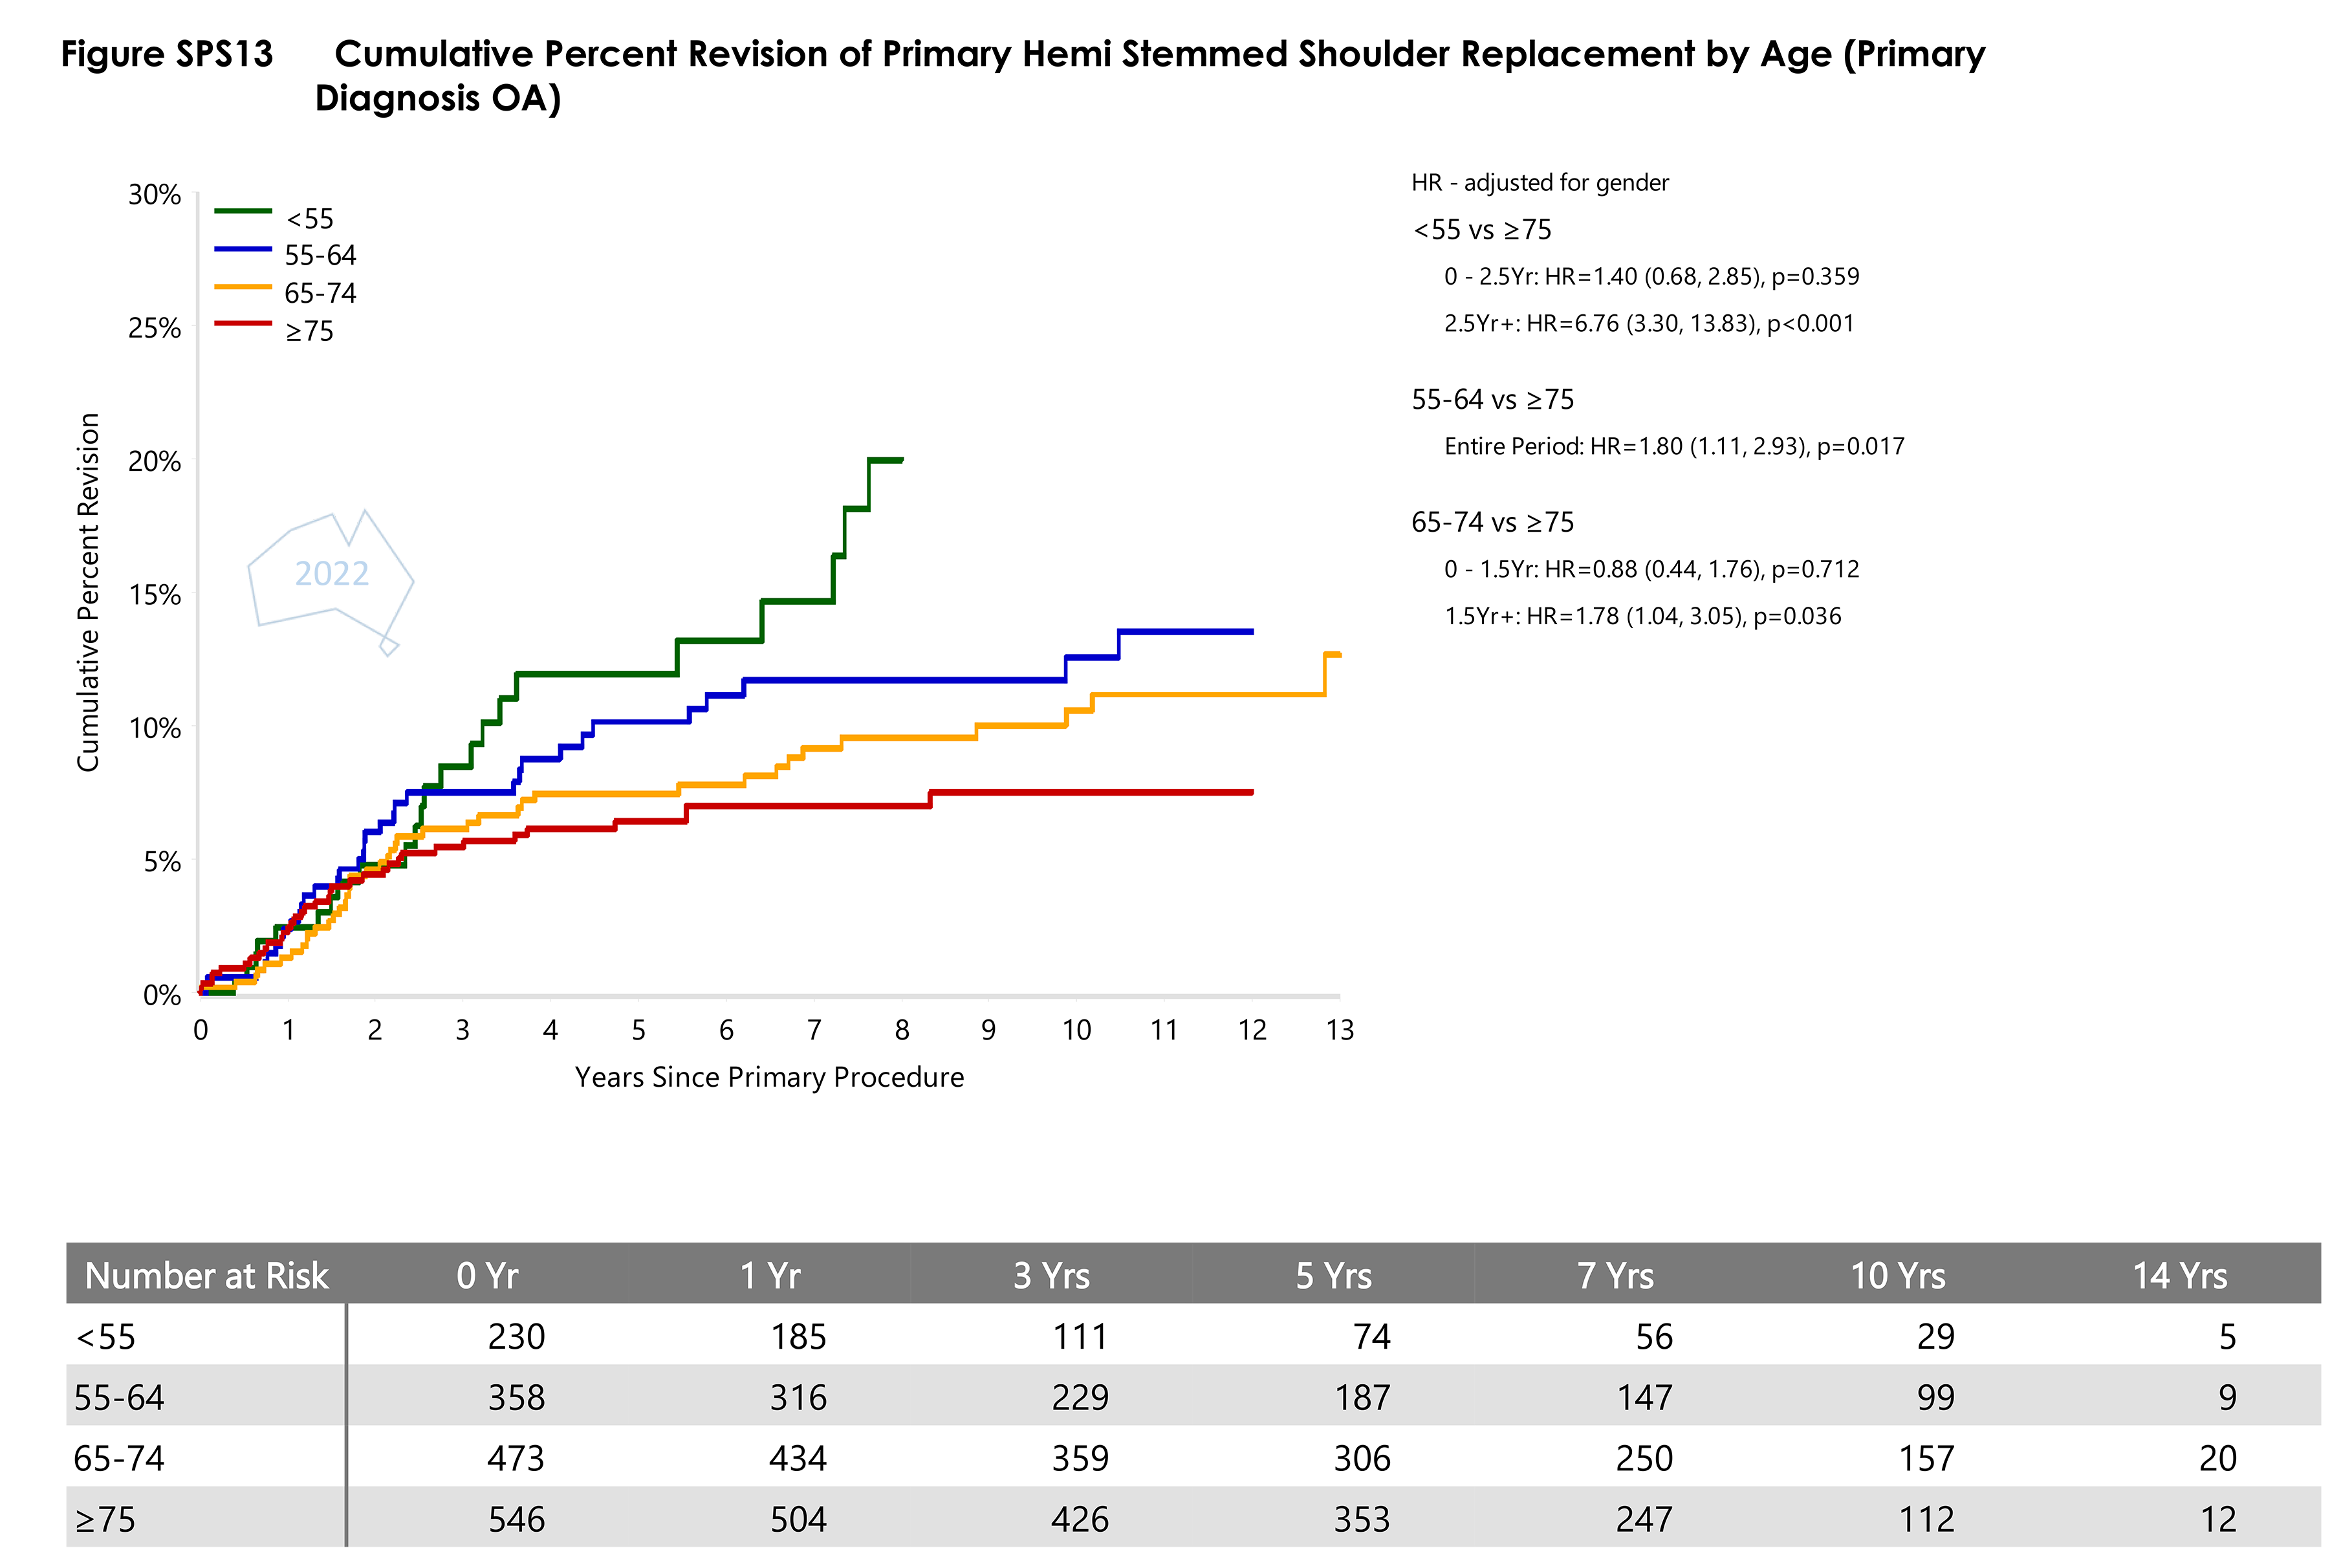
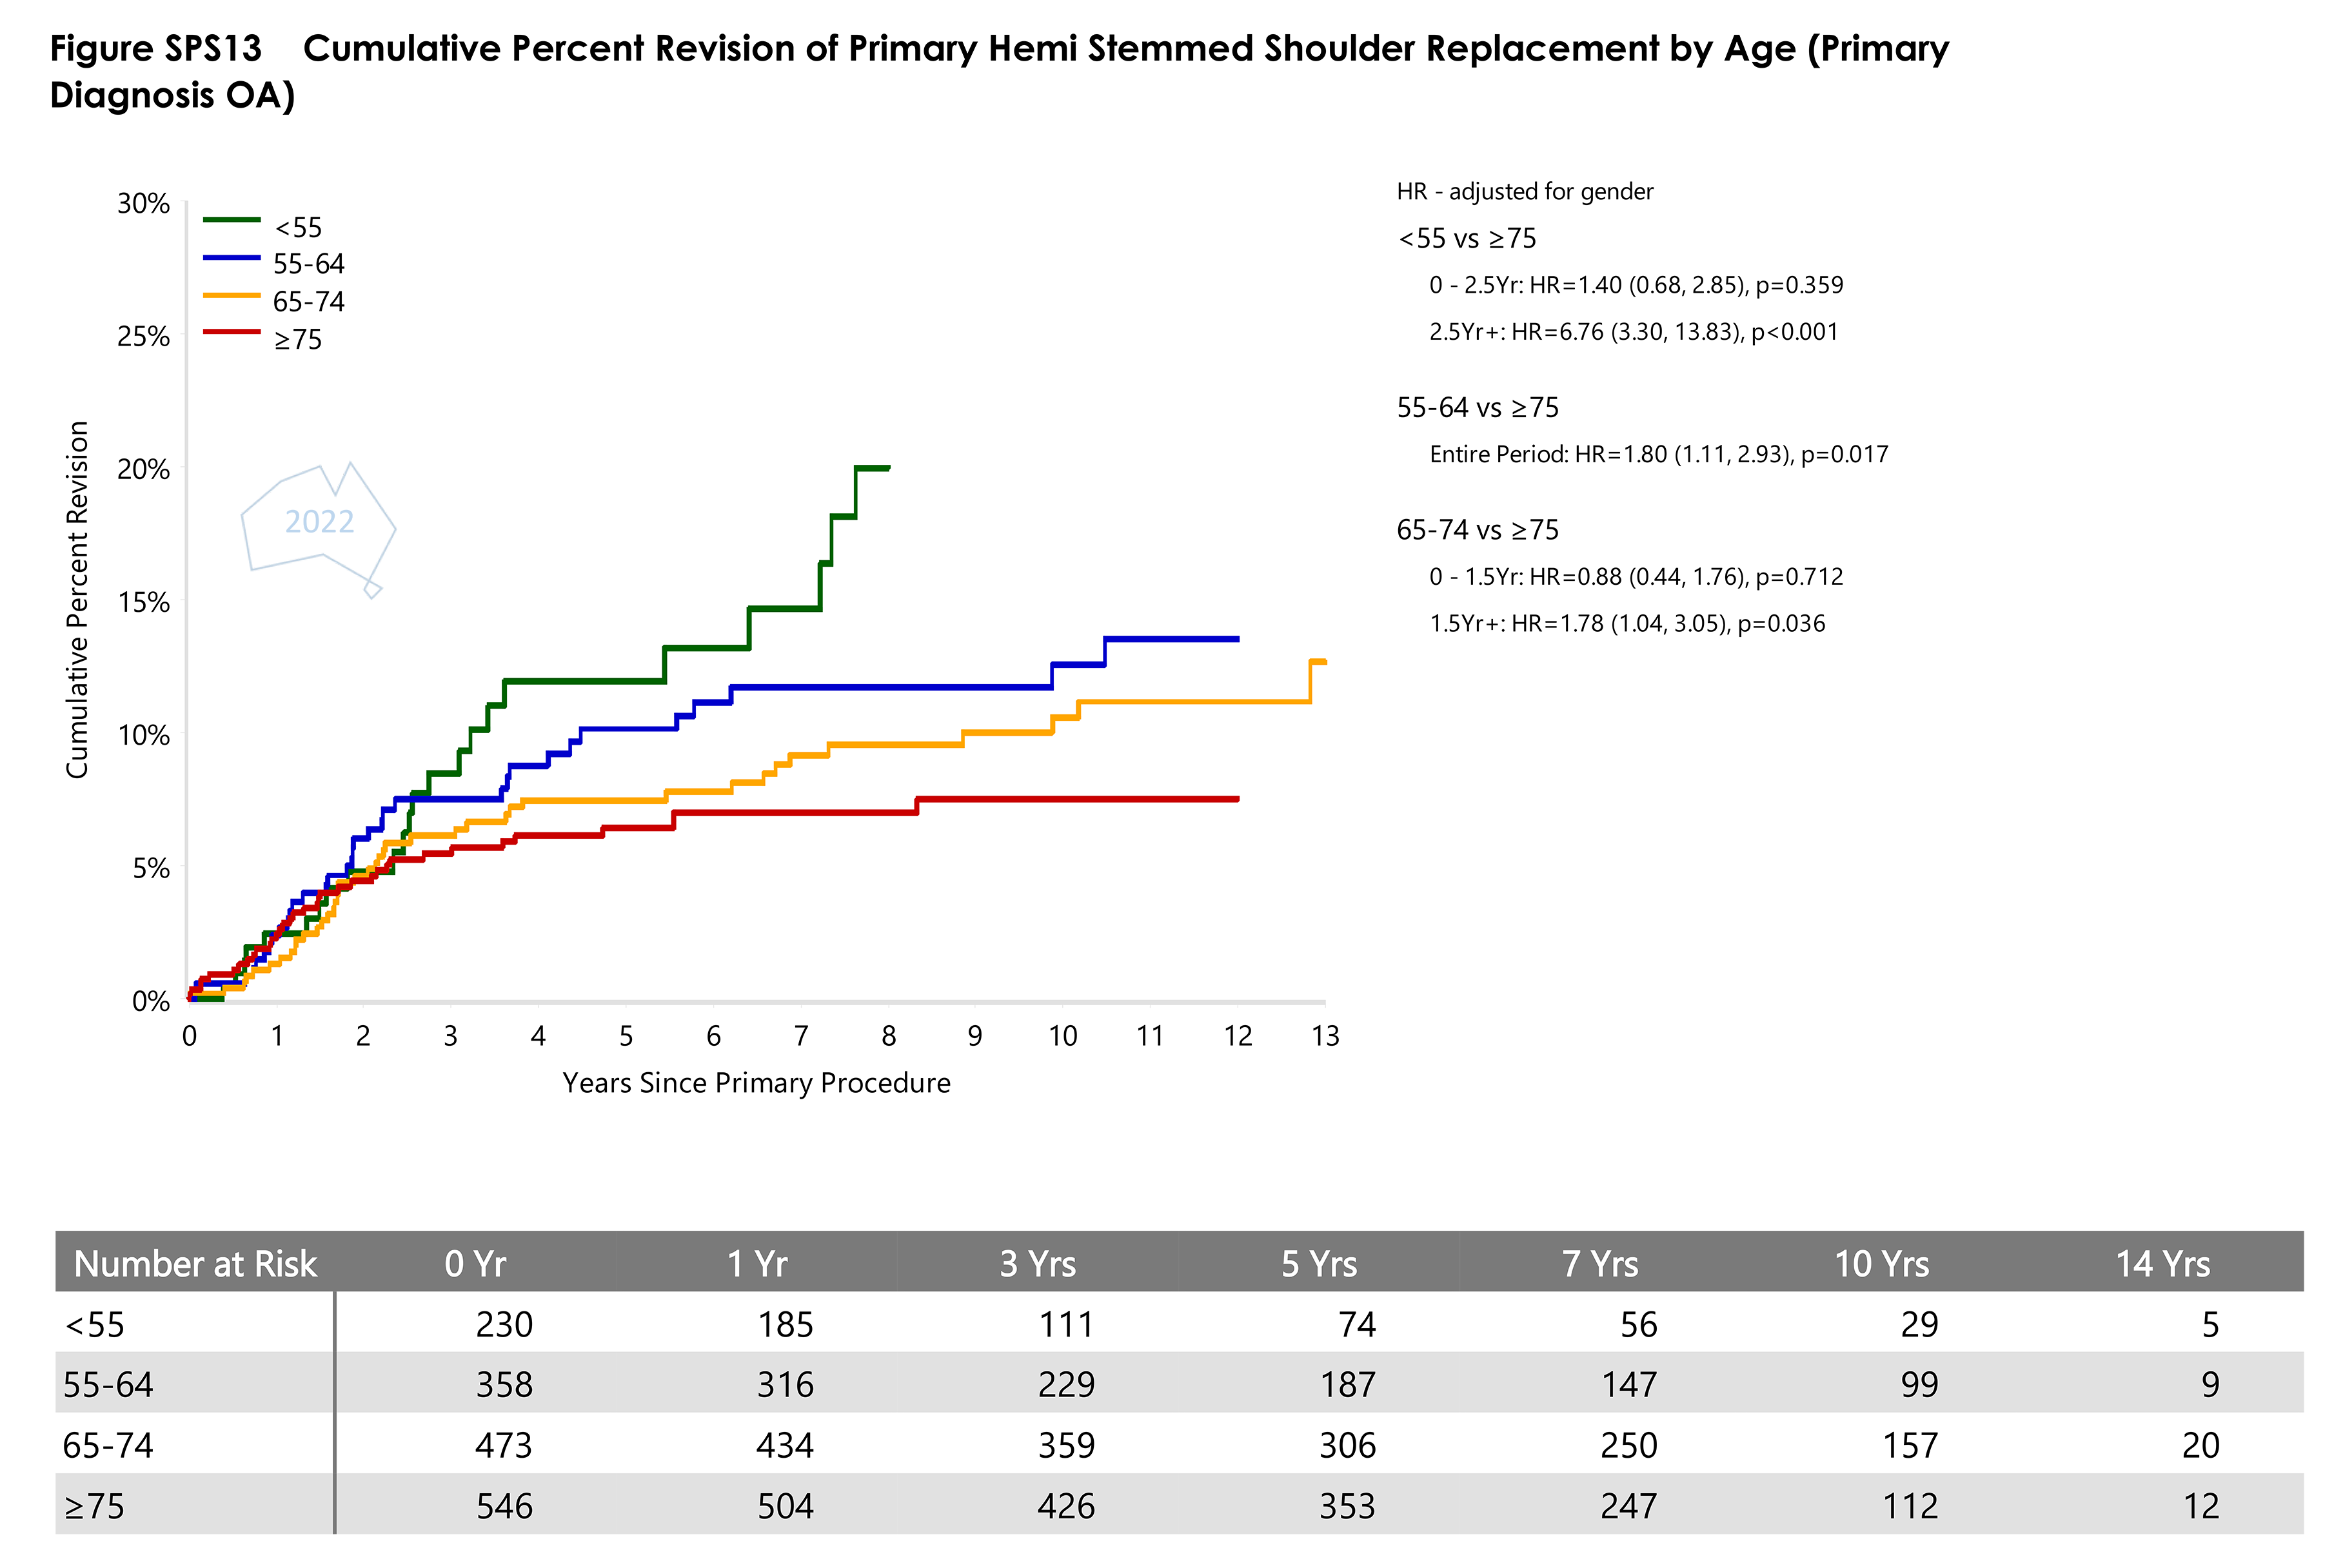
- Figure SPS13 Cumulative Percent Revision of Primary Hemi Stemmed Shoulder Replacement by AgePDF · 92 KB
- Figure SPS13 Cumulative Percent Revision of Primary Hemi Stemmed Shoulder Replacement by AgePDF · 72 KB
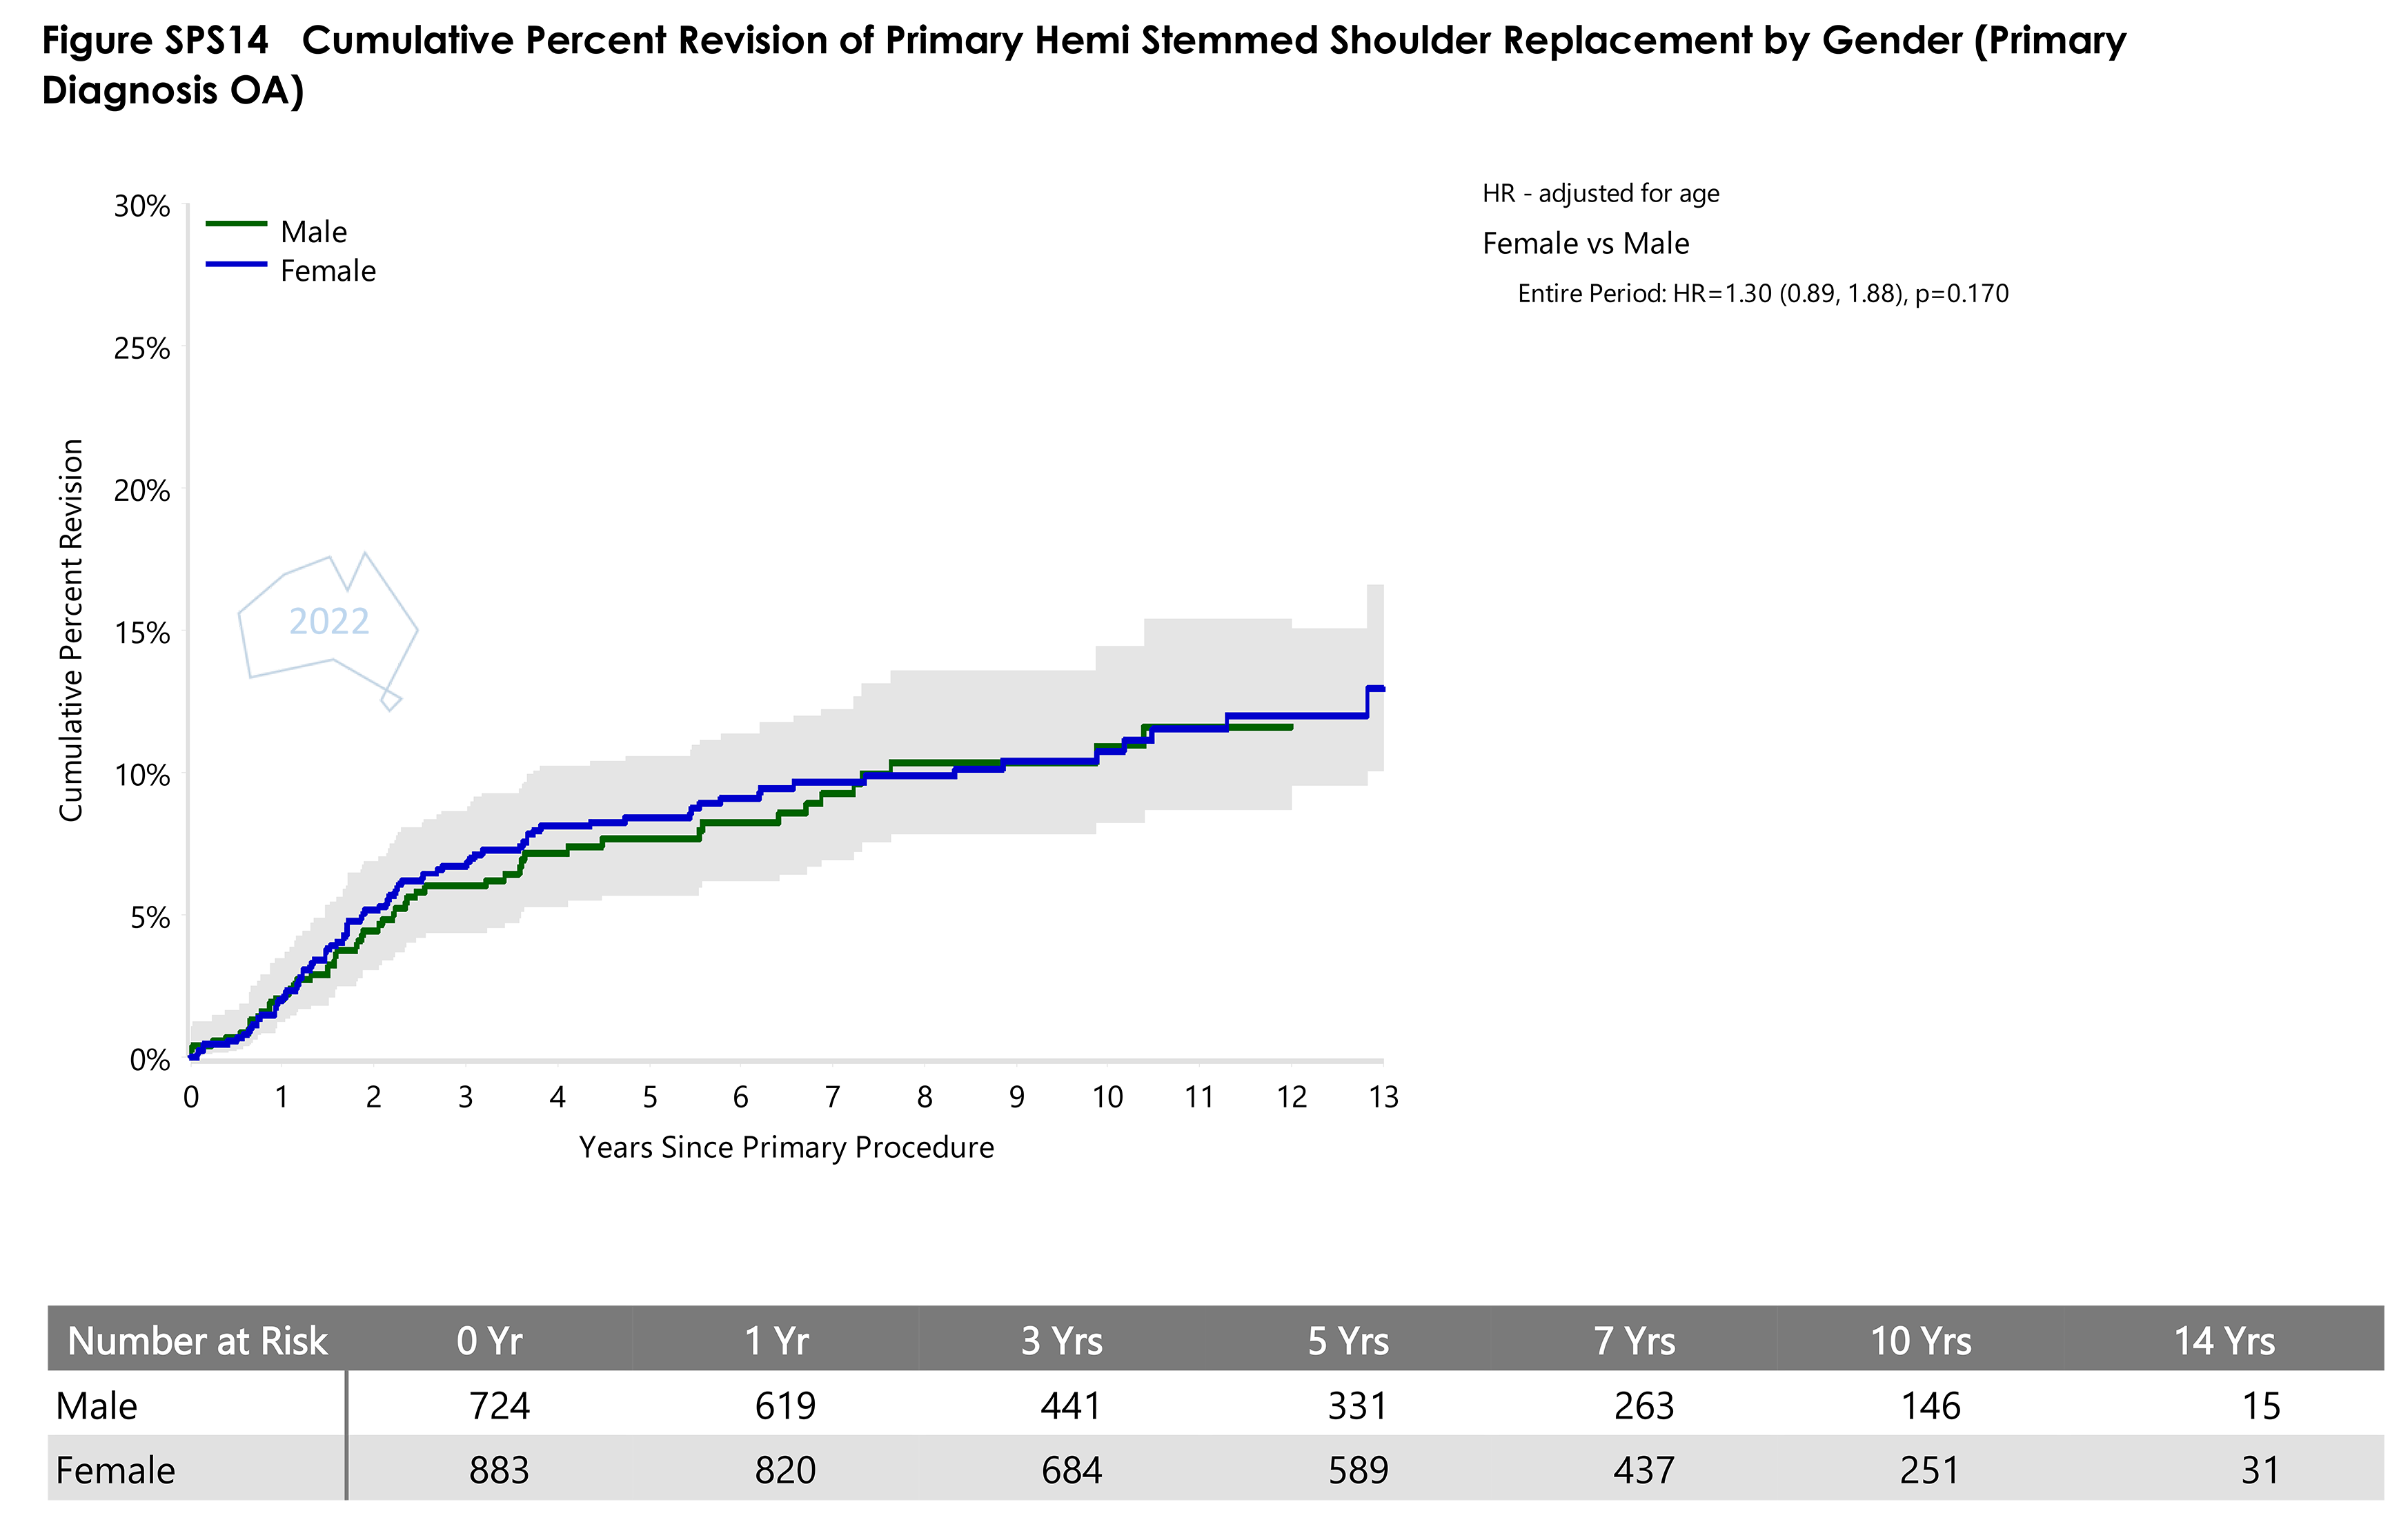
- Figure SPS14 Cumulative Percent Revision of Primary Hemi Stemmed Shoulder Replacement by GenderPDF · 70 KB
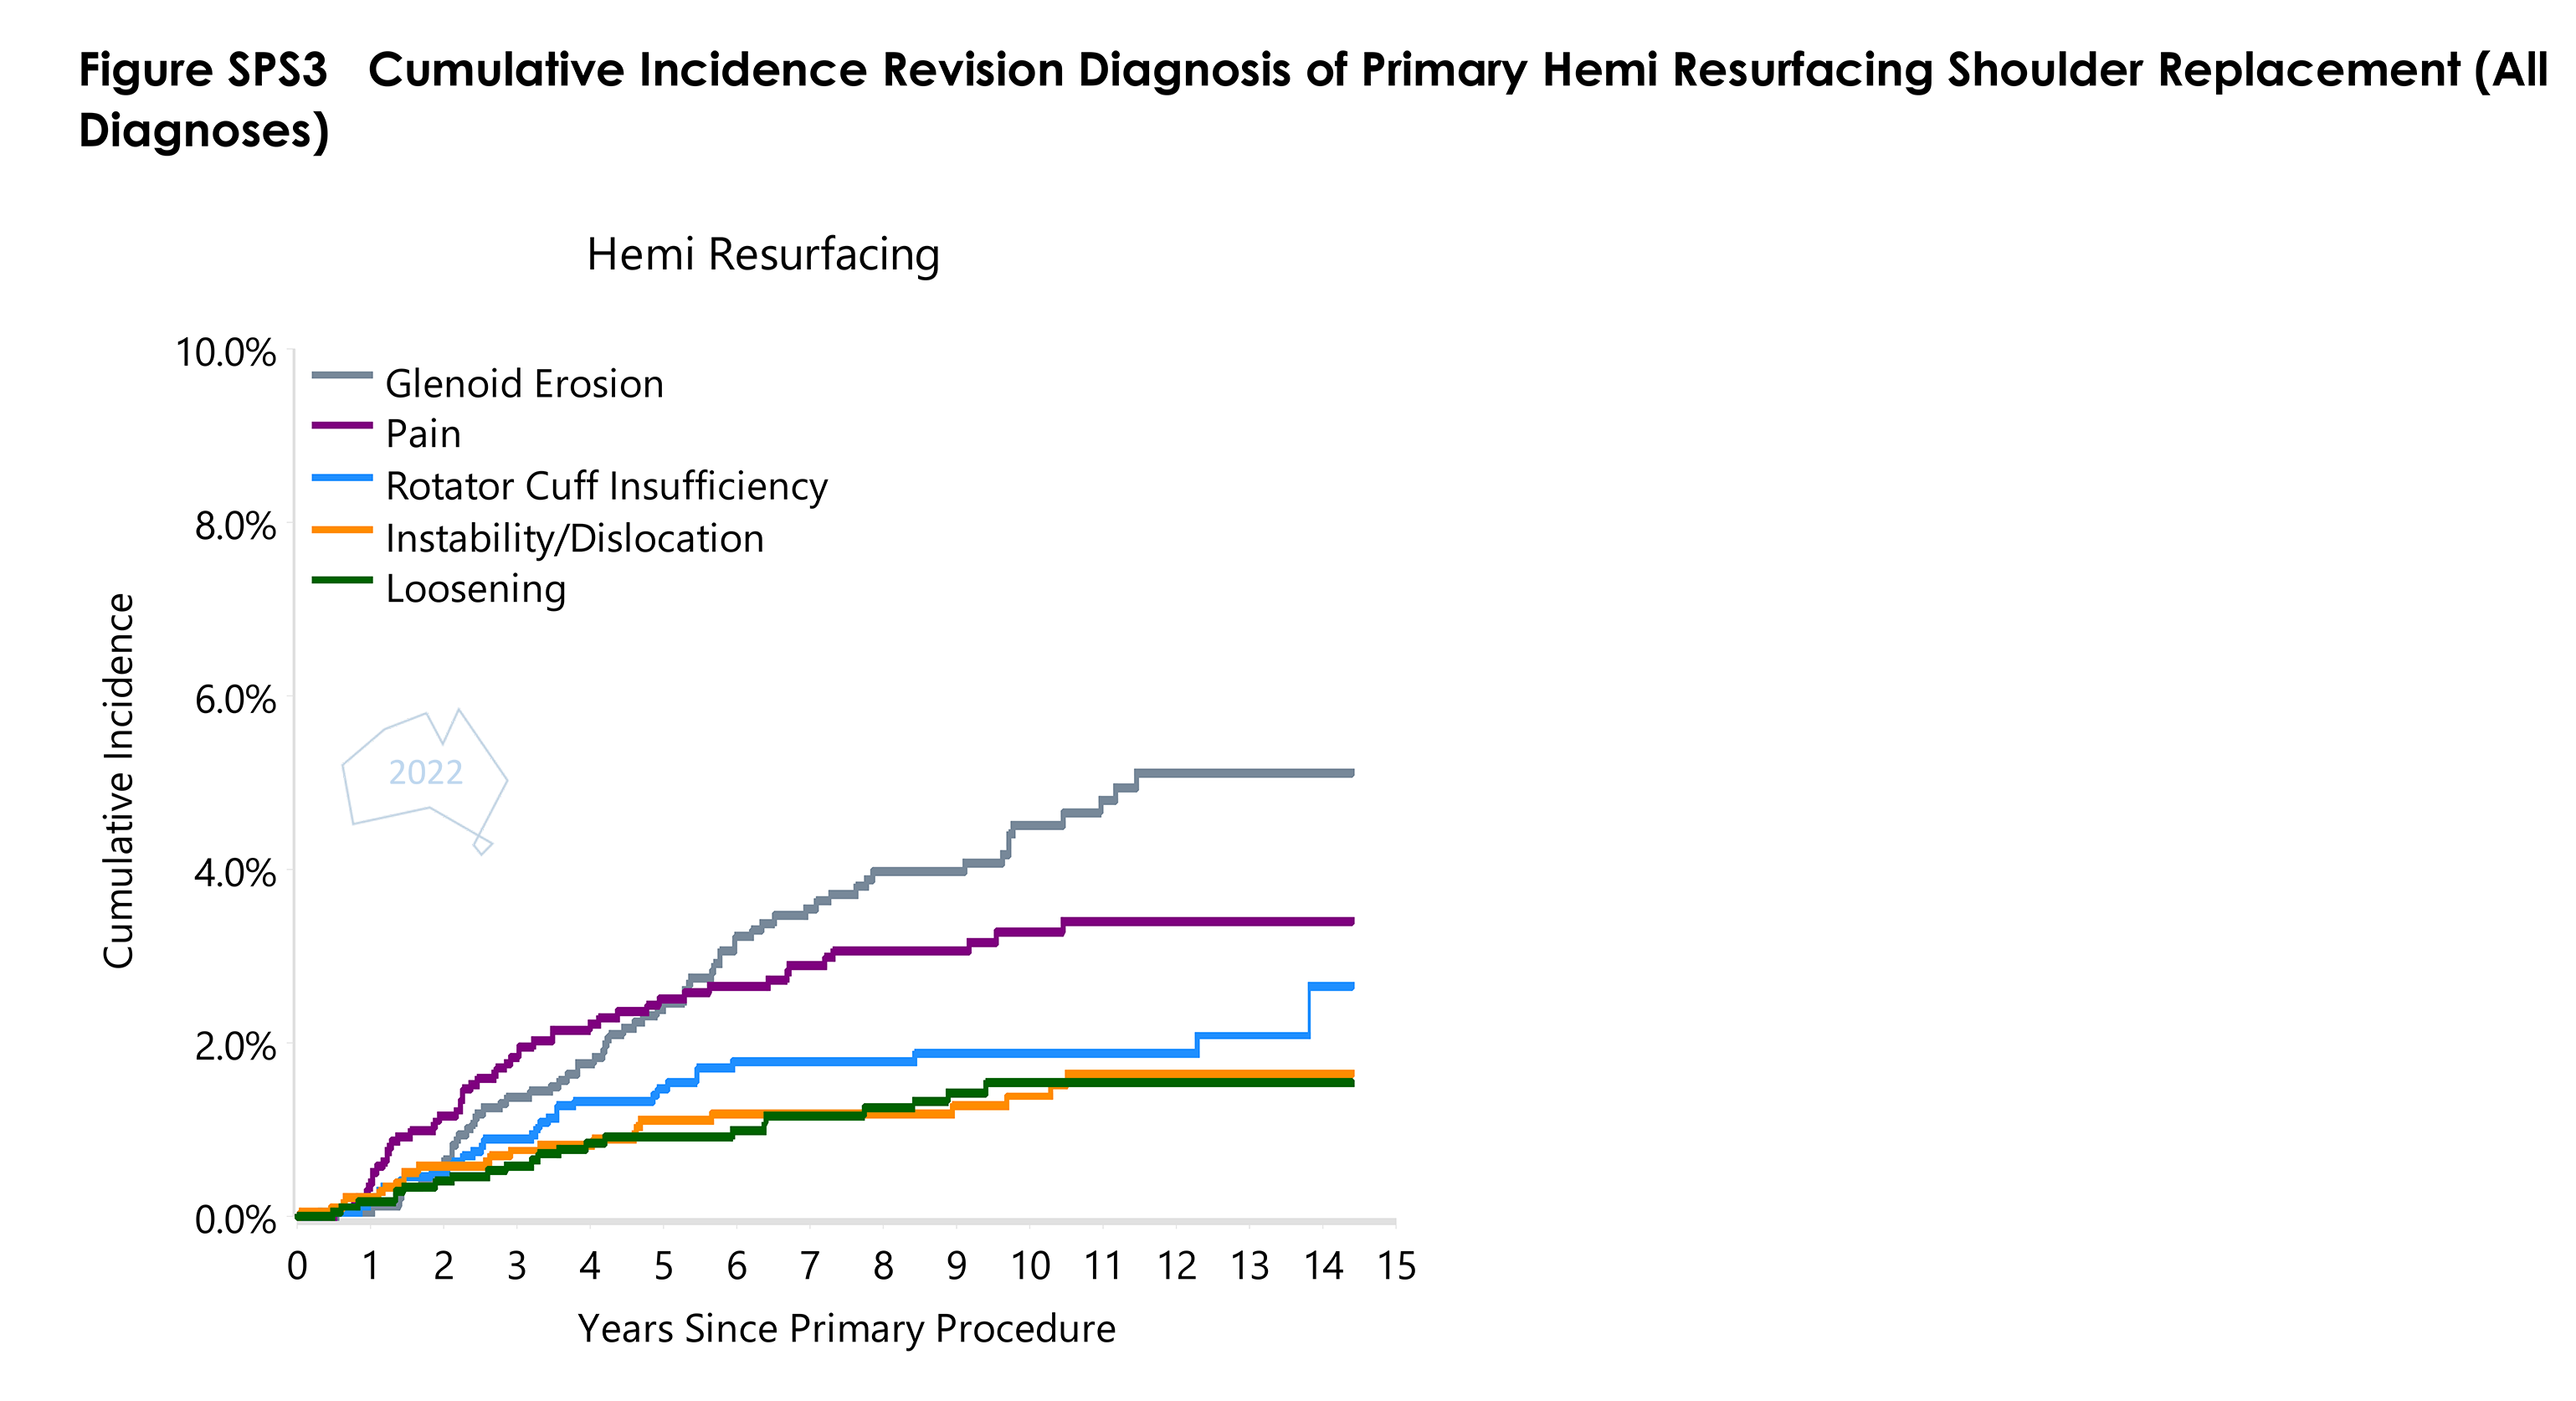
- Figure SPS3 Cumulative Incidence Revision Diagnosis of Primary Hemi Resurfacing Shoulder ReplacementPDF · 56 KB
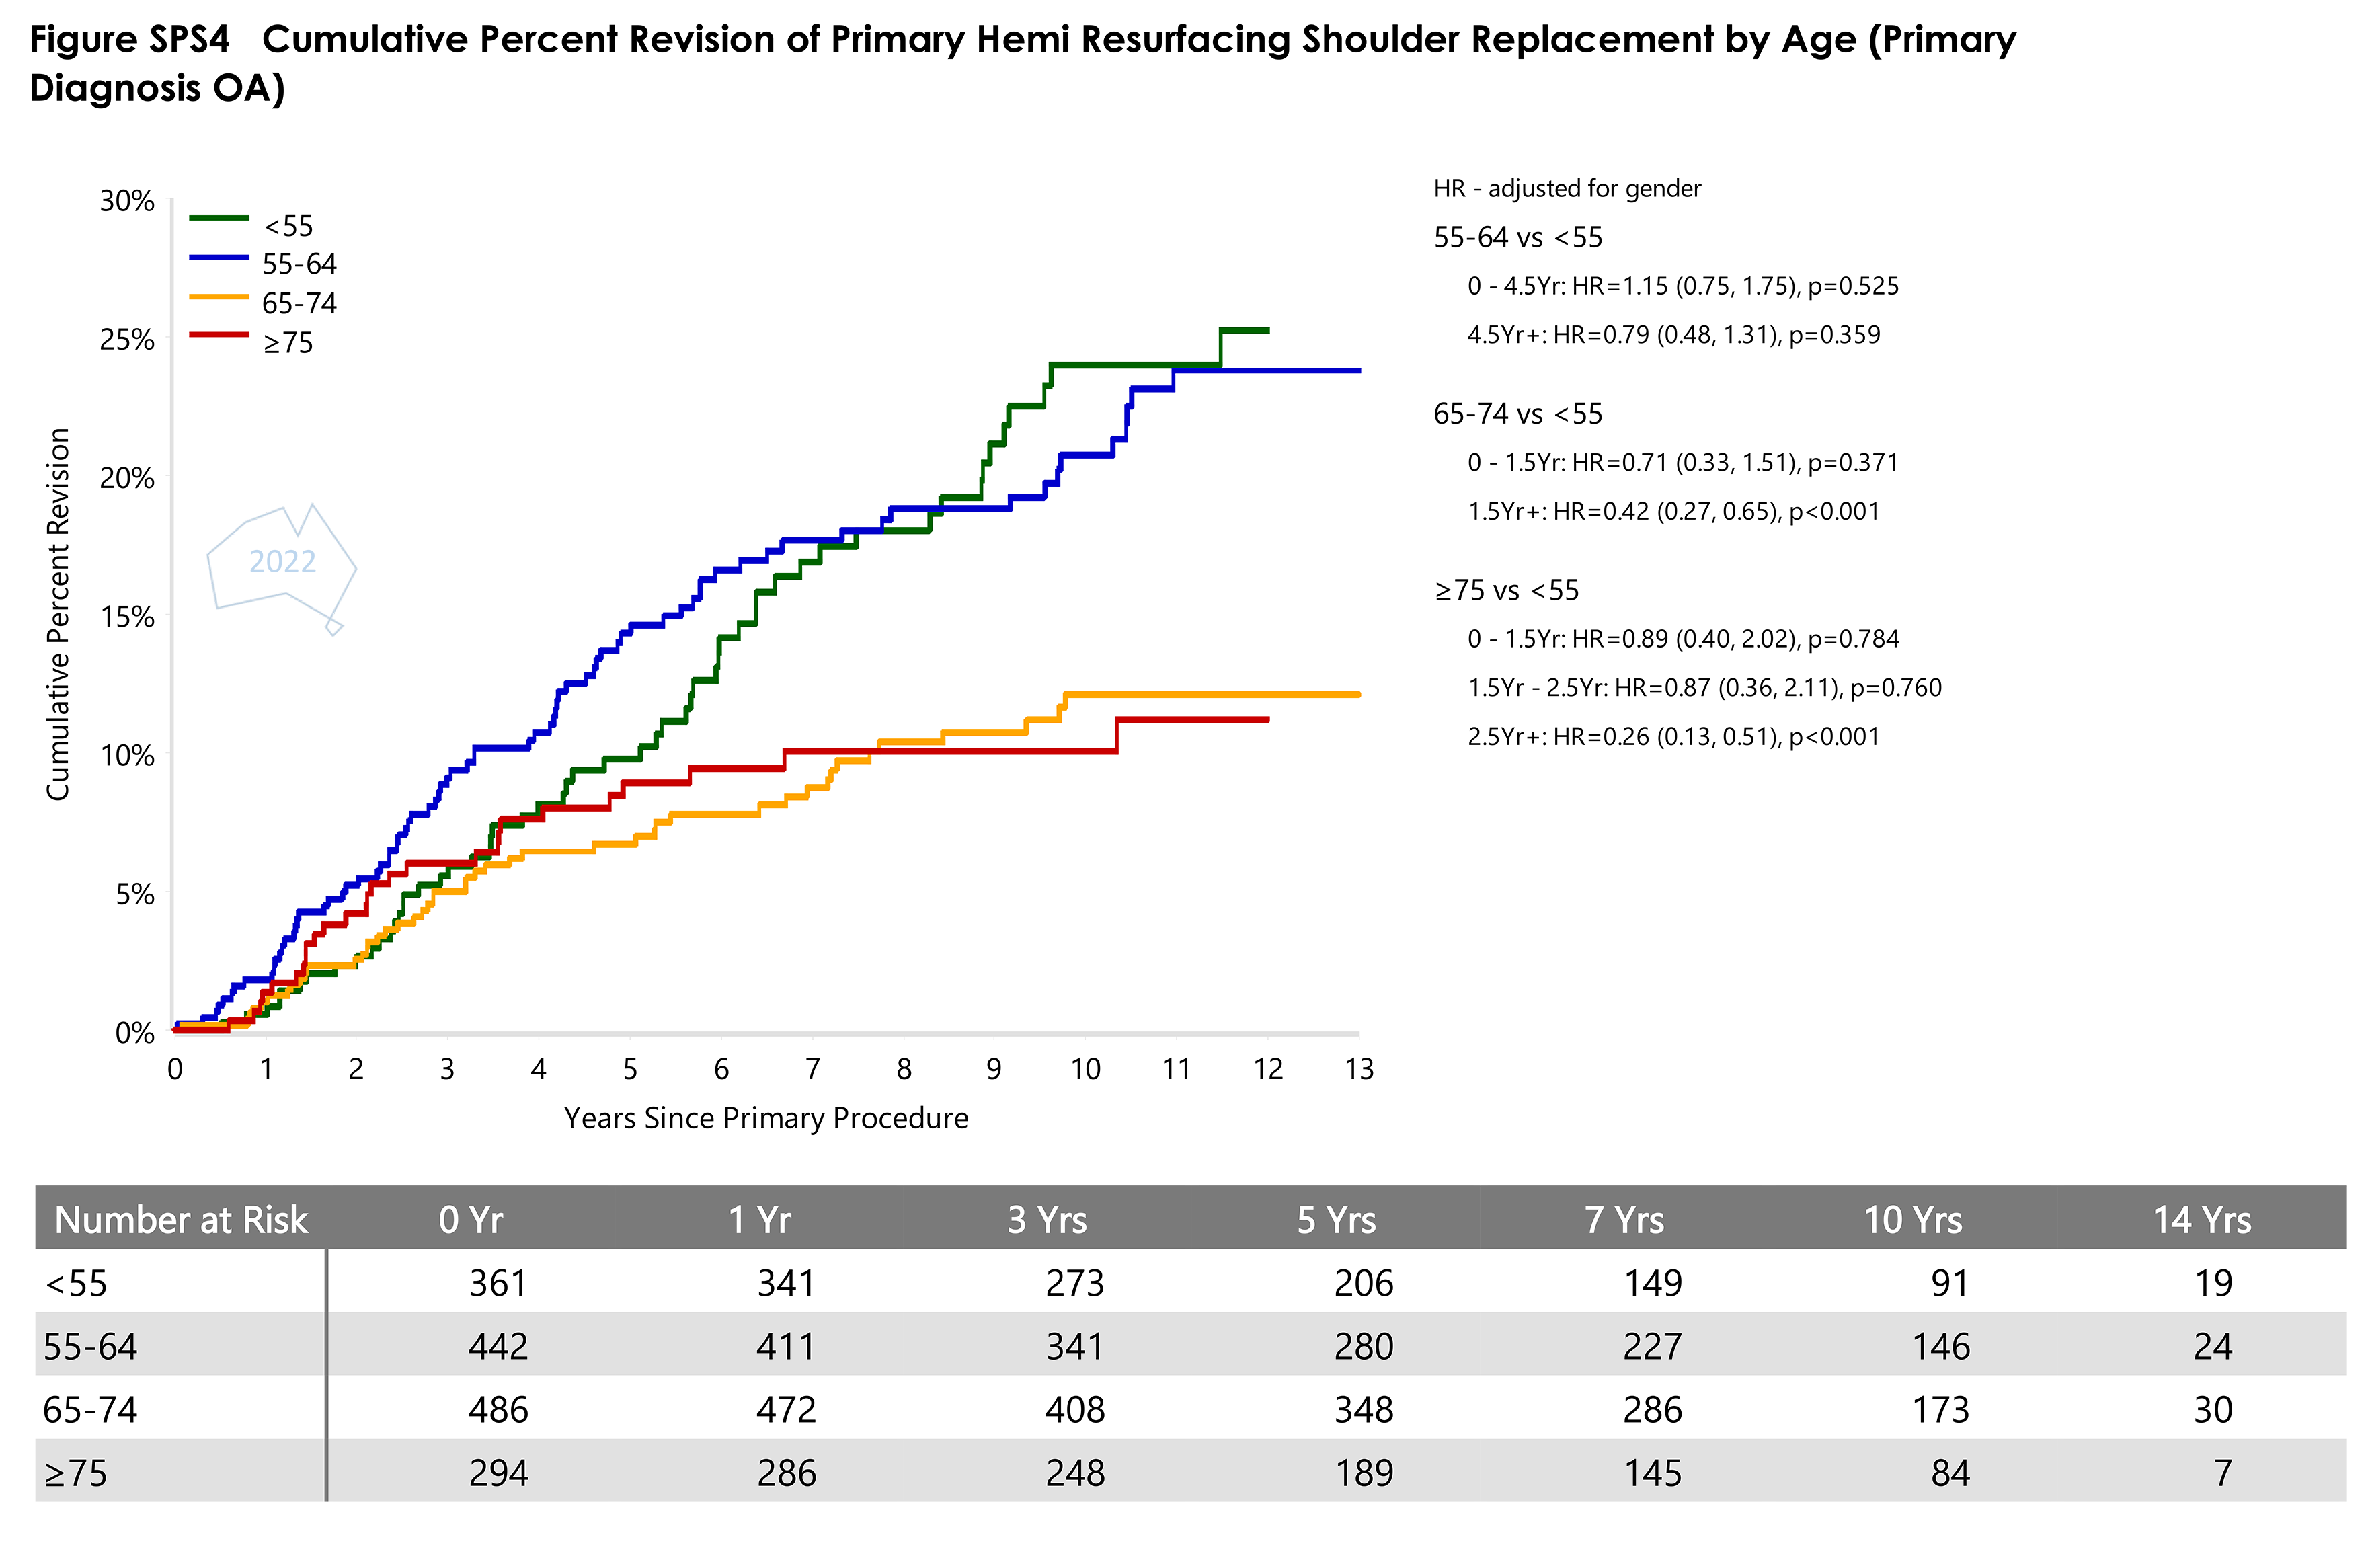
- Figure SPS4 Cumulative Percent Revision of Primary Hemi Resurfacing Shoulder Replacement by AgePDF · 67 KB
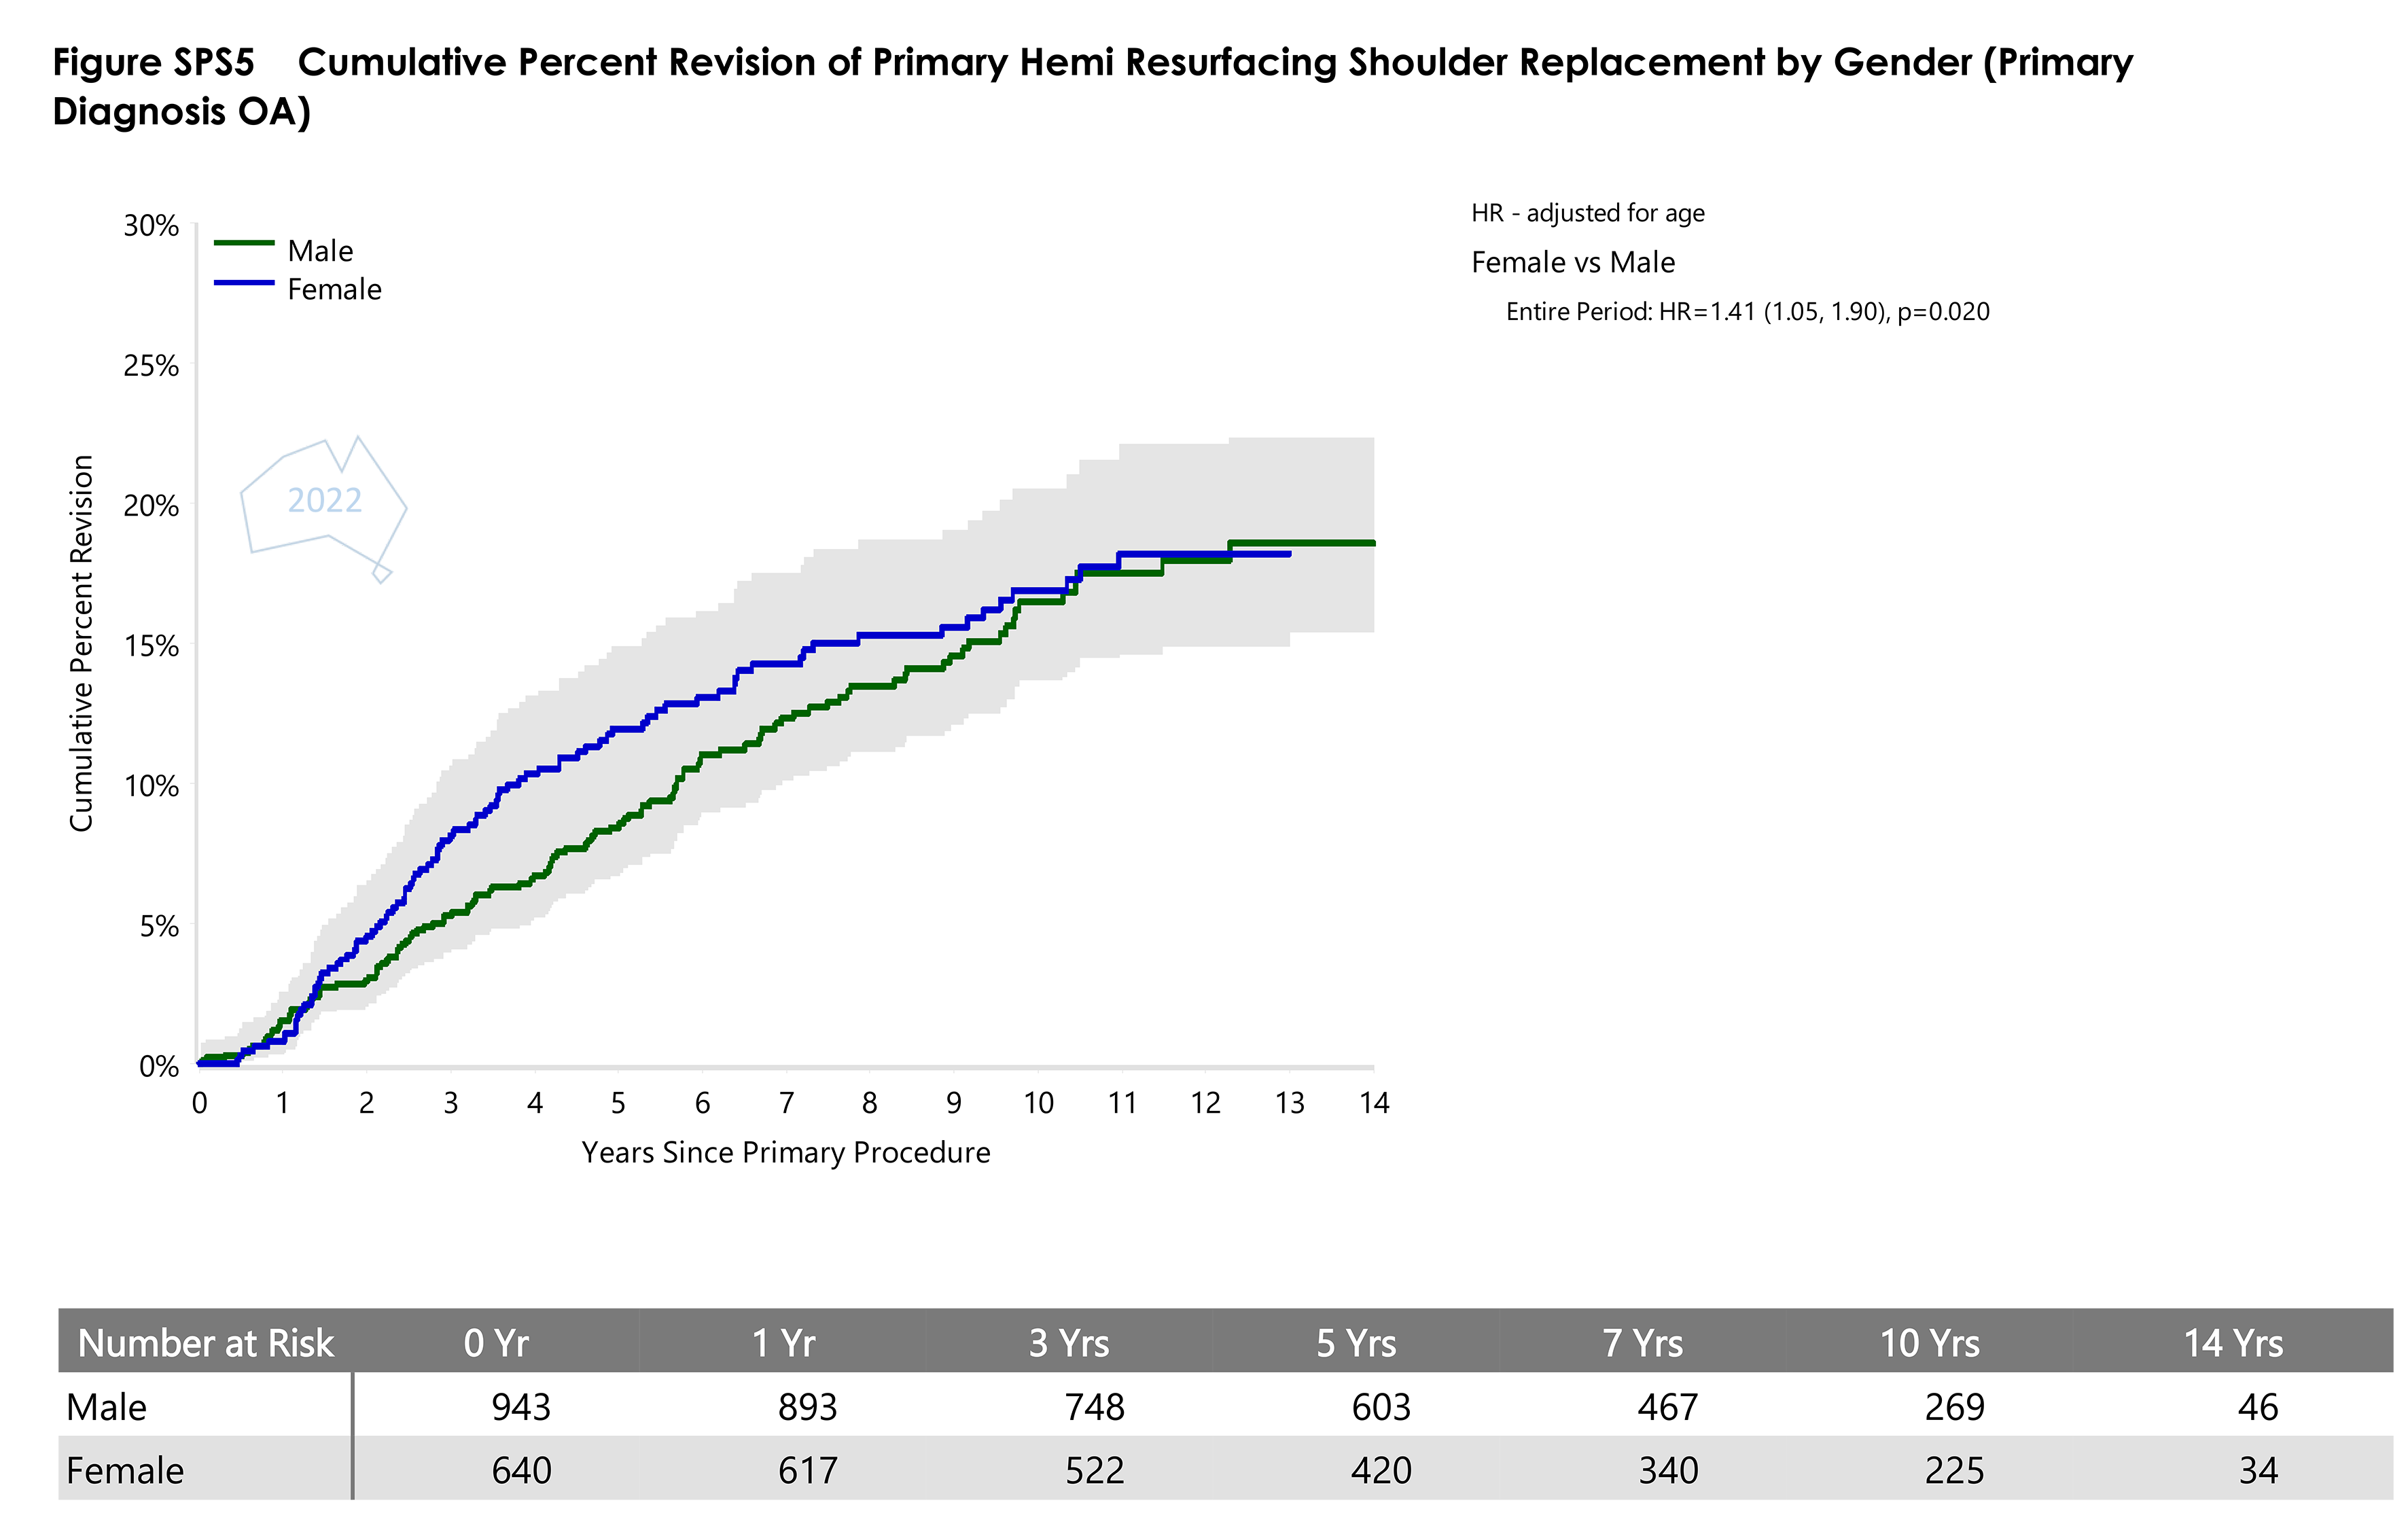
- Figure SPS5 Cumulative Percent Revision of Primary Hemi Resurfacing Shoulder Replacement by GenderPDF · 66 KB
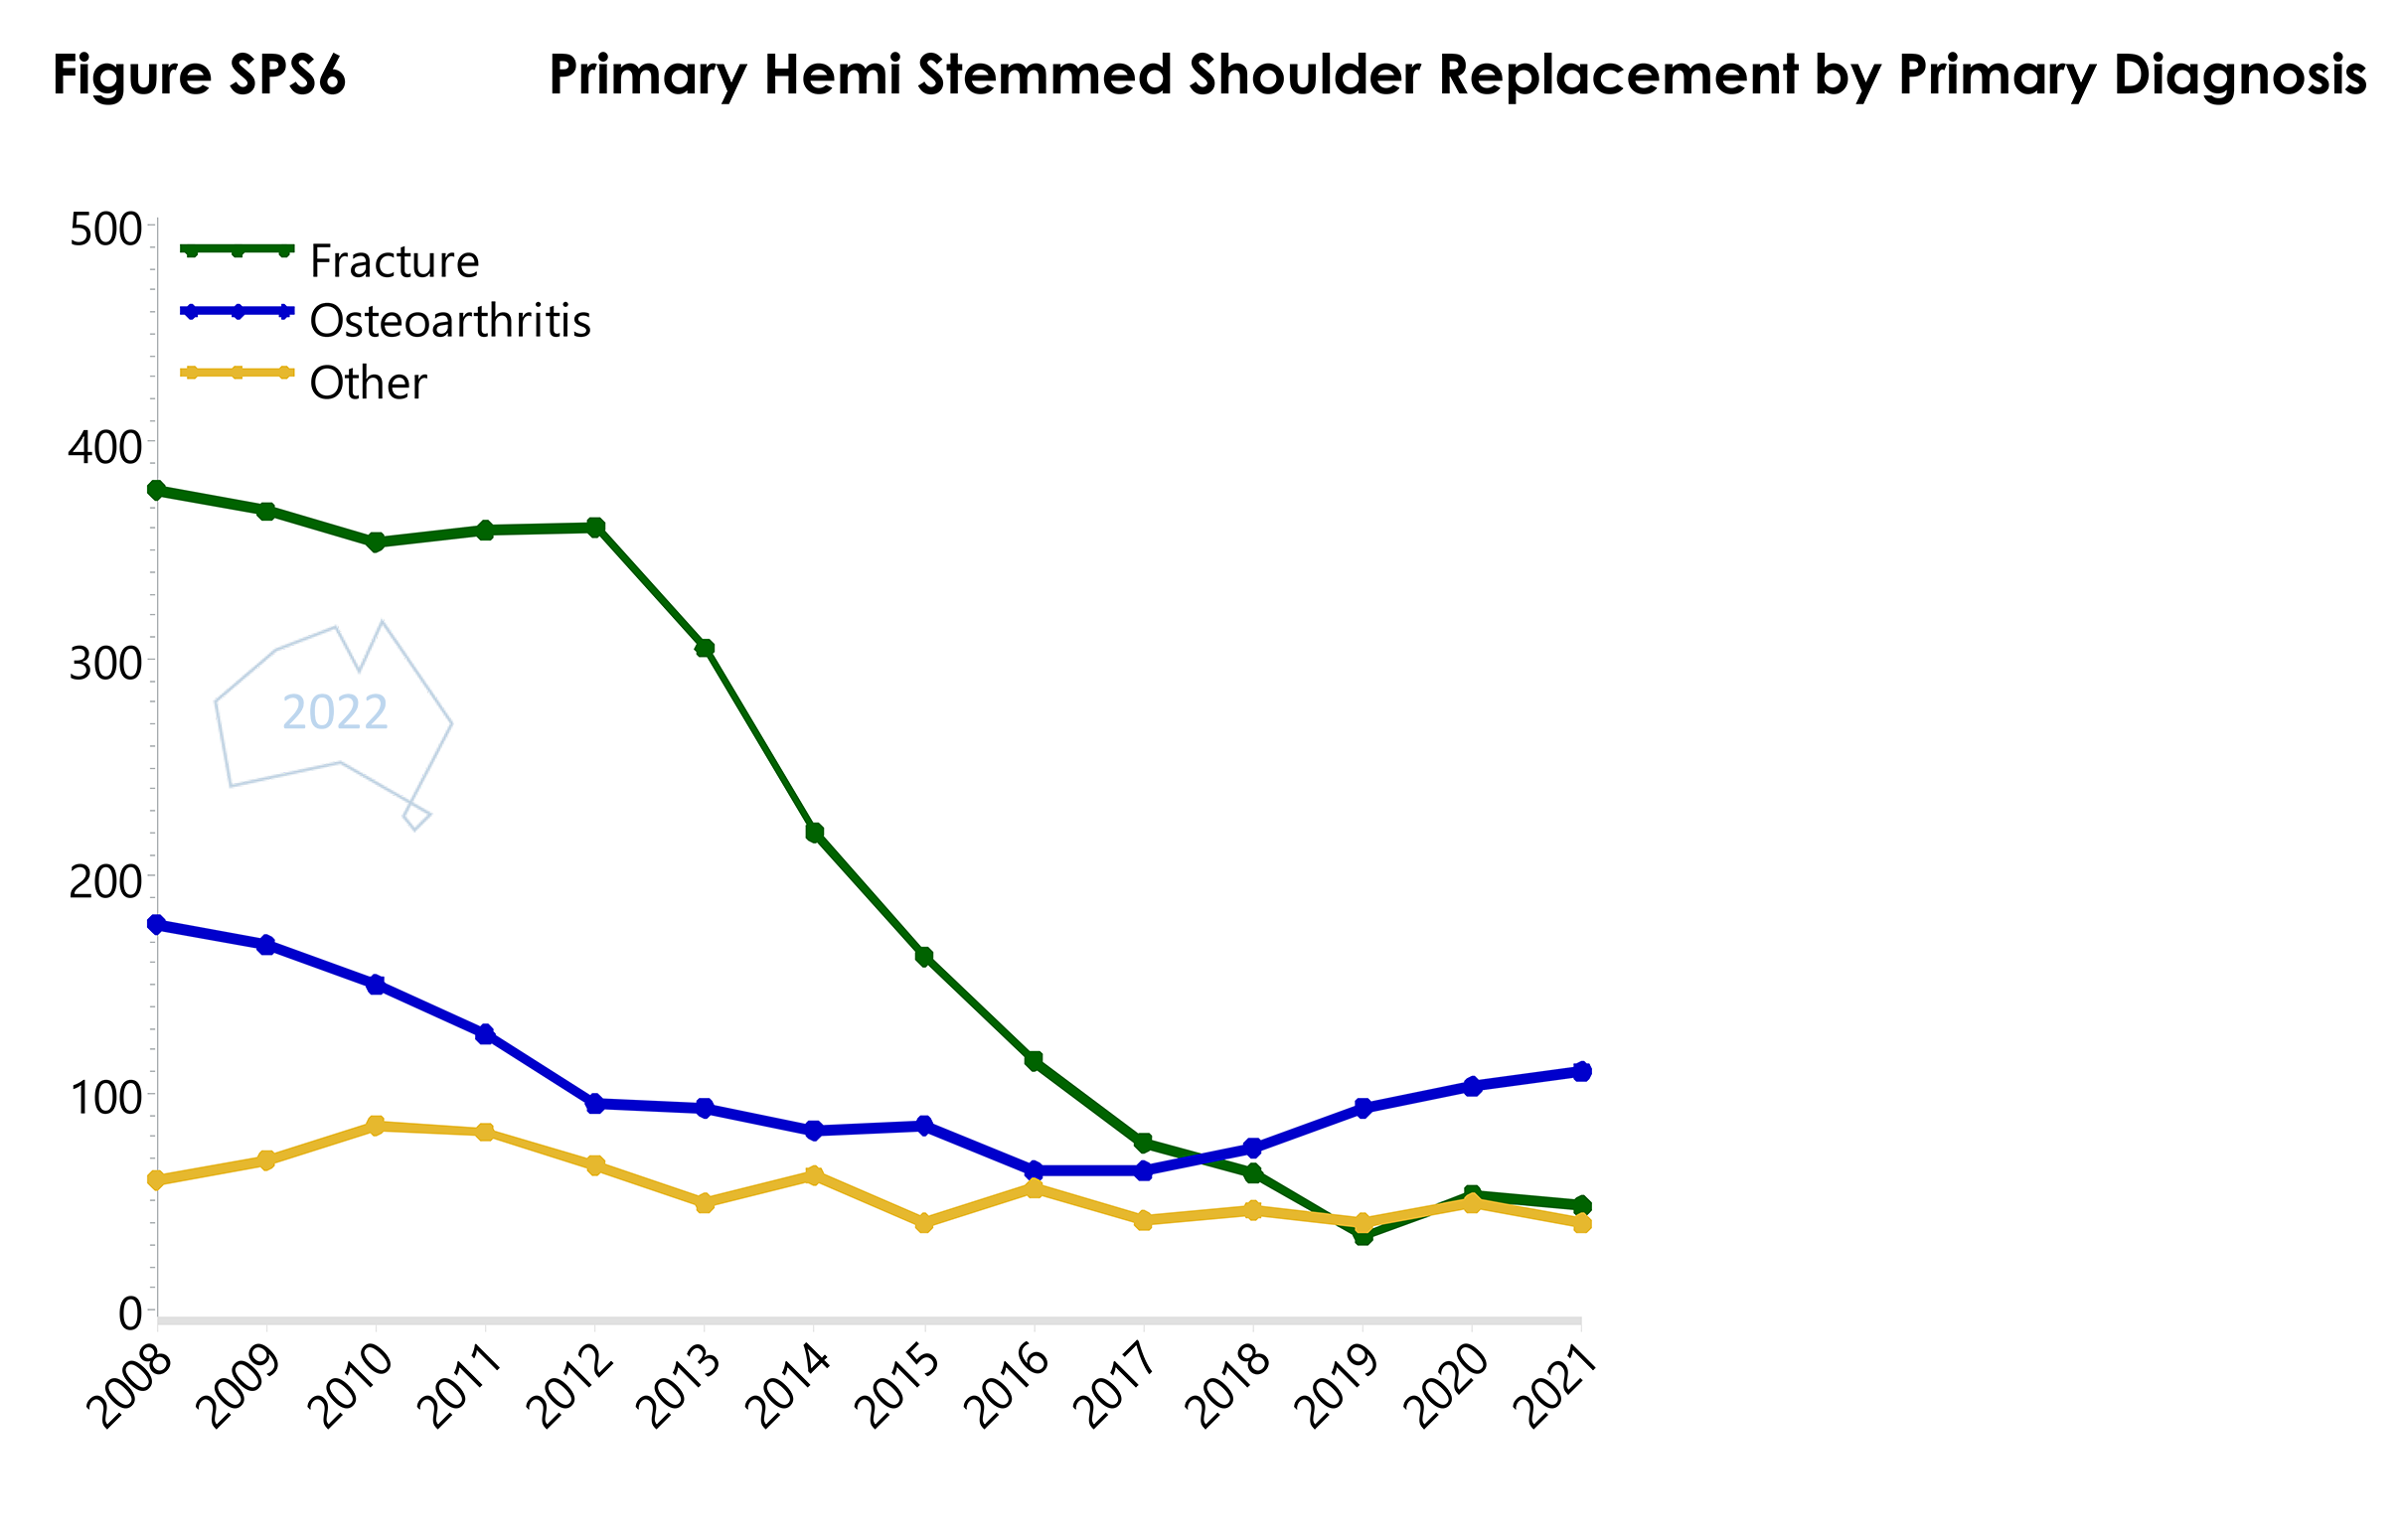
- Figure SPS6Primary Hemi Stemmed Shoulder Replacement by Primary DiagnosisPDF · 42 KB
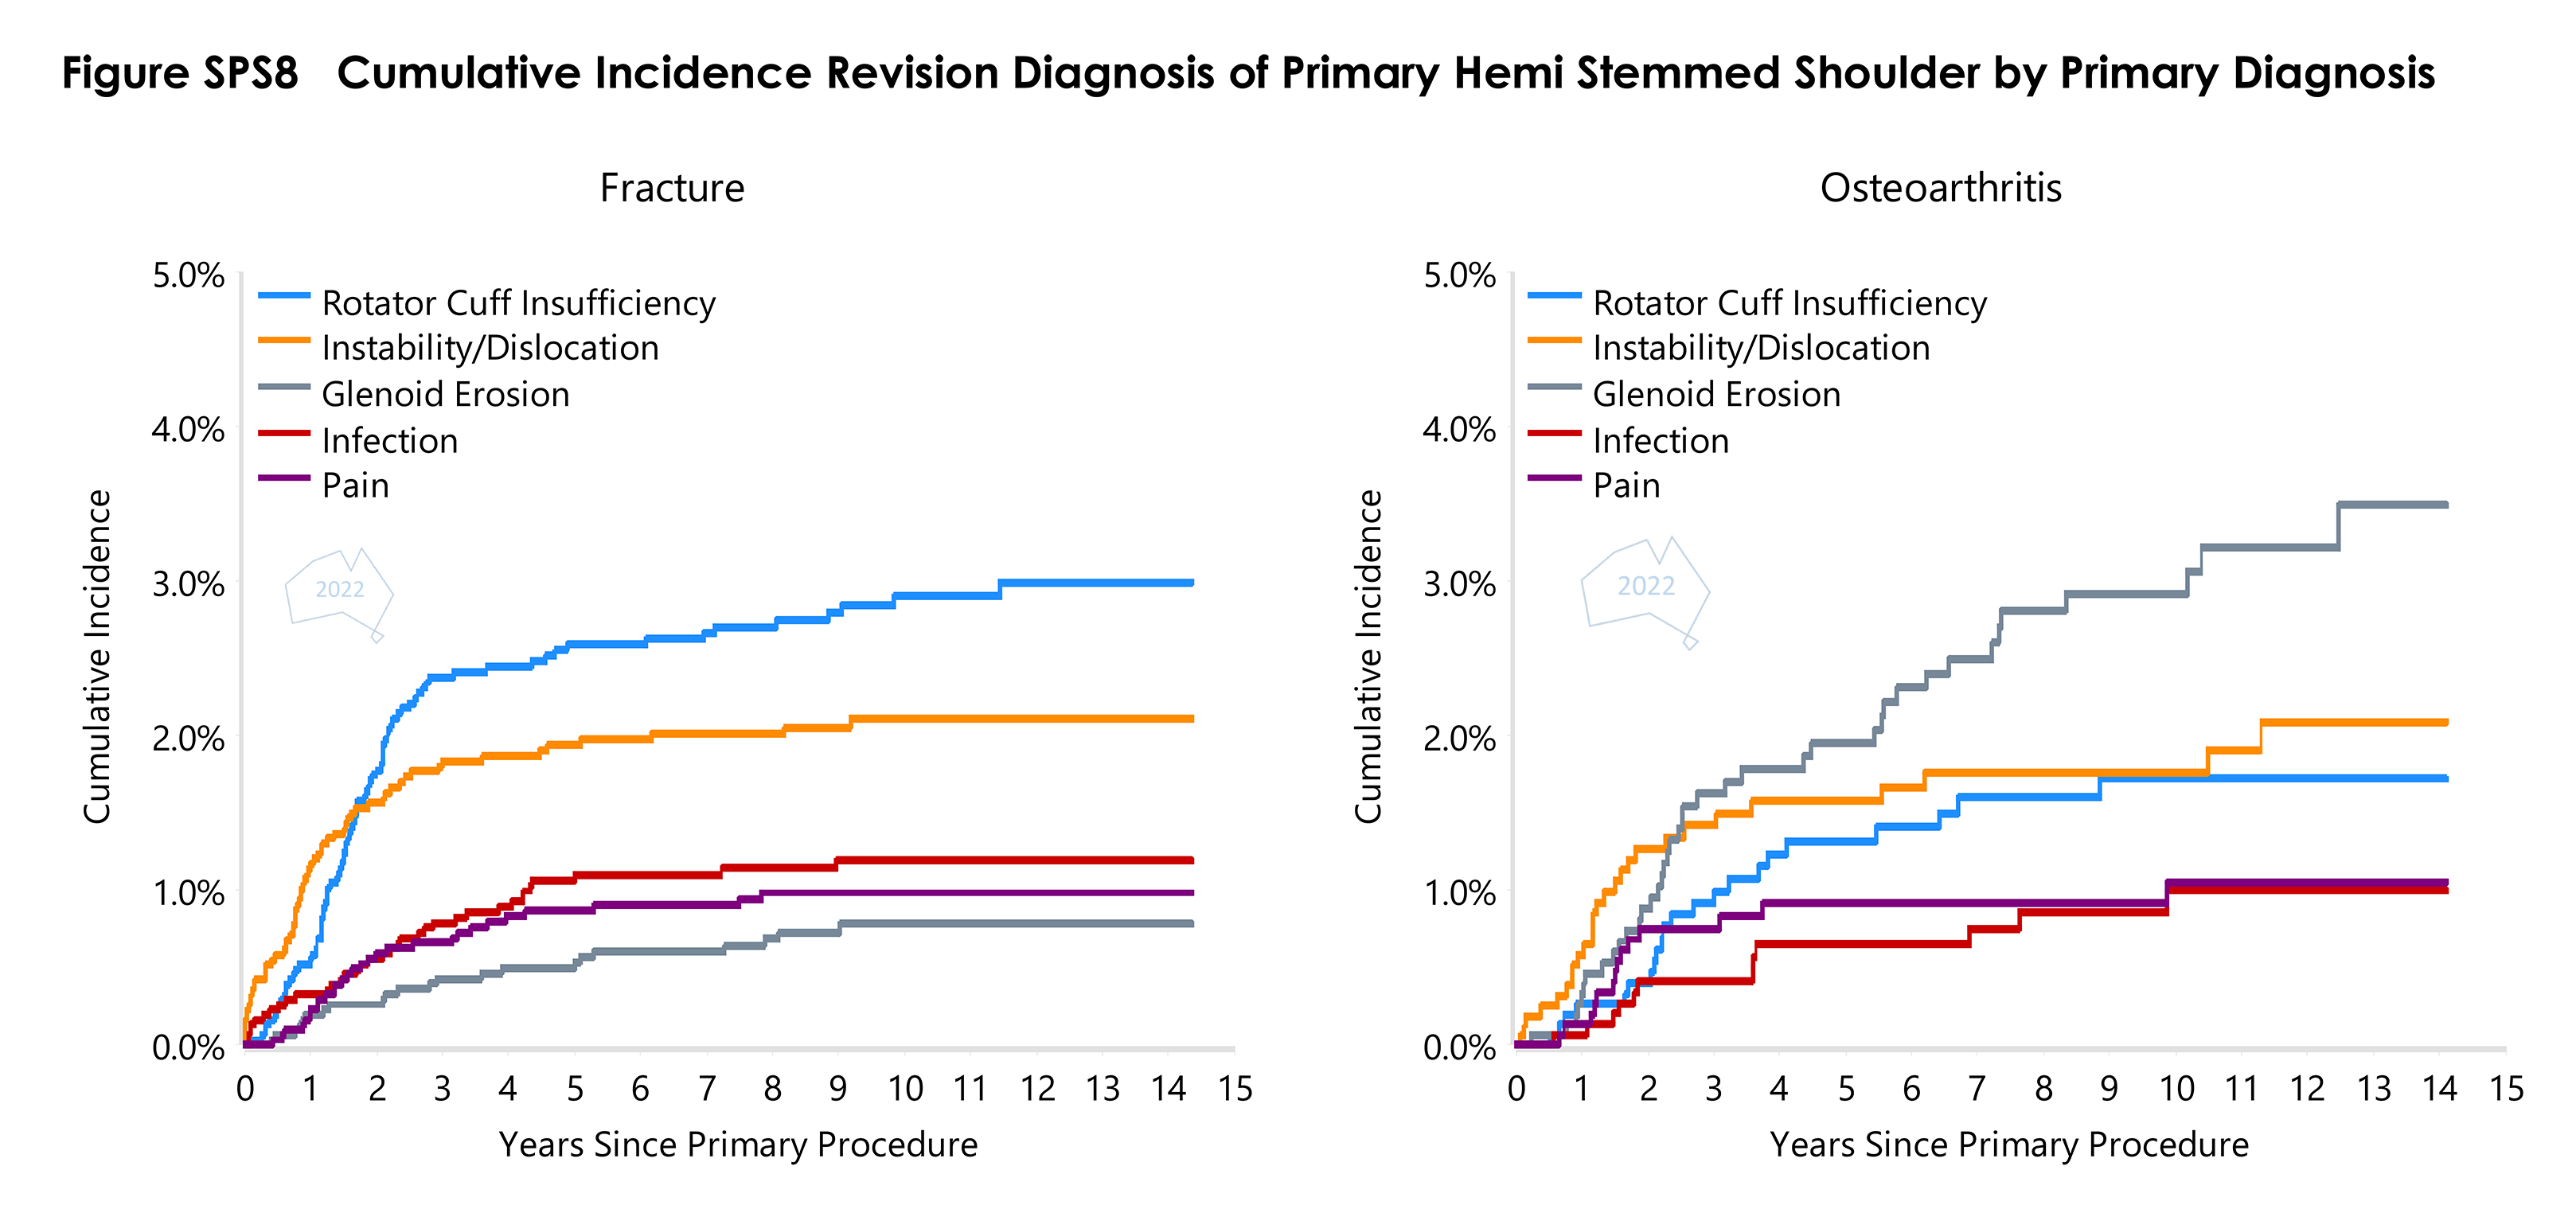
- Figure SPS8 Cumulative Incidence Revision Diagnosis of Primary Hemi Stemmed Shoulder by Primary DiagnosisPDF · 65 KB
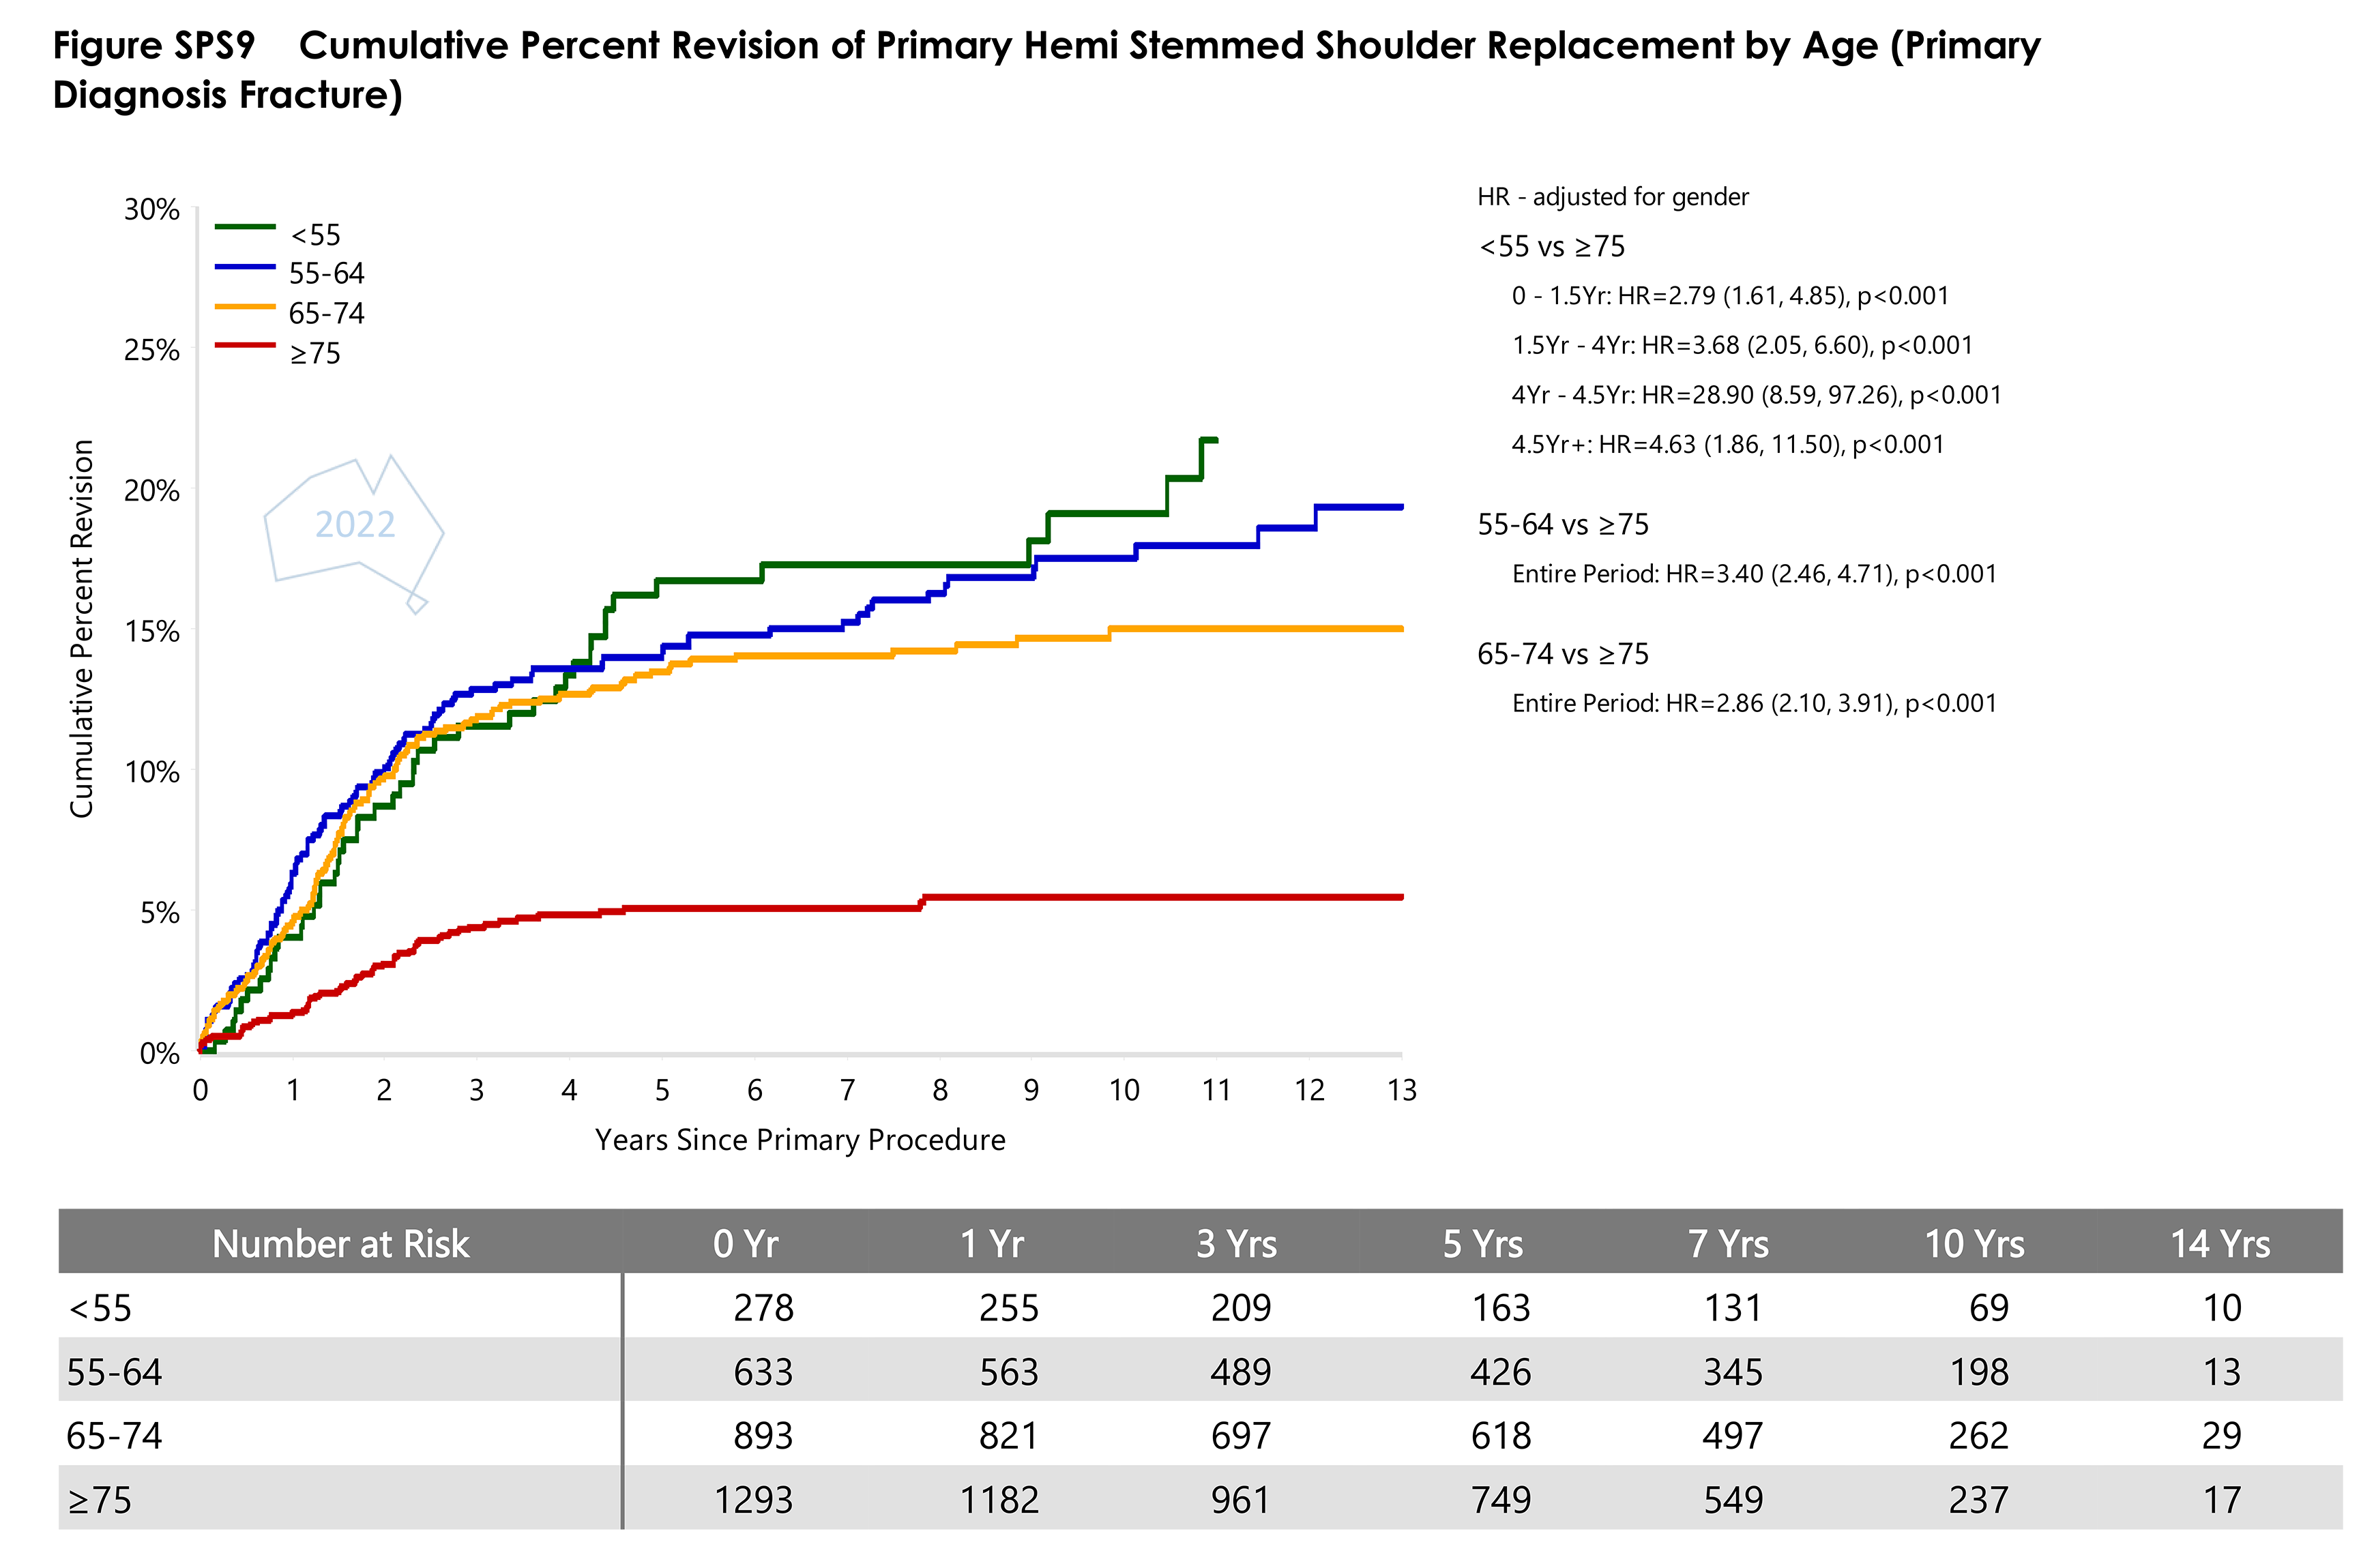
- Figure SPS9 Cumulative Percent Revision of Primary Hemi Stemmed Shoulder Replacement by AgePDF · 83 KB
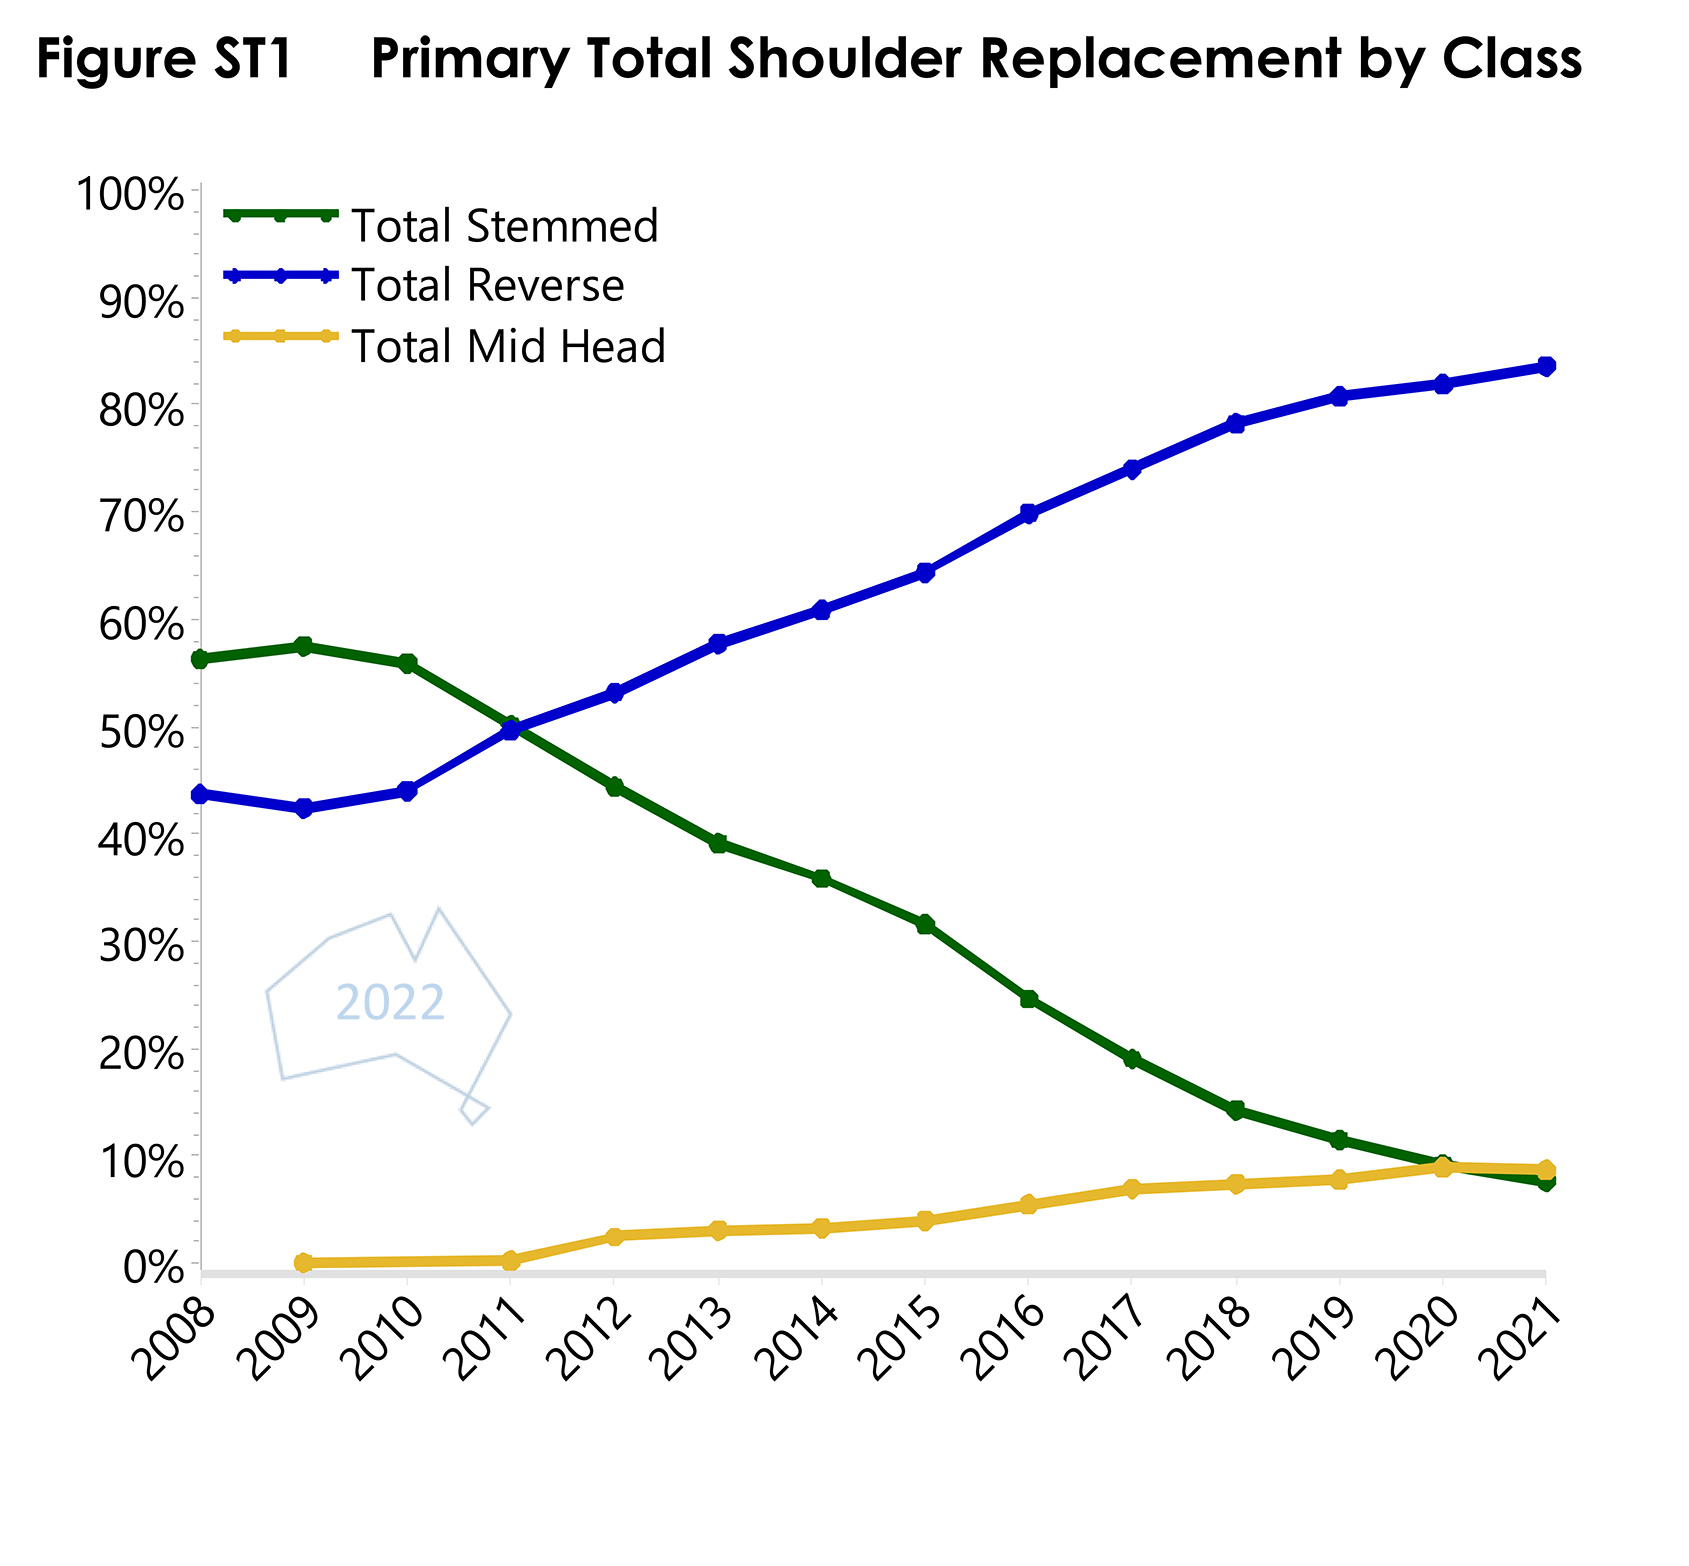
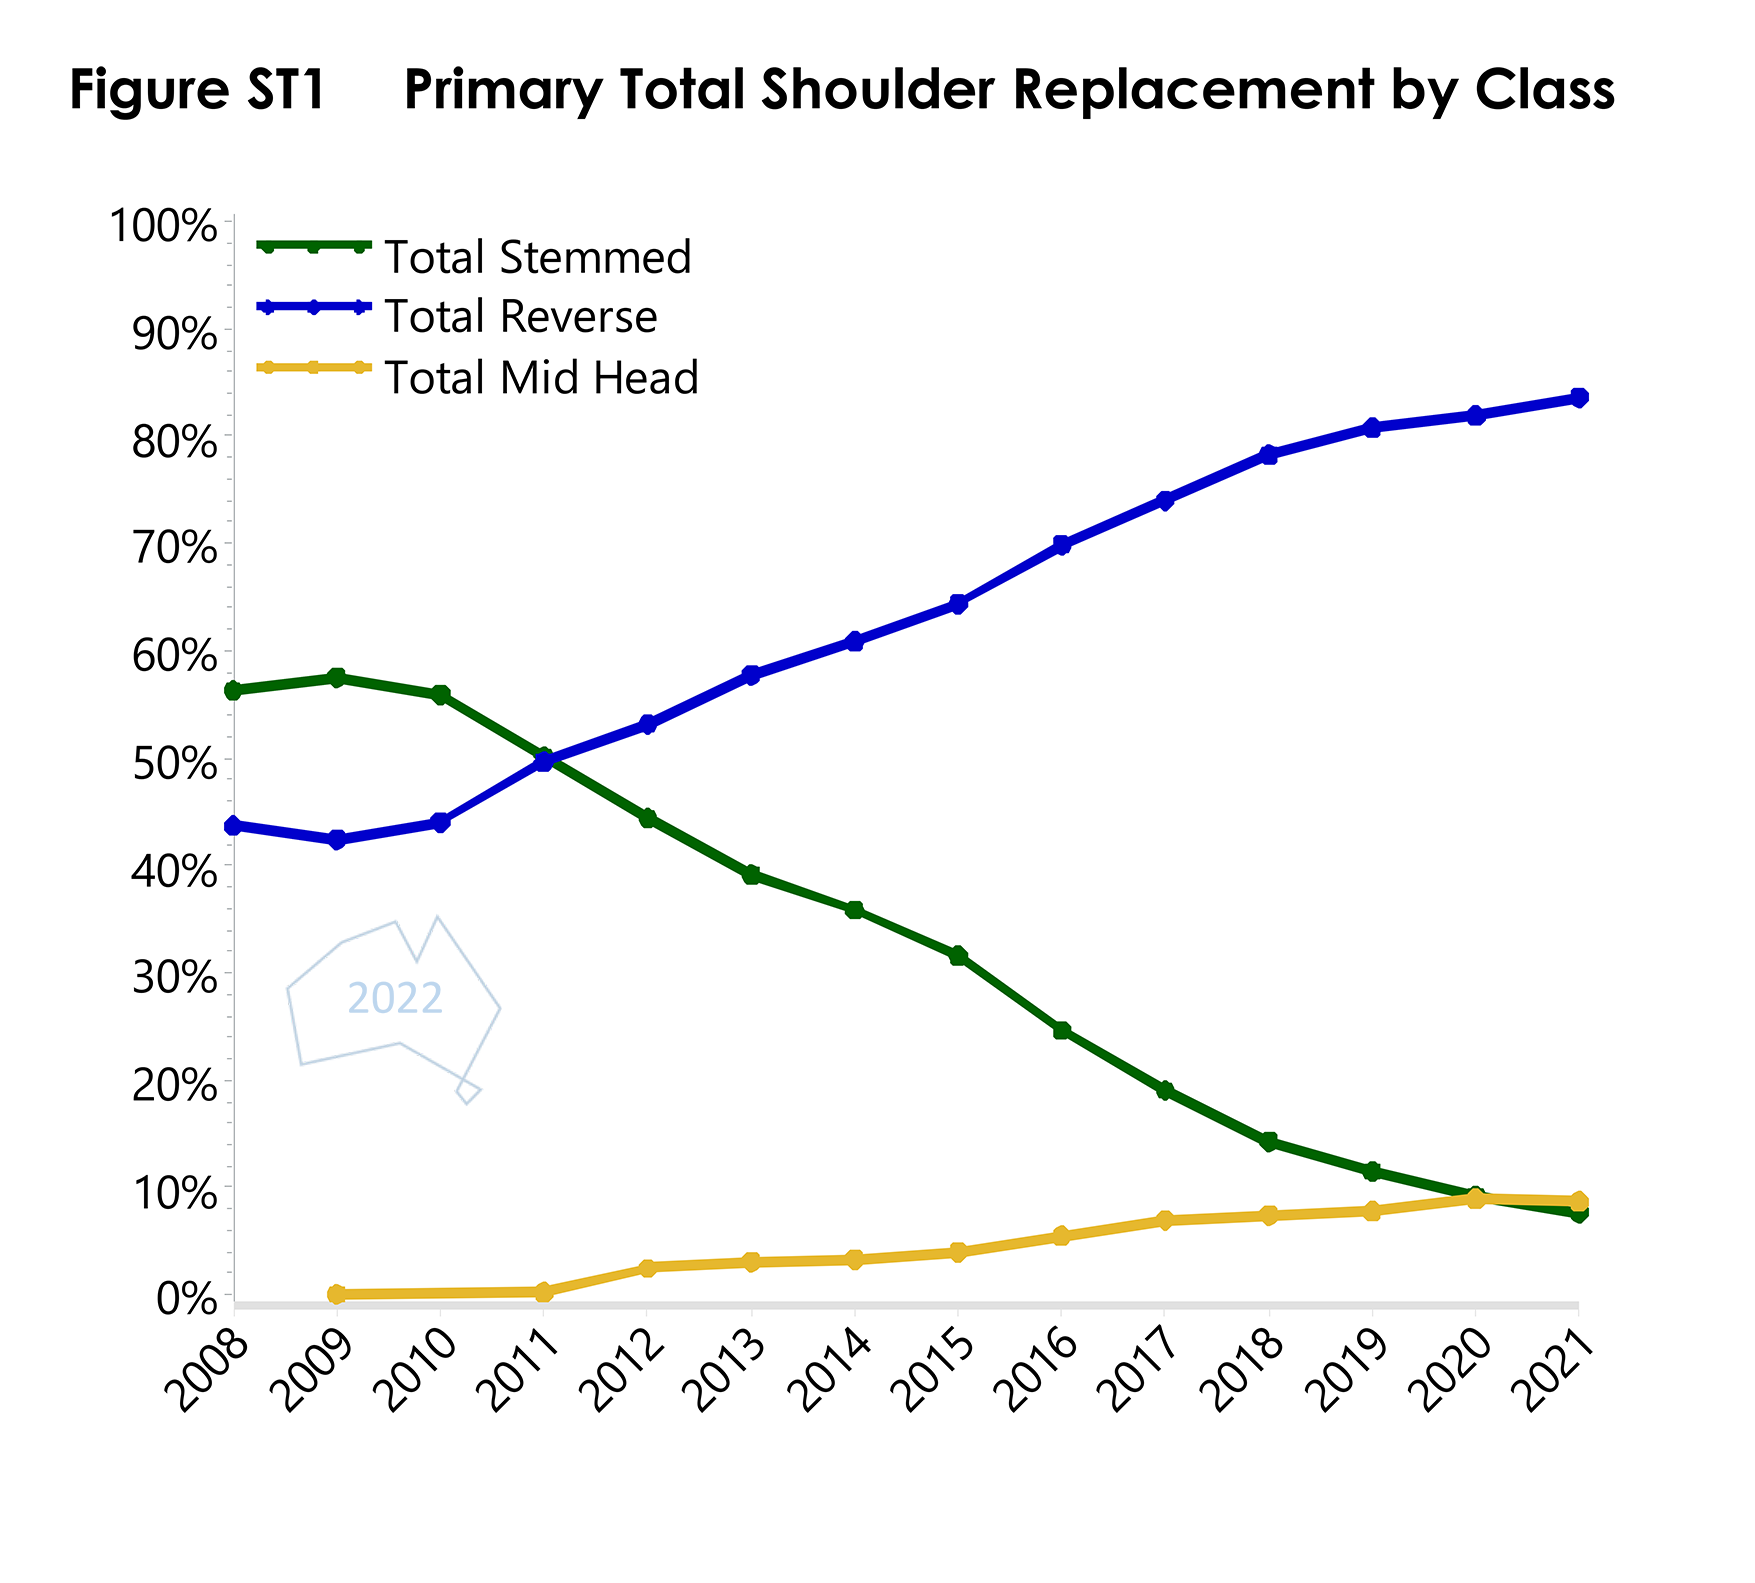
- Figure ST1 Primary Total Shoulder Replacement by ClassPDF · 44 KB
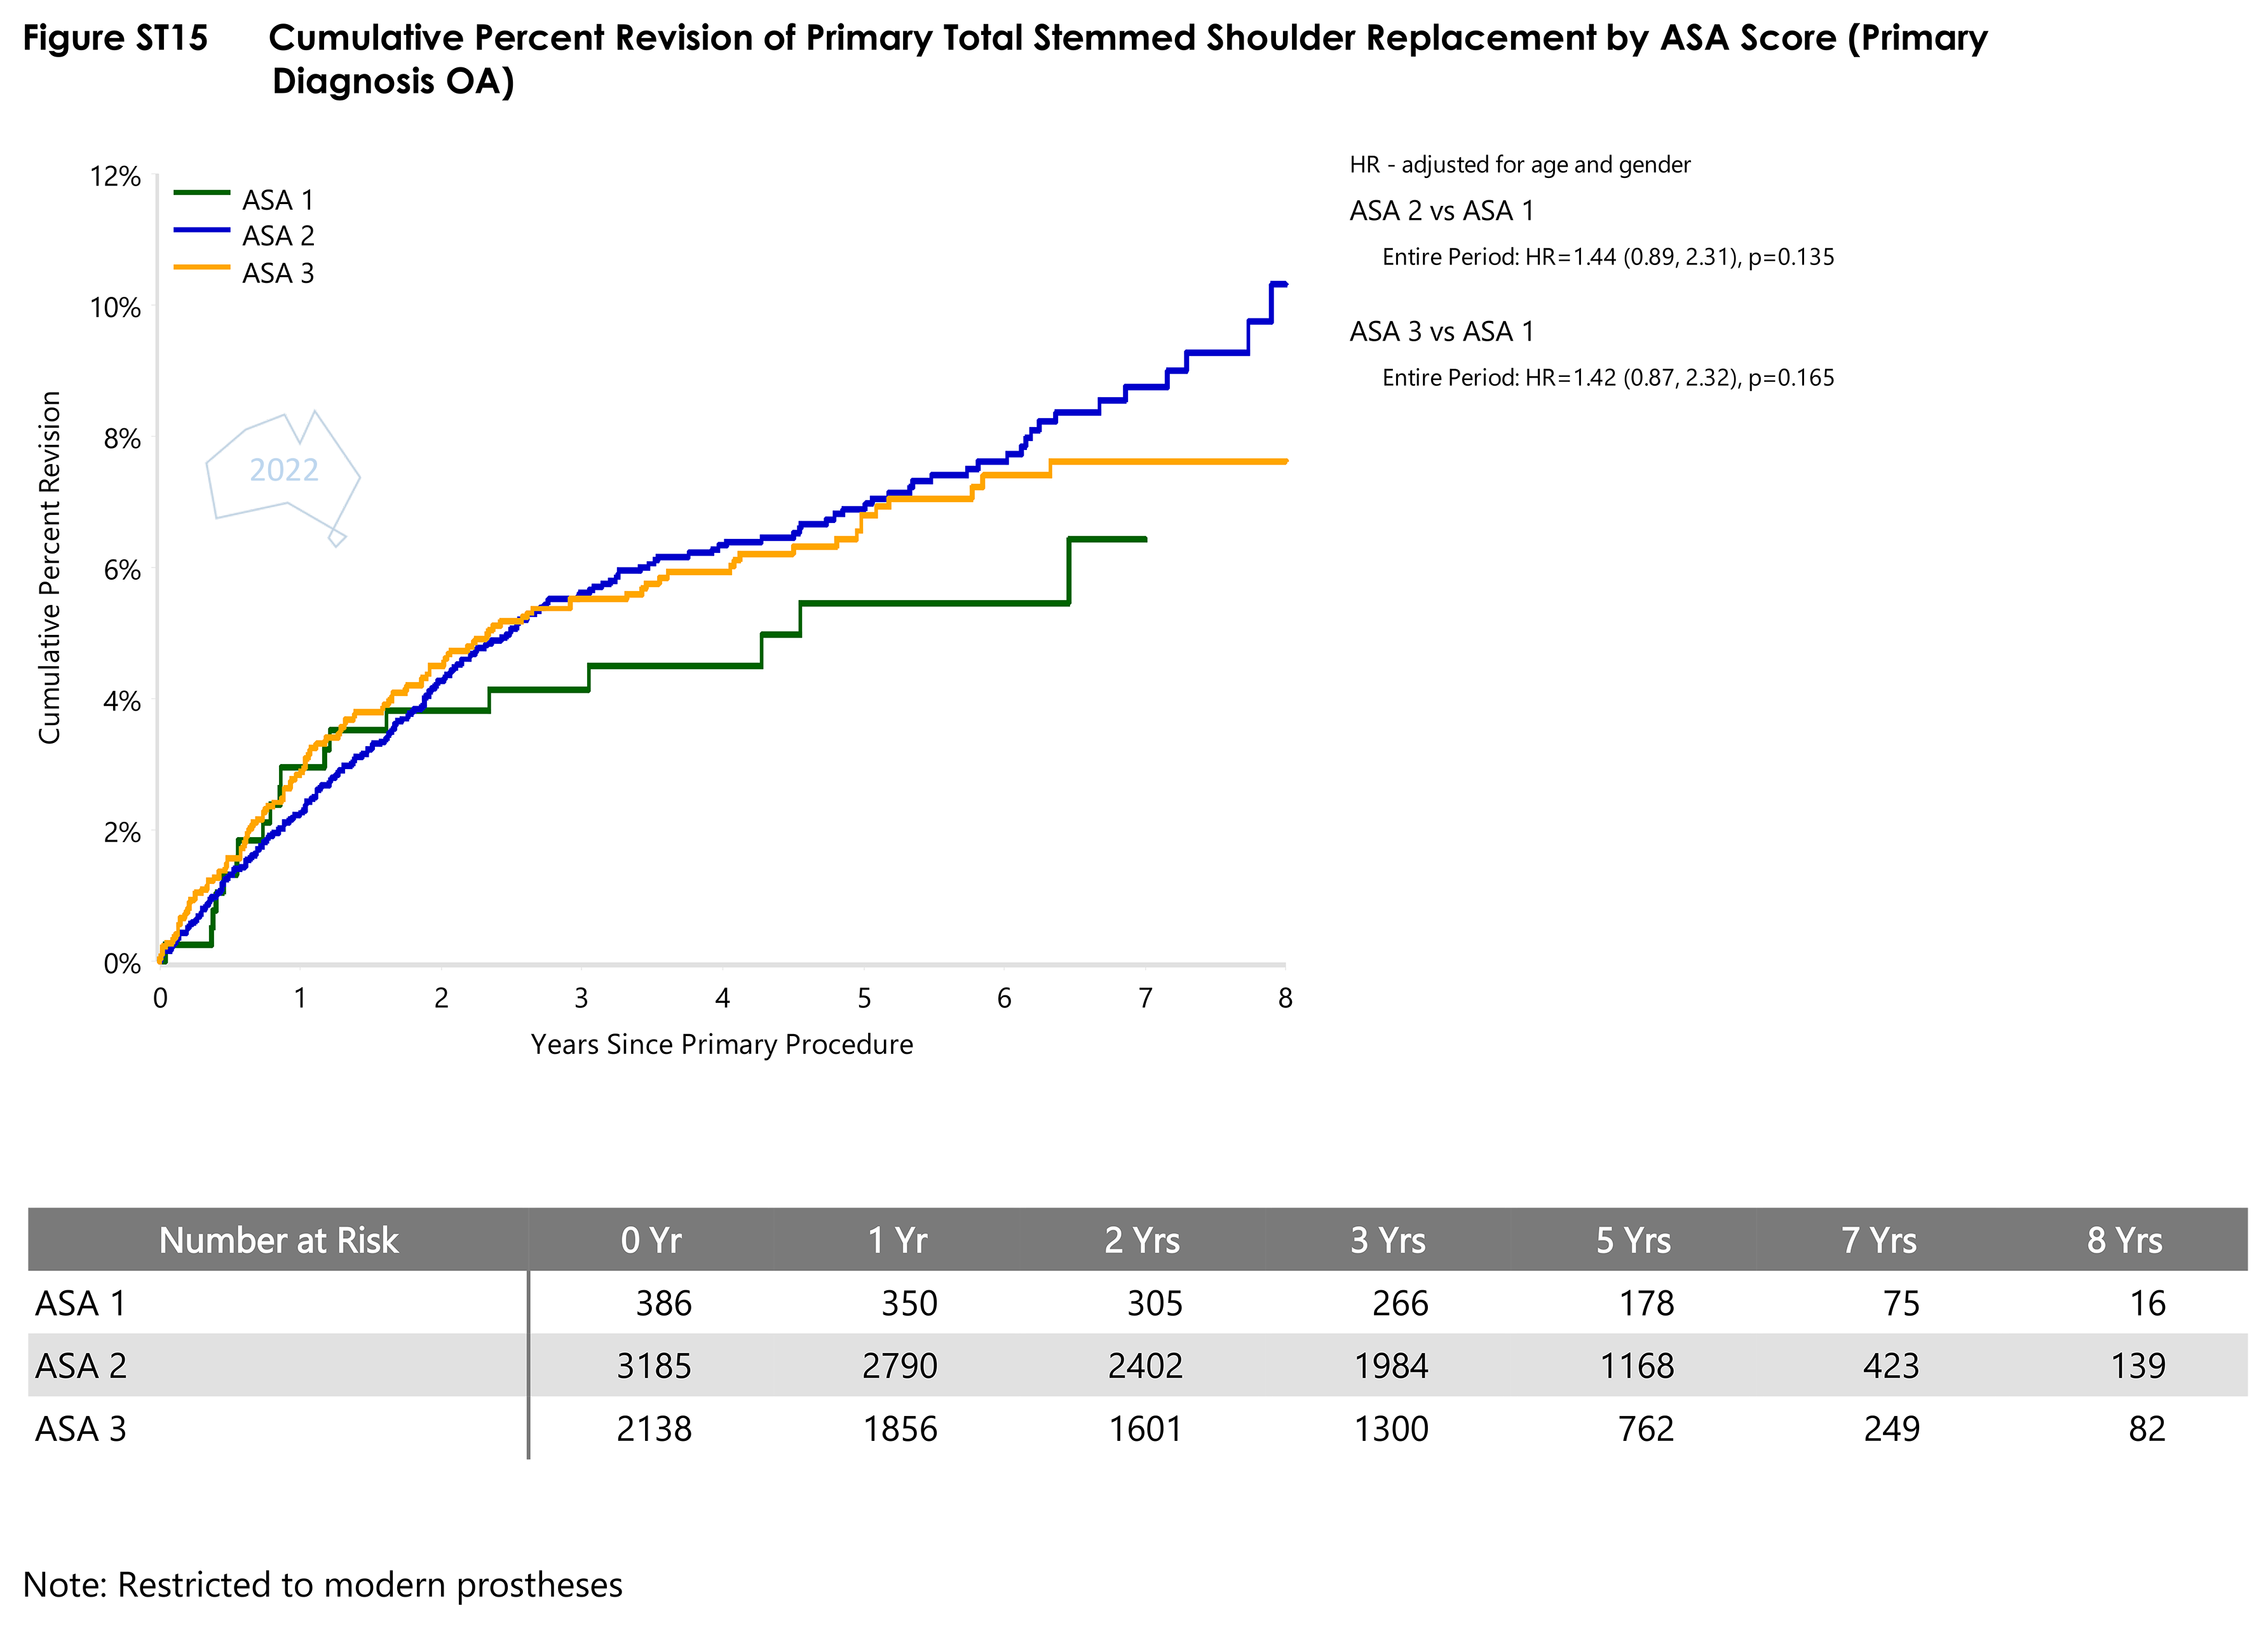
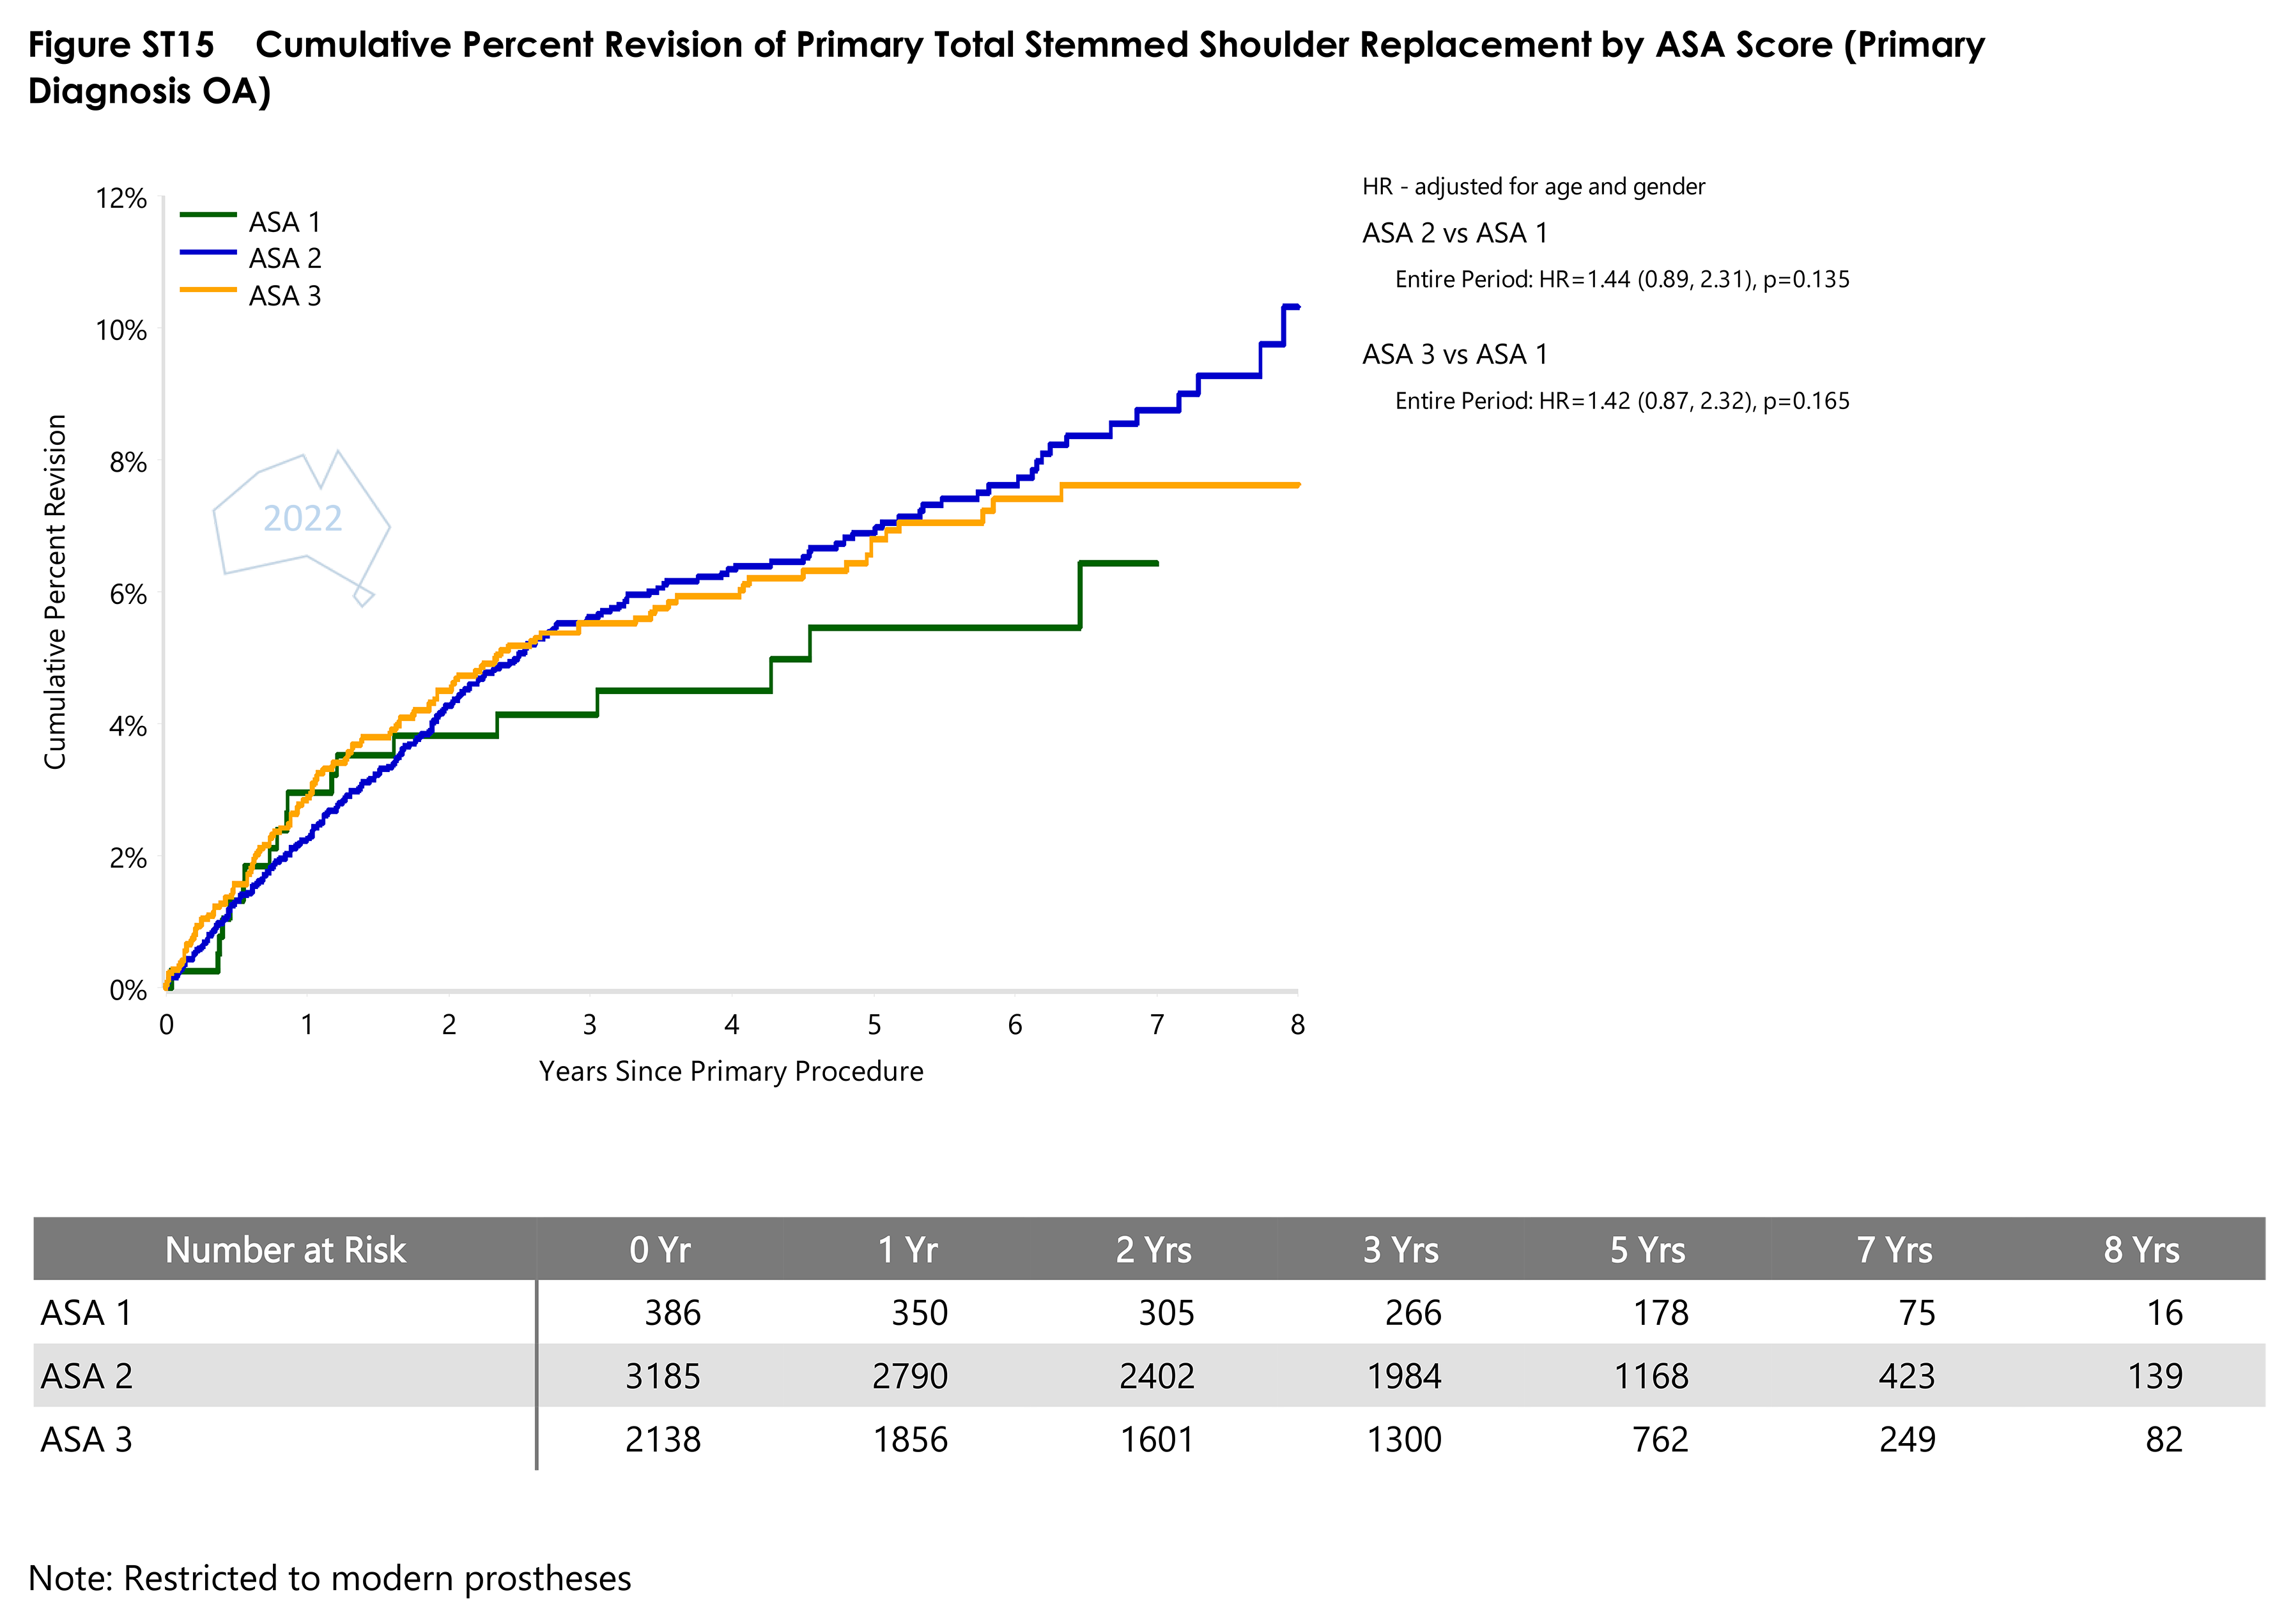
- Figure ST15 Cumulative Percent Revision of Primary Total Stemmed Shoulder Replacement by ASA ScorePDF · 70 KB
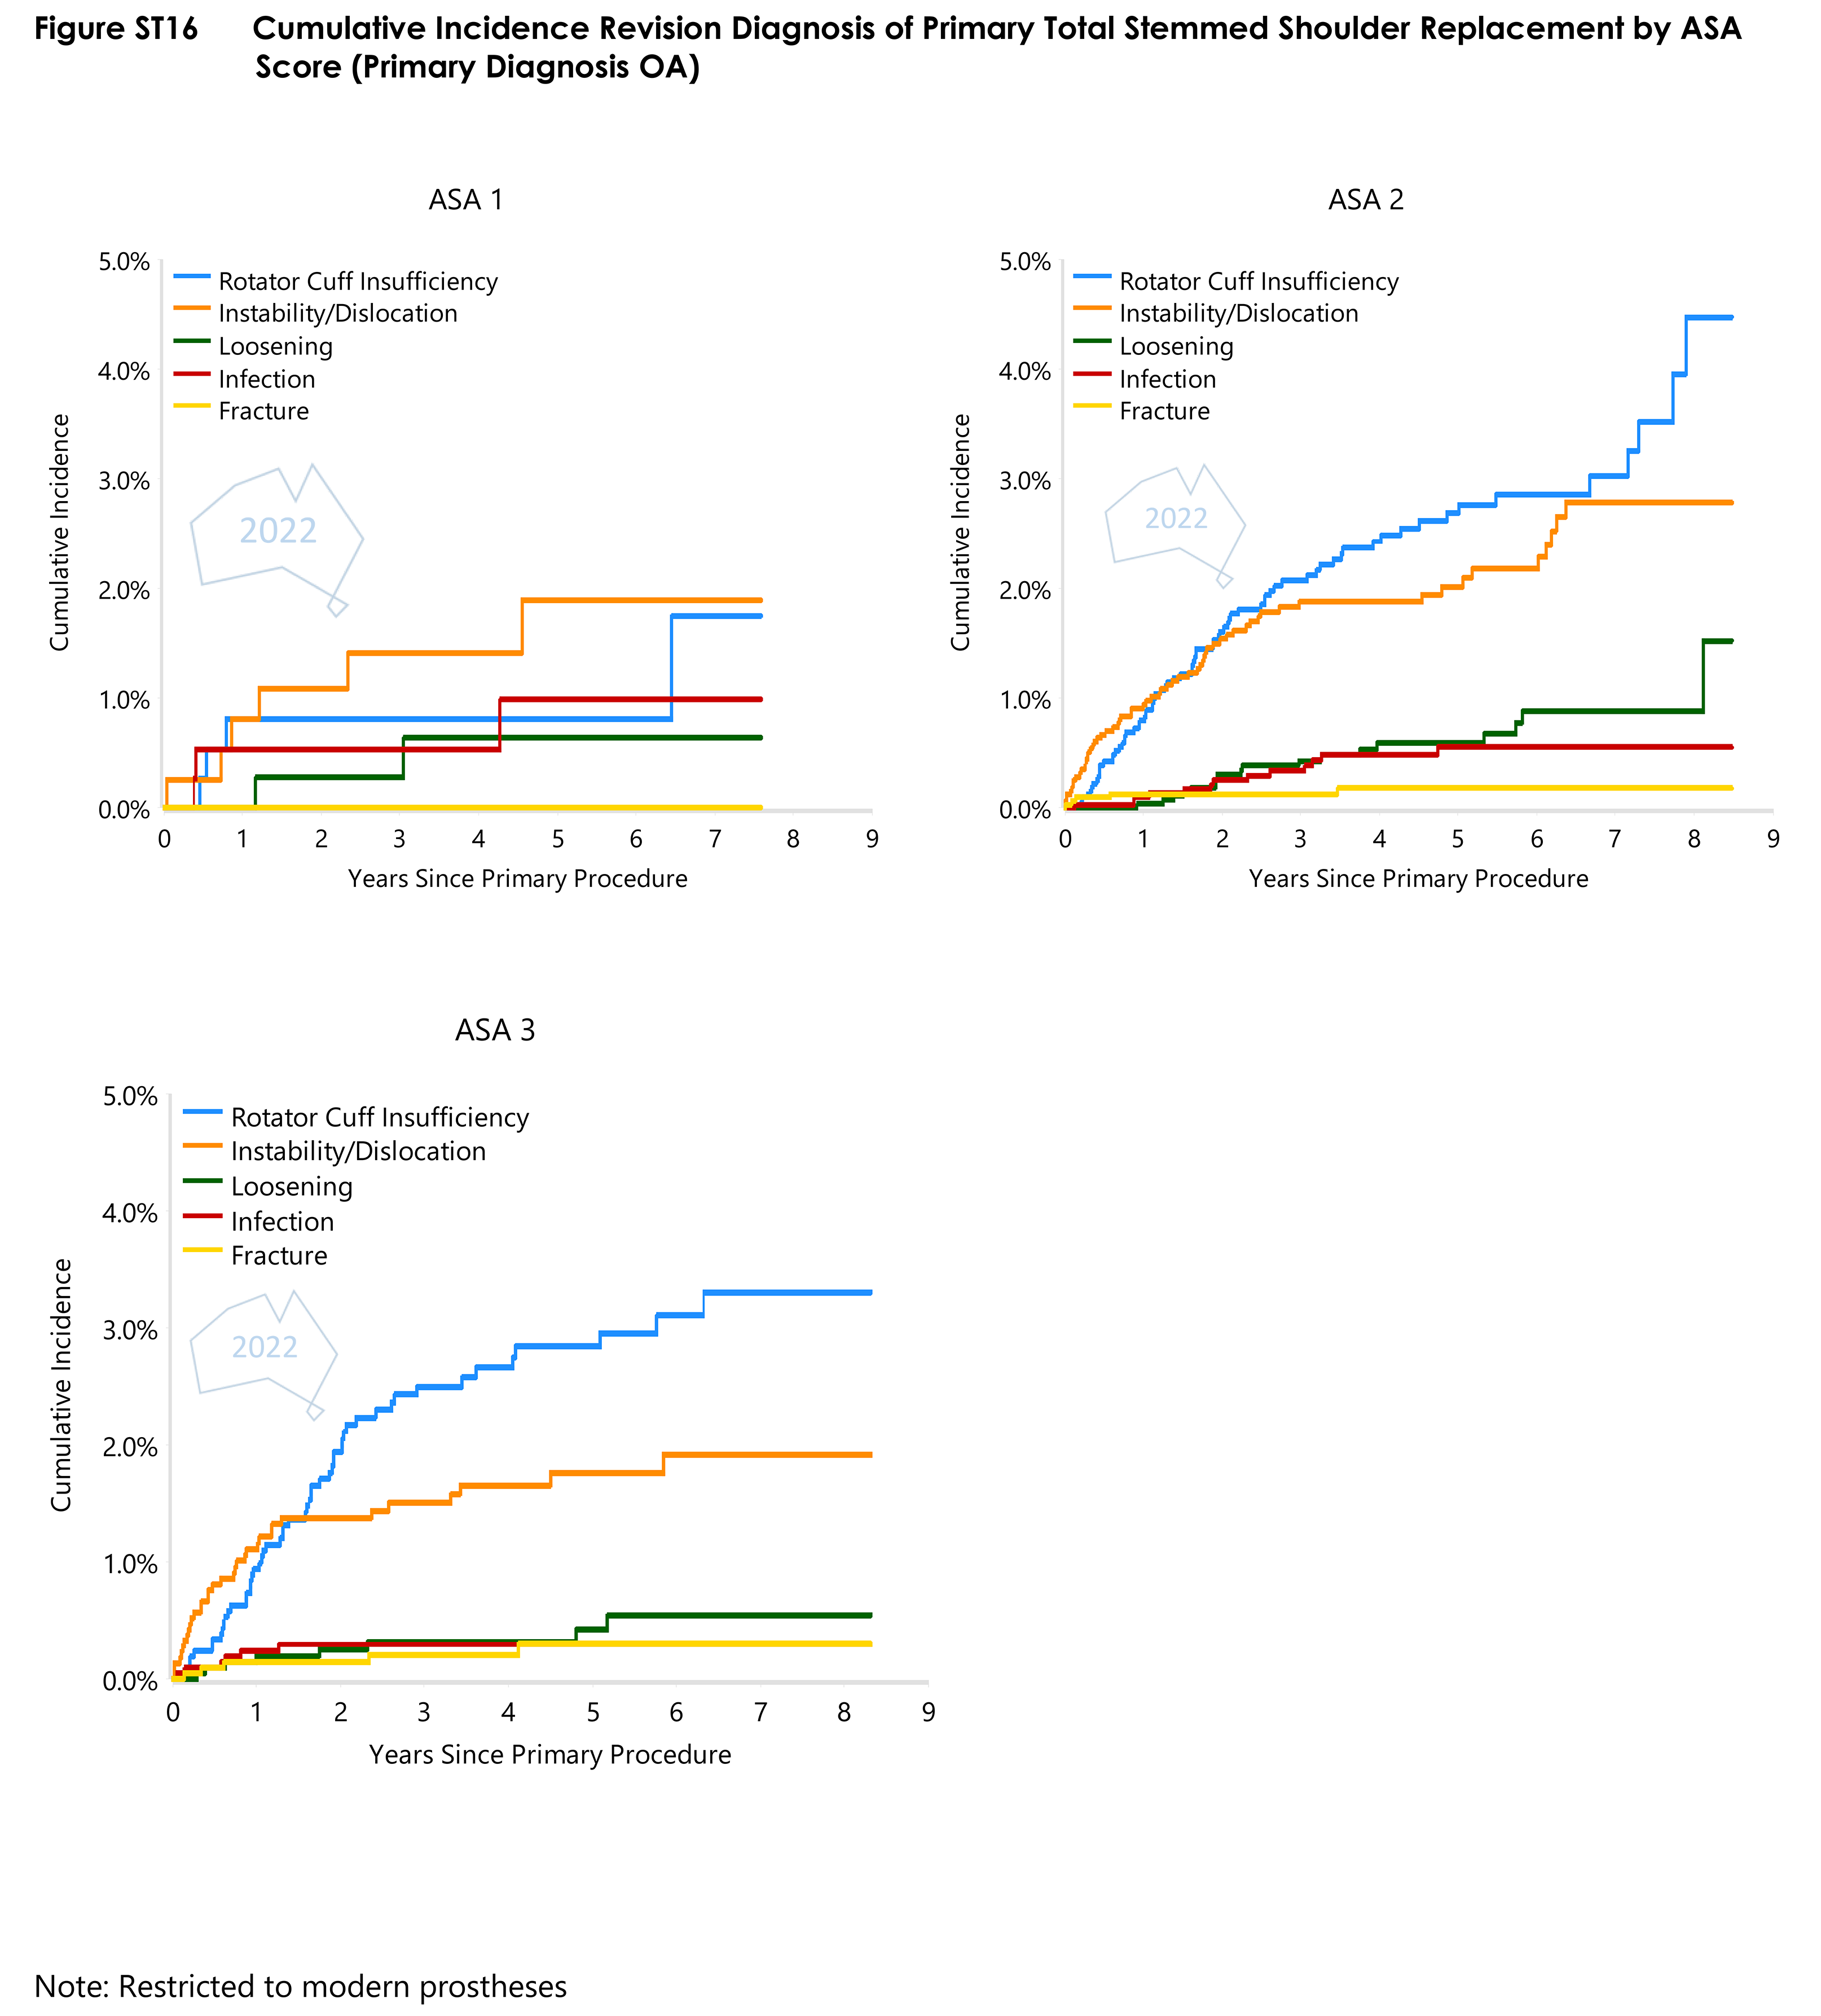
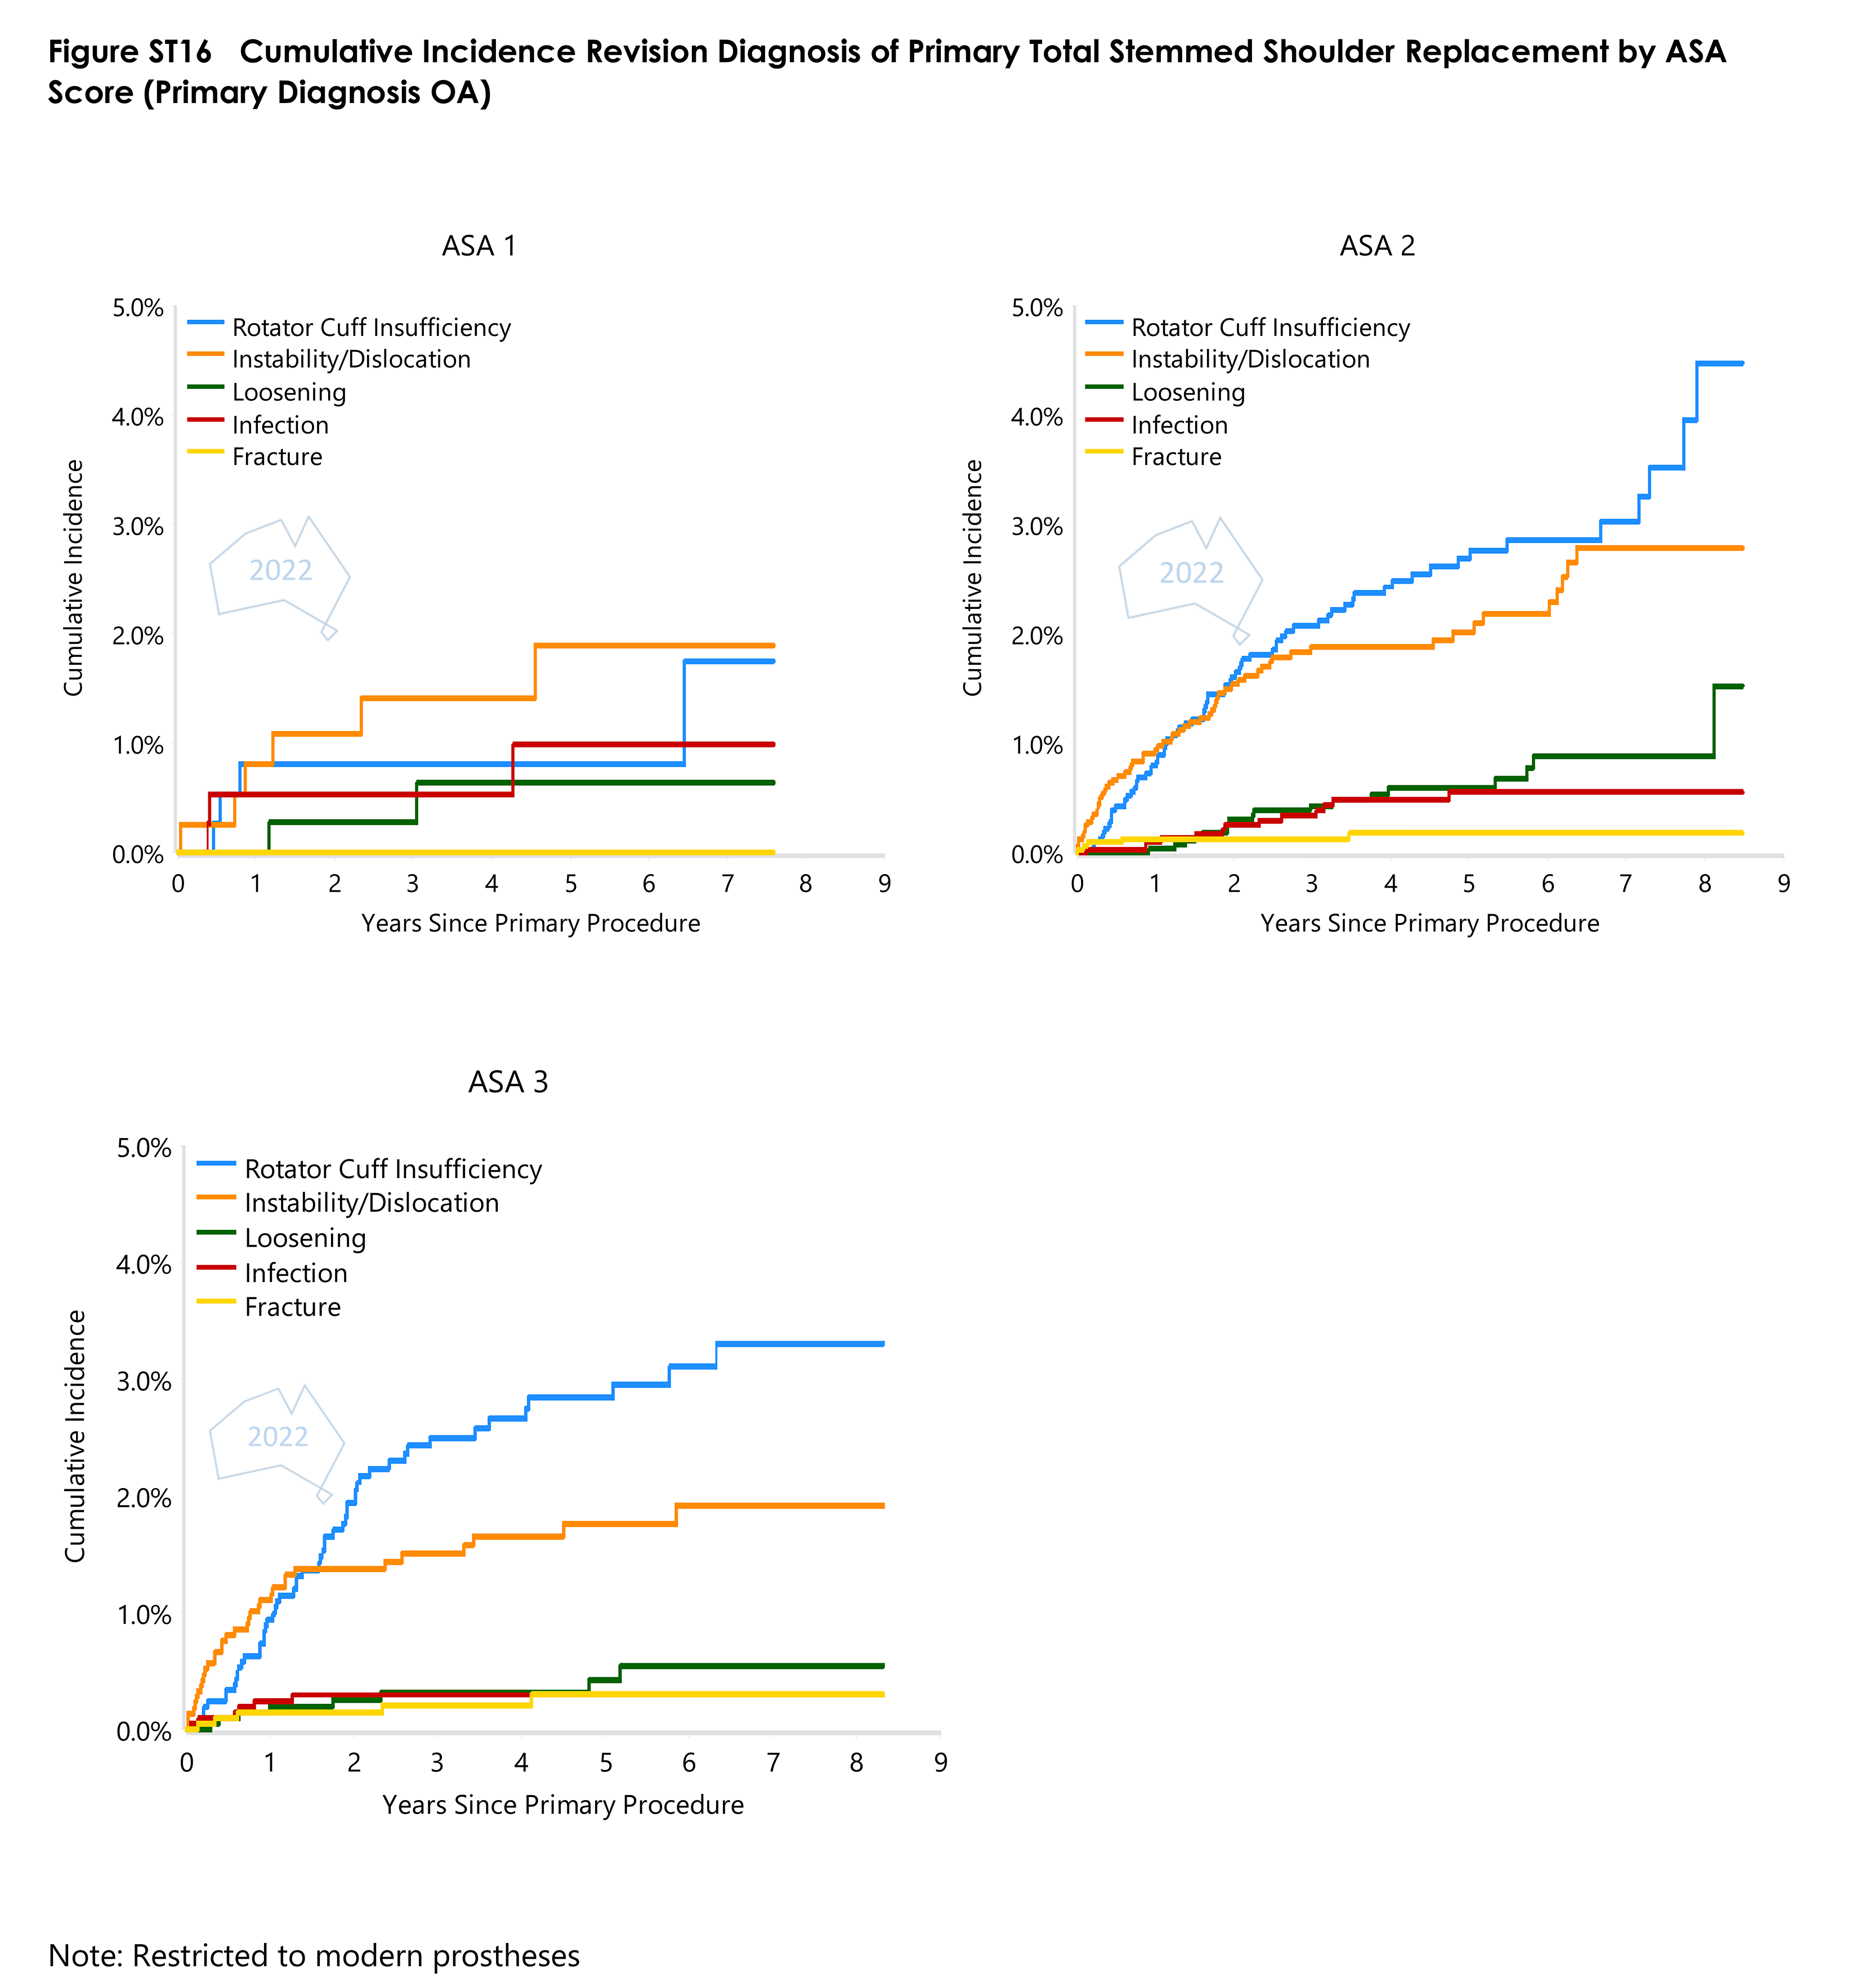
- Figure ST16 Cumulative Incidence Revision Diagnosis of Primary Total Stemmed Shoulder Replacement by ASA ScorePDF · 65 KB
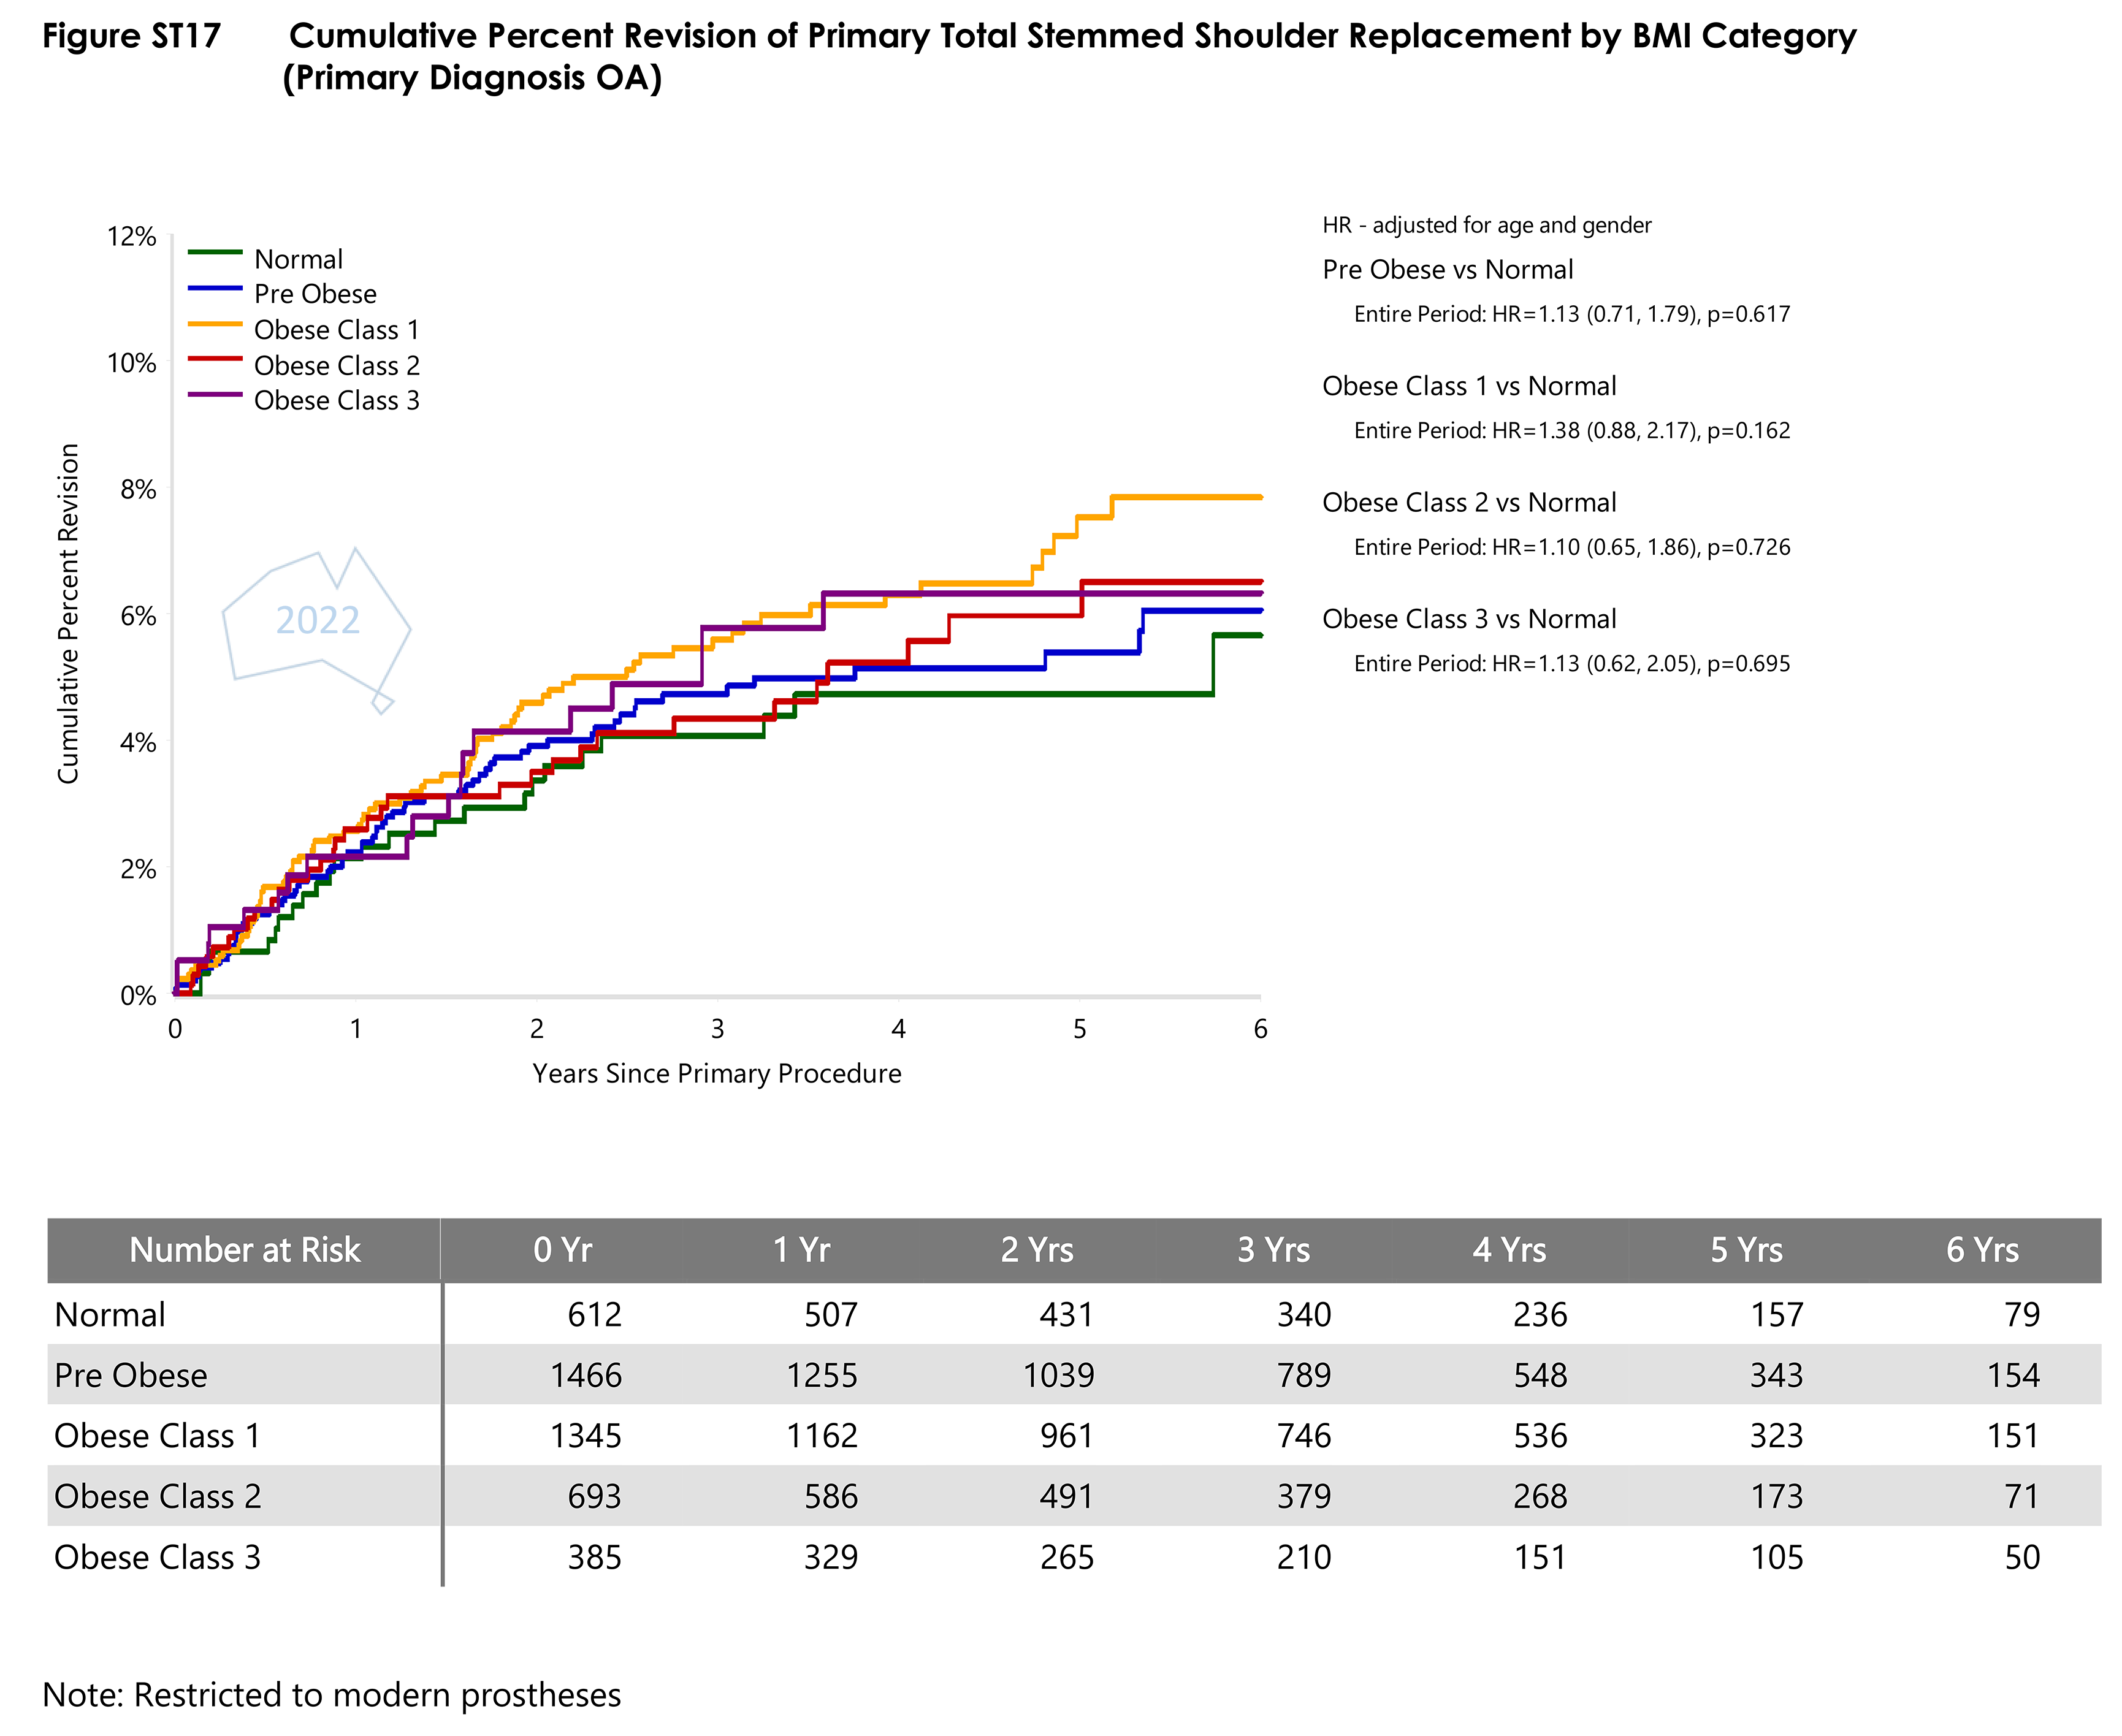
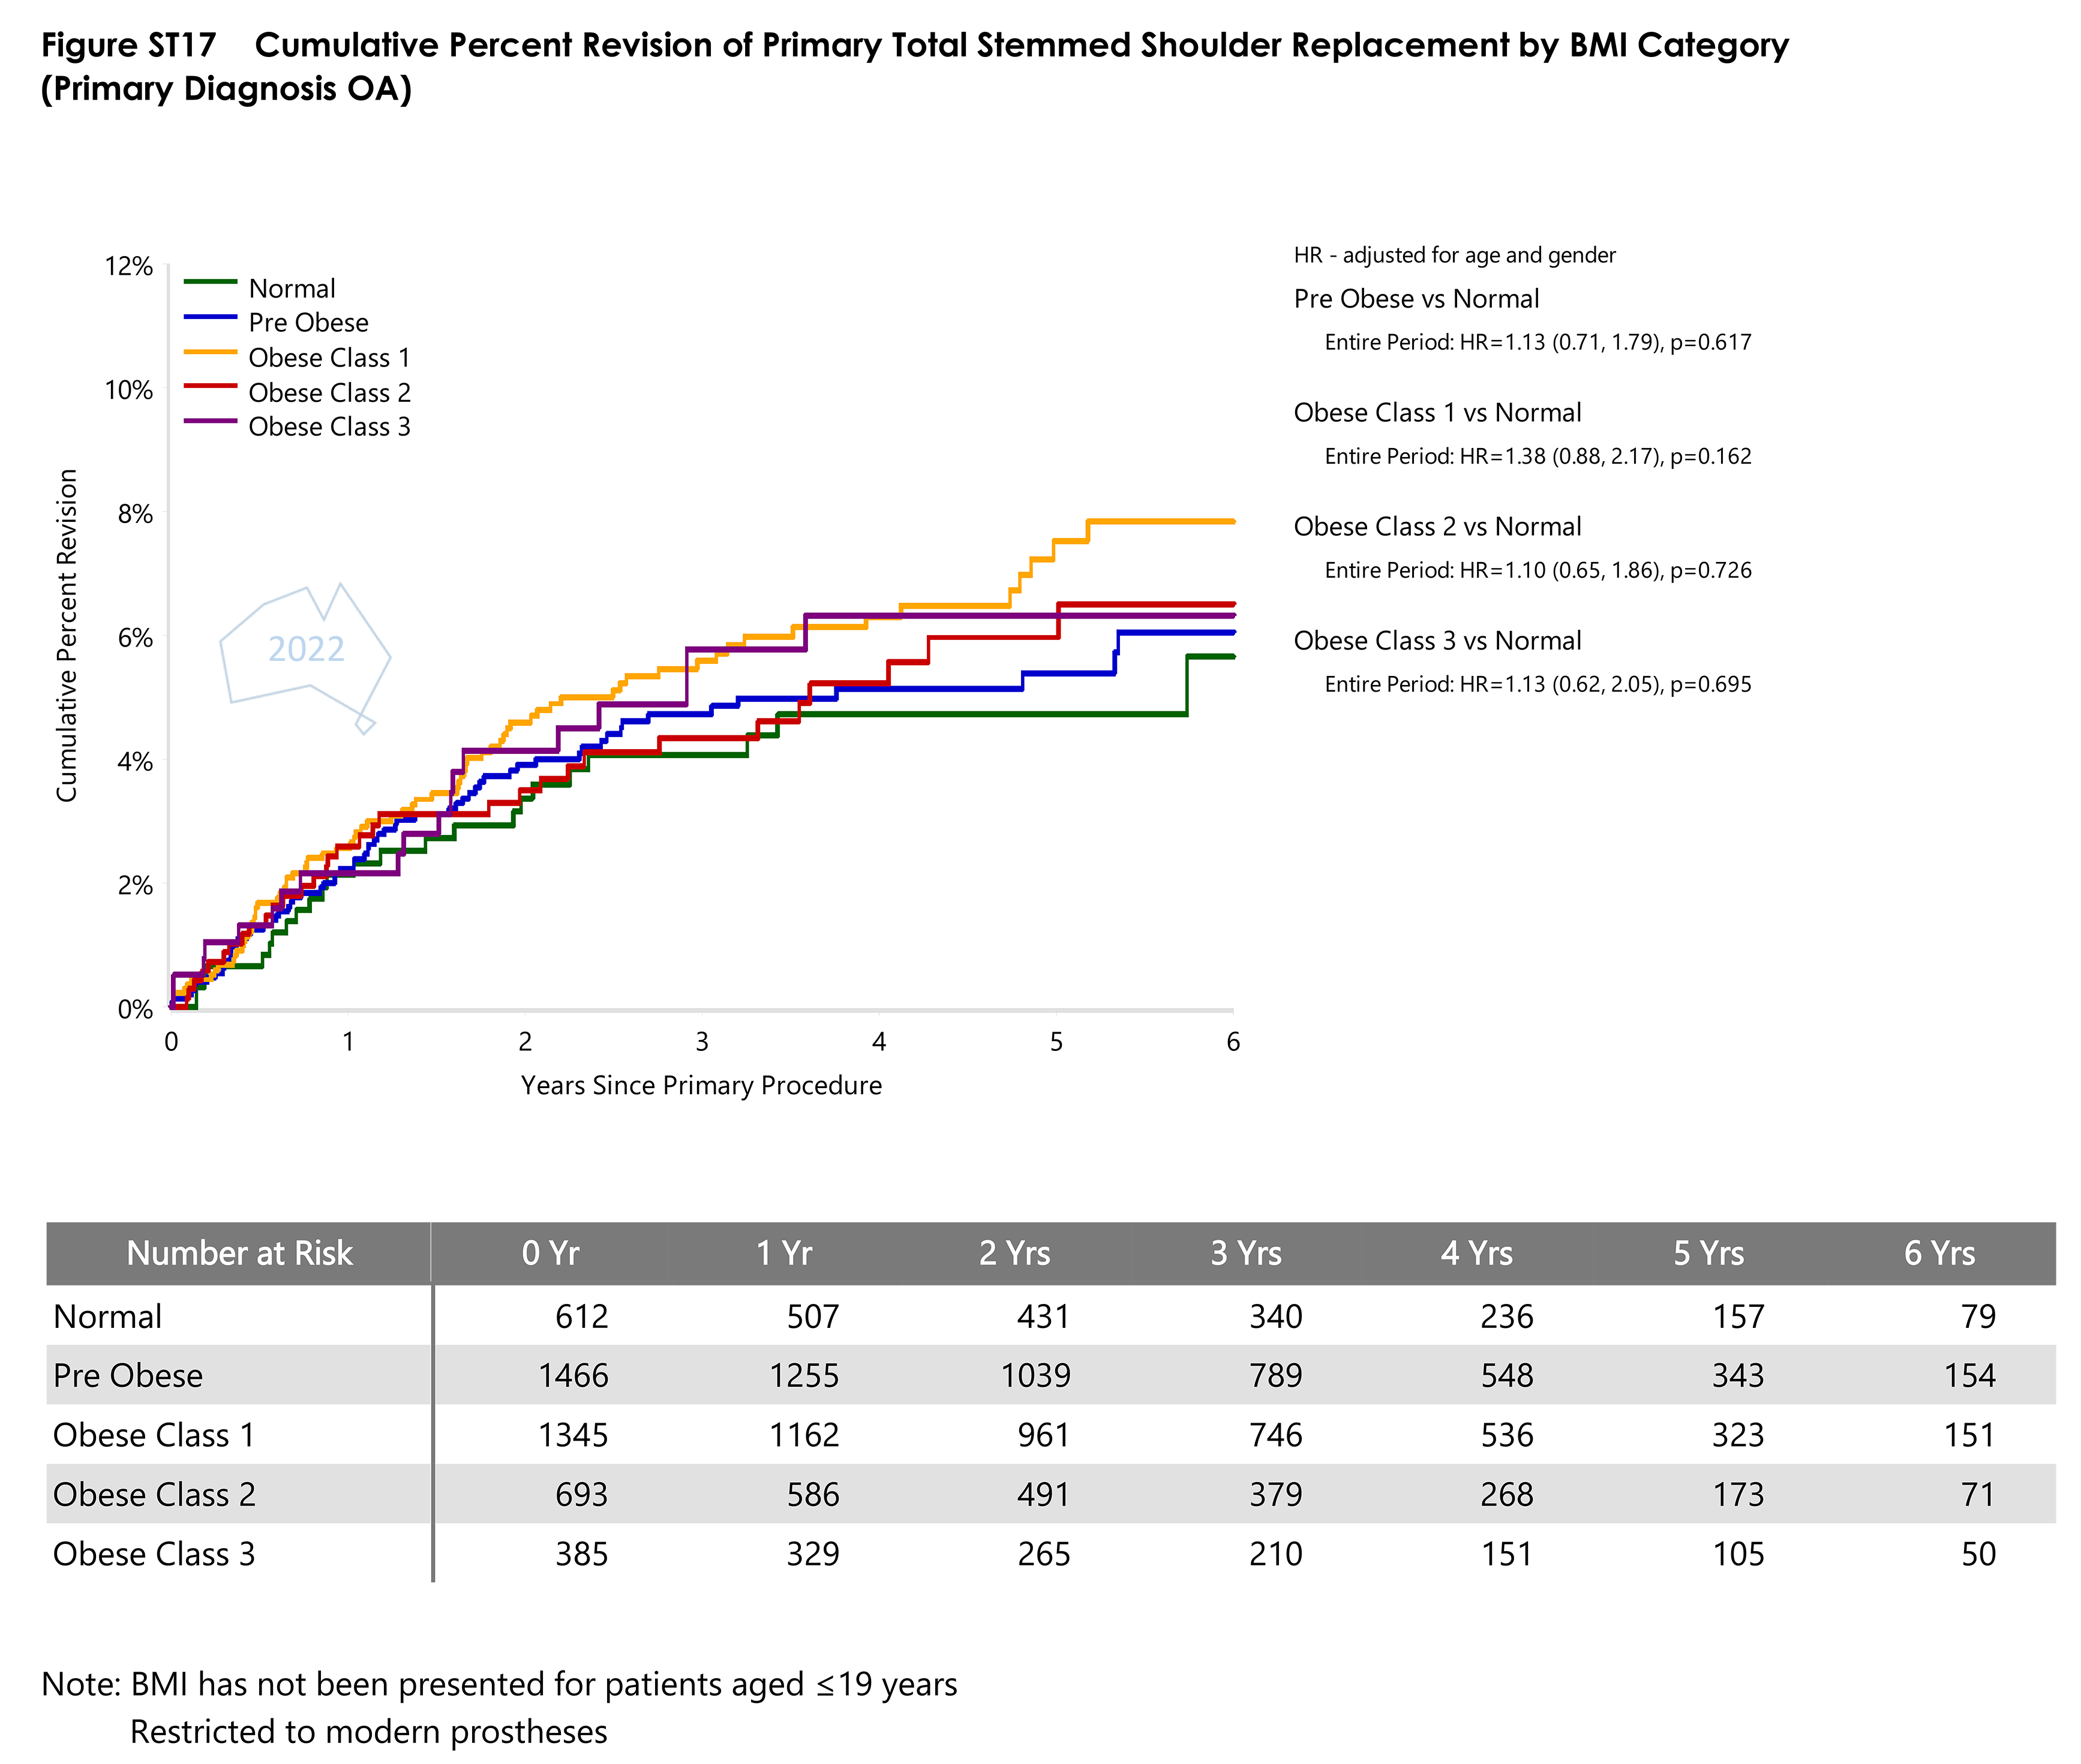
- Figure ST17 Cumulative Percent Revision of Primary Total Stemmed Shoulder Replacement by BMI CategoryPDF · 70 KB
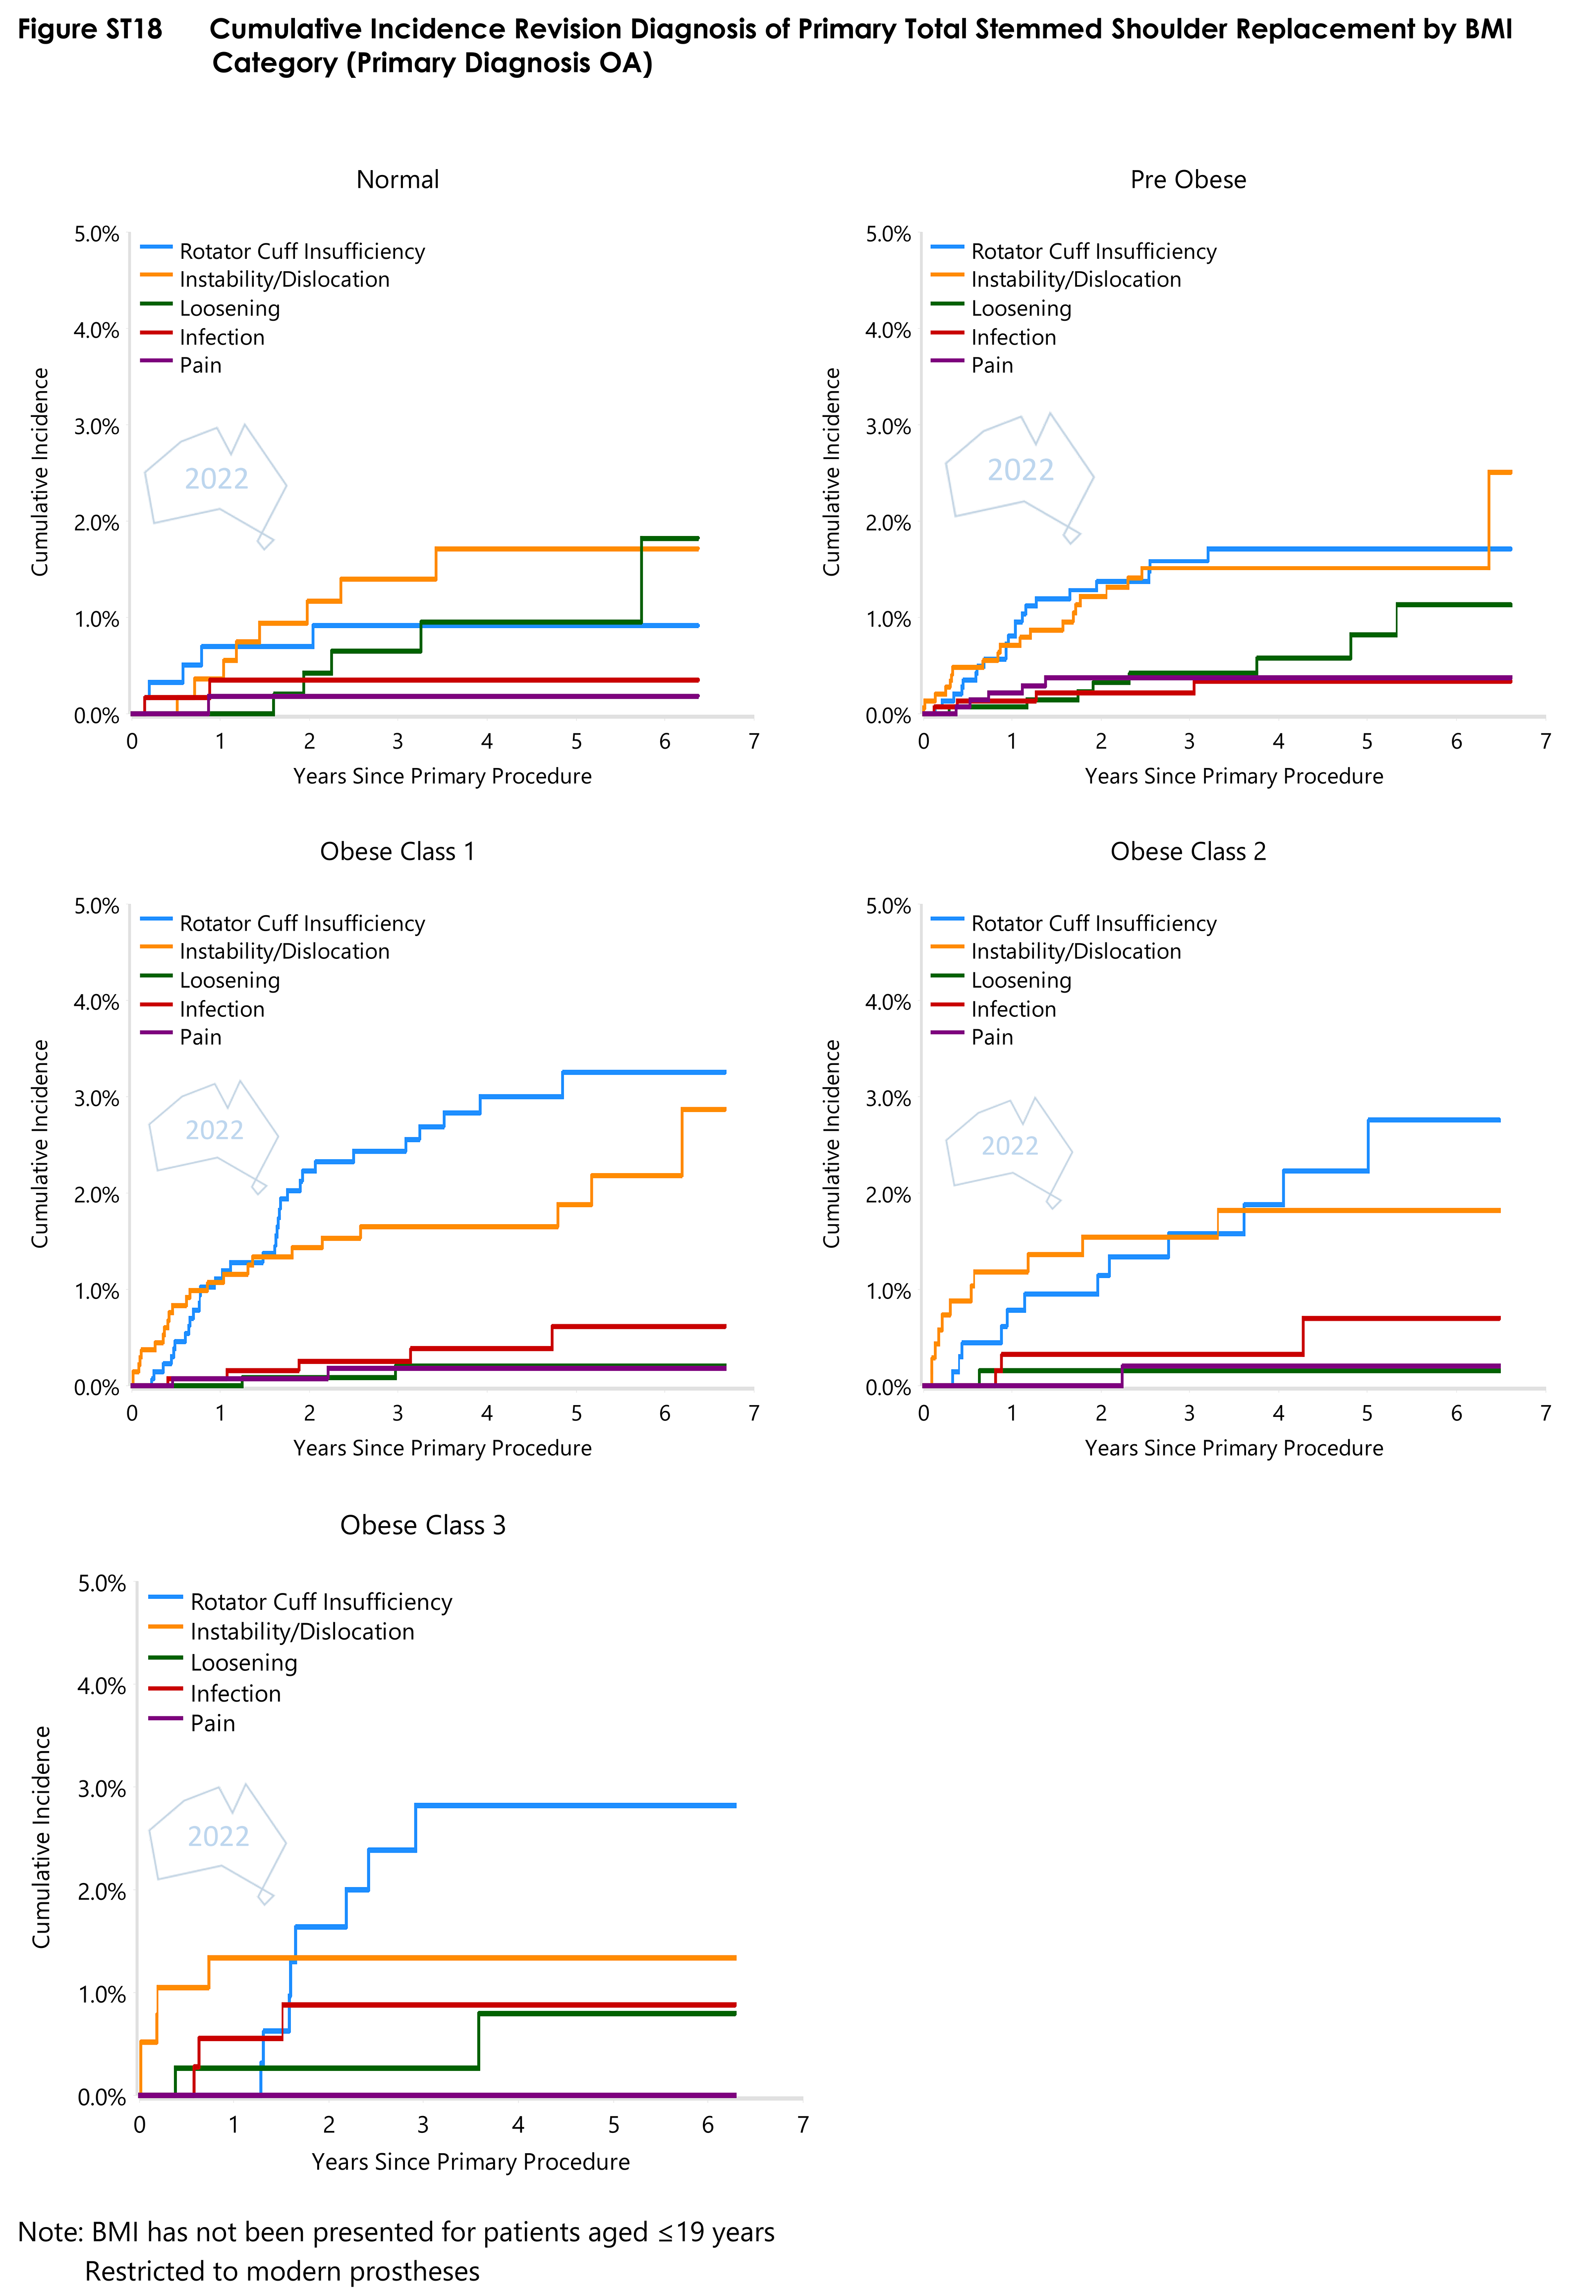
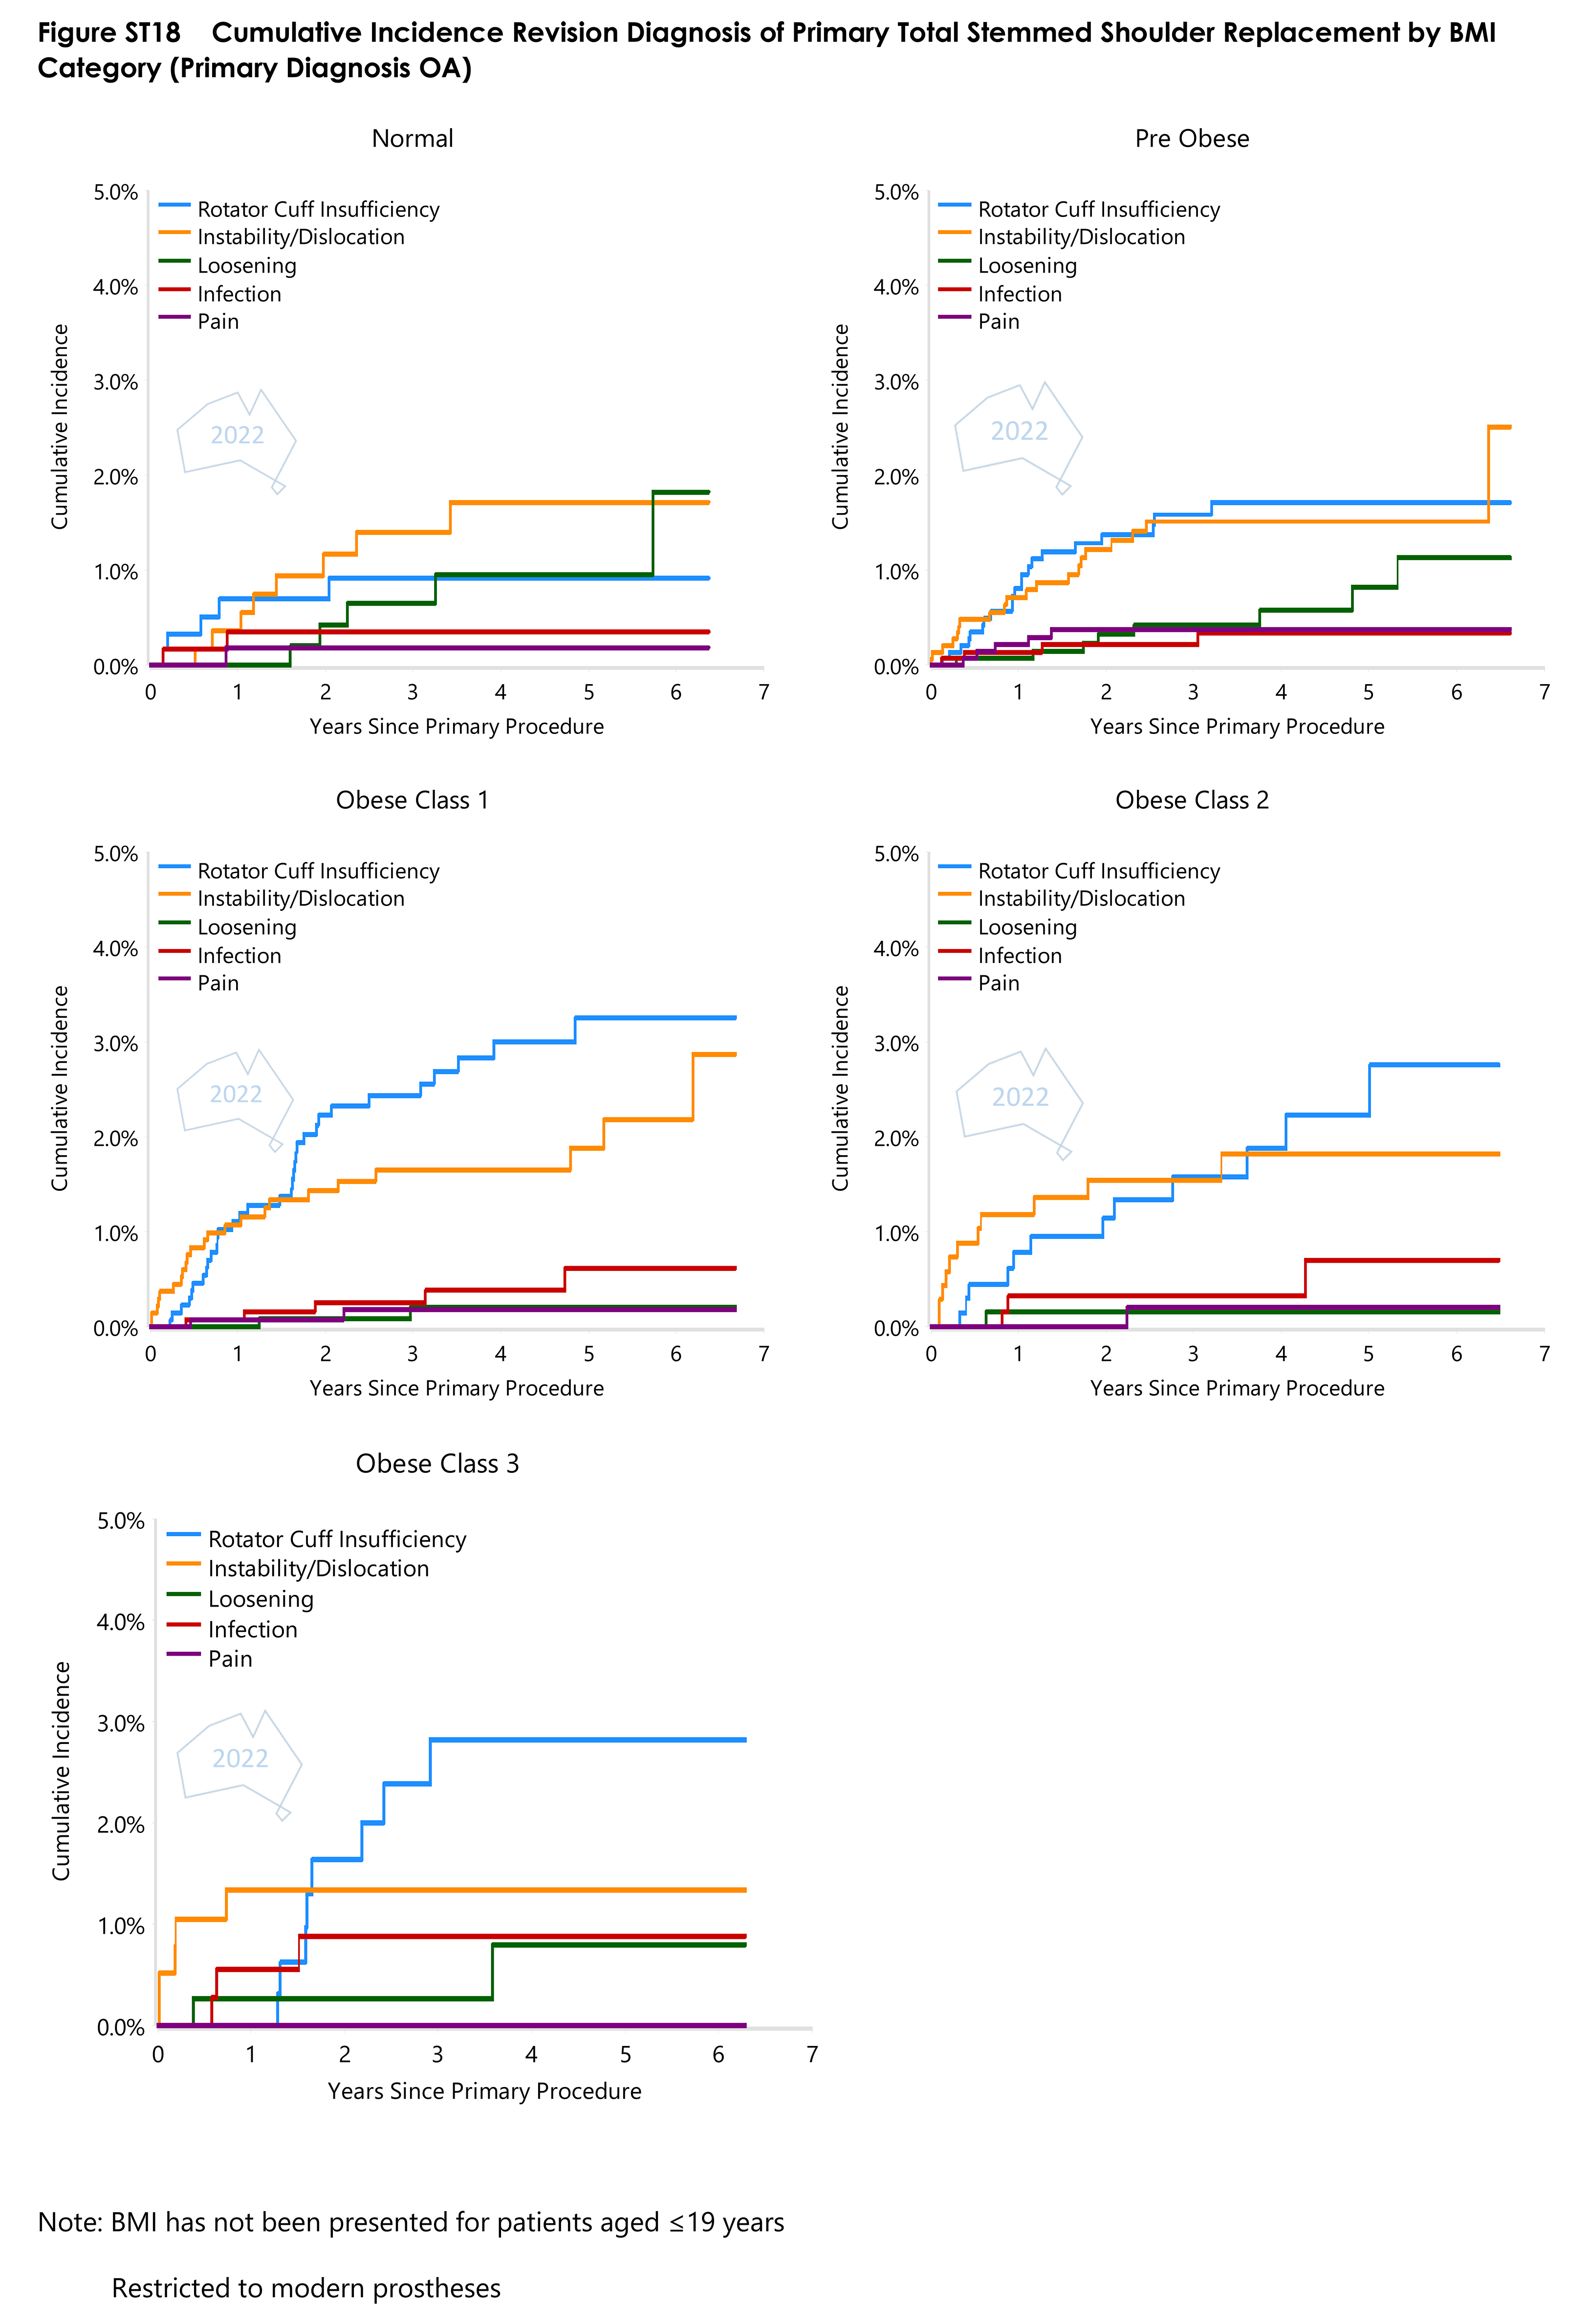
- Figure ST18 Cumulative Incidence Revision Diagnosis of Primary Total Stemmed Shoulder Replacement by BMI CategoryPDF · 64 KB
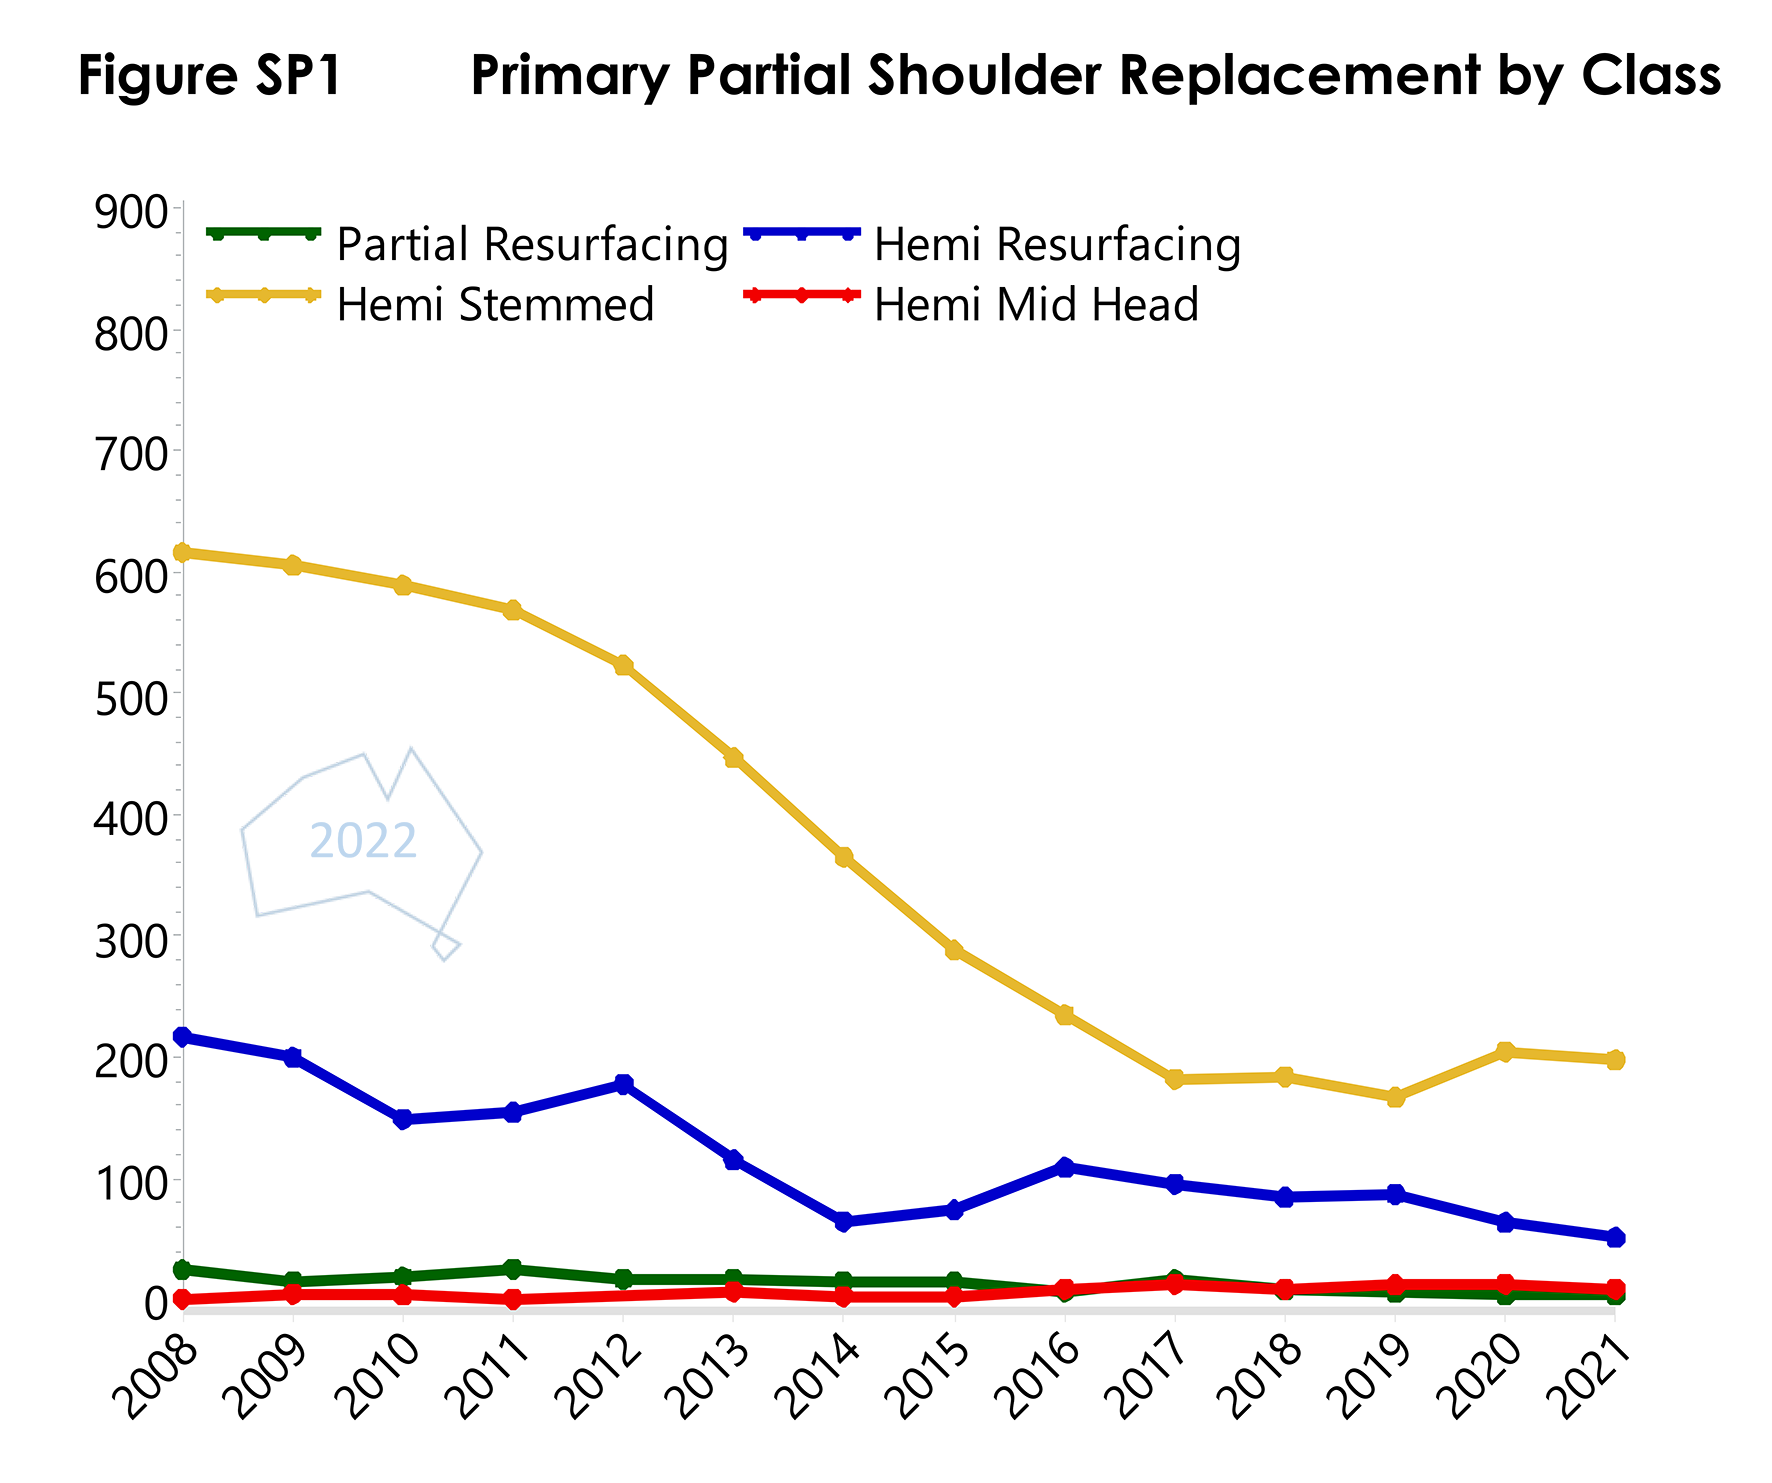
- Primary Partial Shoulder Replacement by ClassPDF · 65 KB
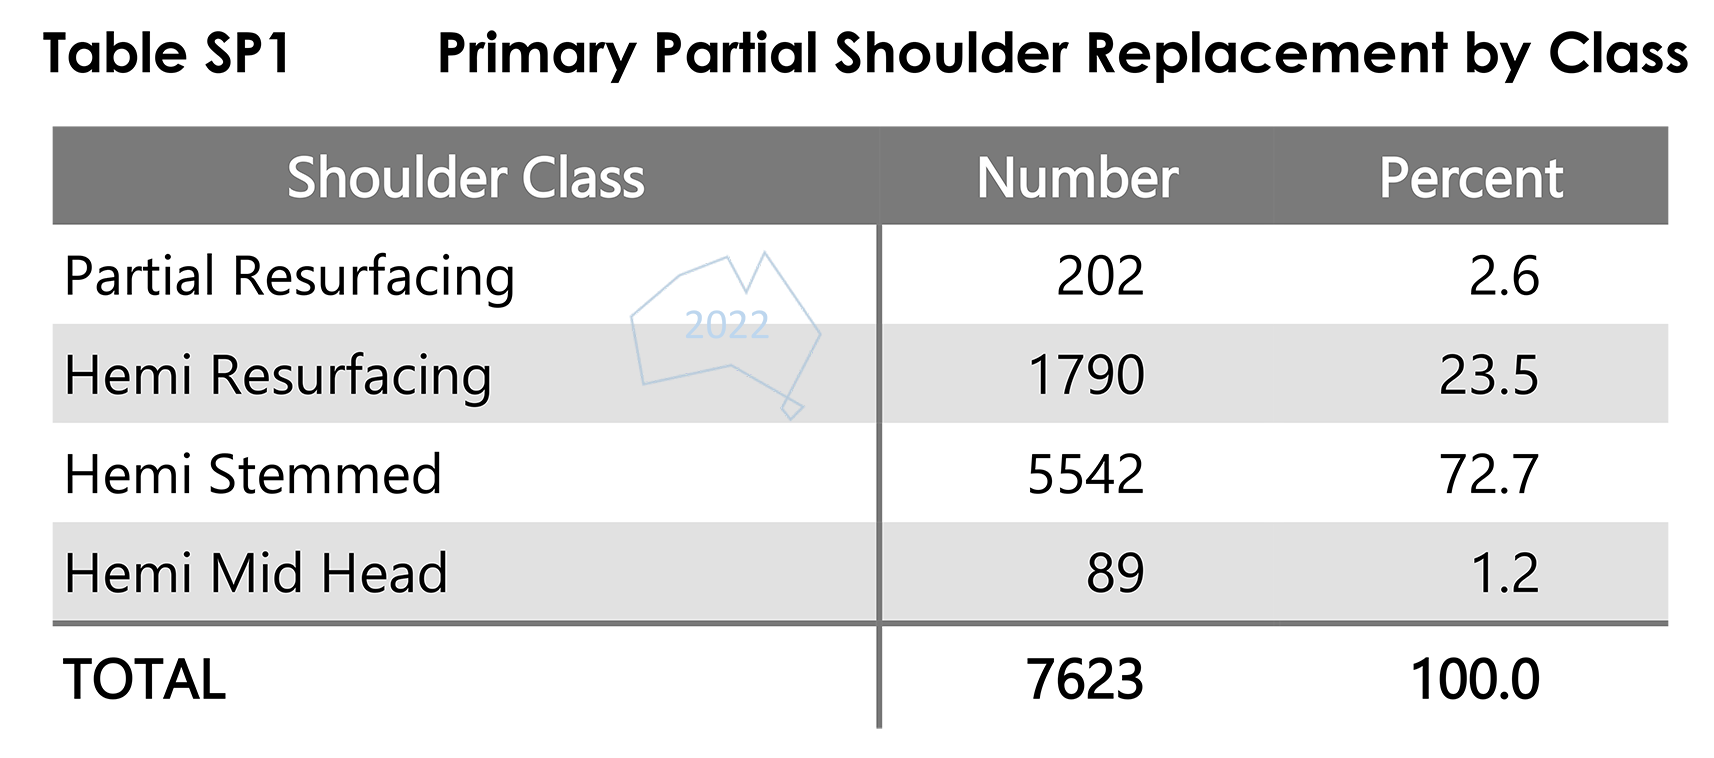
- Table SP1 Primary Partial Shoulder Replacement by ClassPDF · 43 KB
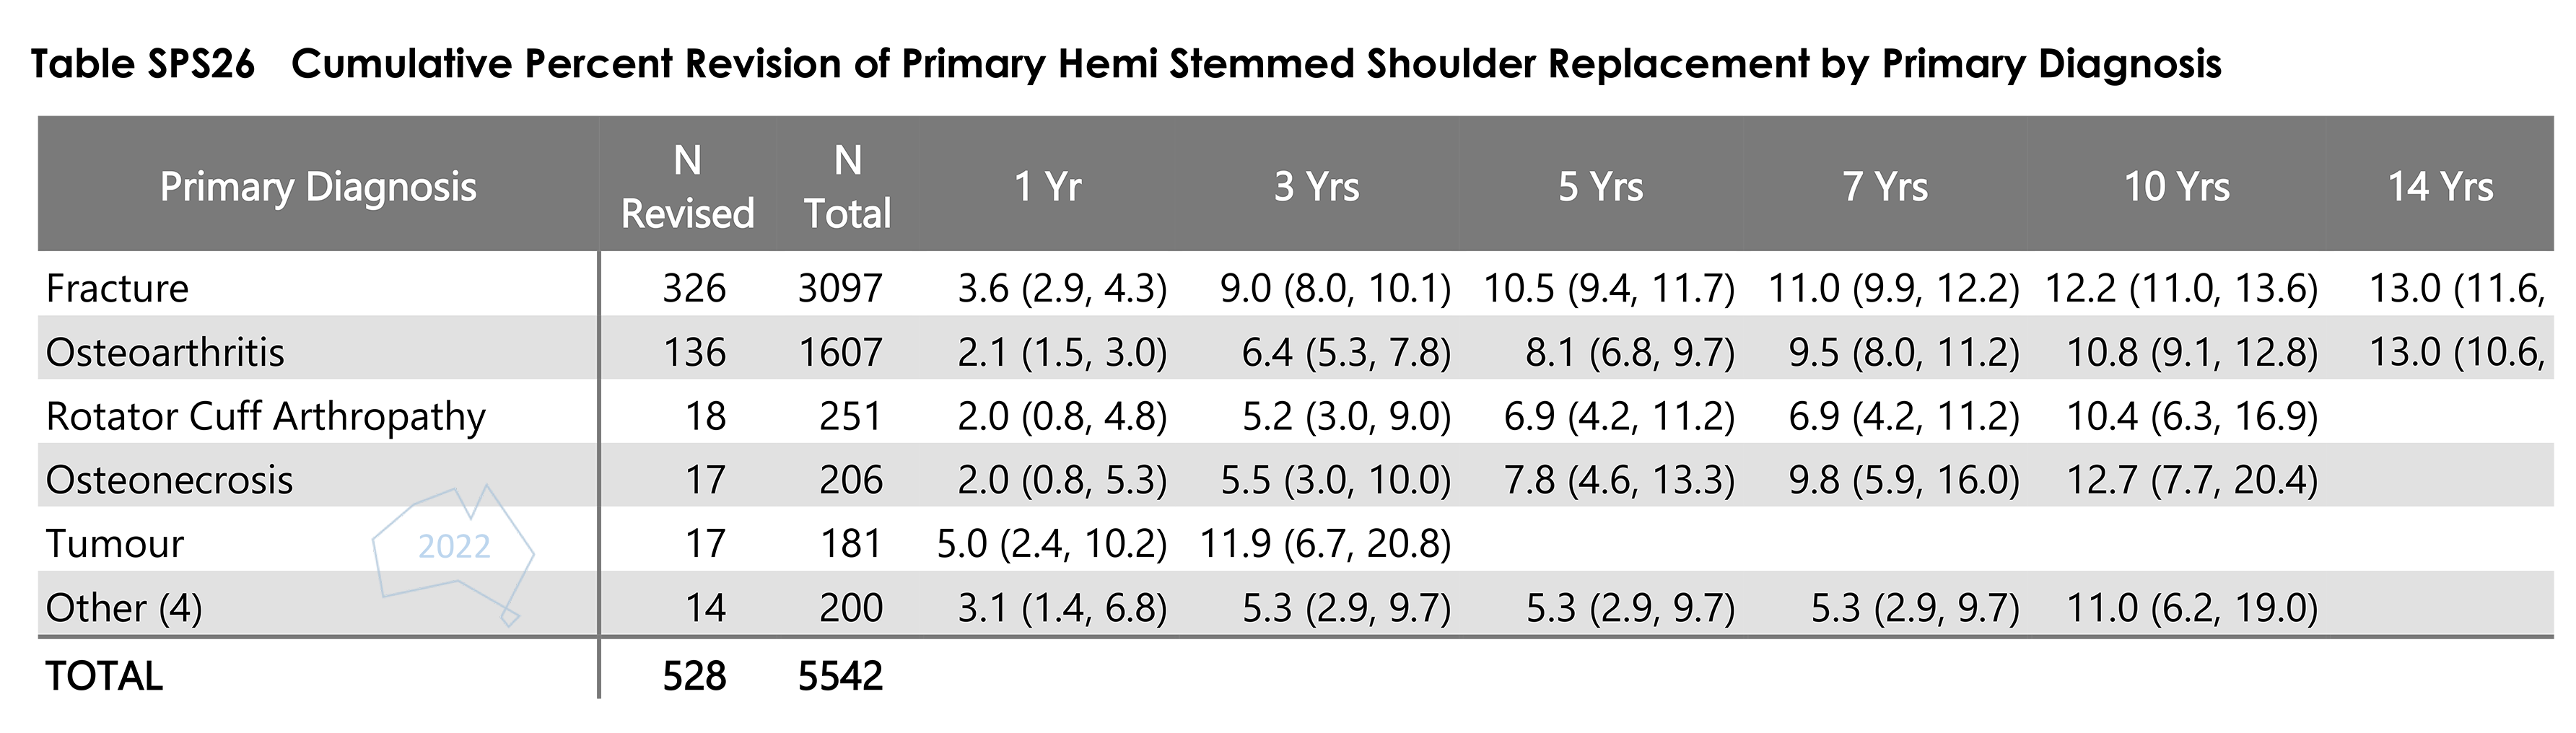
- Table SPS26 Cumulative Percent Revision of Primary Hemi Stemmed Shoulder Replacement by Primary DiagnosisPDF · 52 KB
PNG
- Figure SP2 Cumulative Percent Revision of Primary Partial Shoulder Replacement by ClassPNG · 761 KB
- Figure SP3 Cumulative Percent Revision of Primary Hemi Resurfacing Shoulder Replacement by Gender copyPNG · 562 KB
- Figure SP4 Primary Hemi Stemmed Shoulder Replacement by Primary Diagnosis copyPNG · 372 KB
- Figure SPS10 Cumulative Percent Revision of Primary Hemi Stemmed Shoulder Replacement by Gender copyPNG · 586 KB
- Figure SPS12 Cumulative Percent Revision of Primary Hemi Stemmed Shoulder Replacement by Stem Type and Humeral Fixation copyPNG · 971 KB
- Figure SPS13 Cumulative Percent Revision of Primary Hemi Stemmed Shoulder Replacement by Age copyPNG · 606 KB
- Figure SPS13 Cumulative Percent Revision of Primary Hemi Stemmed Shoulder Replacement by Age copyPNG · 672 KB
- Figure SPS14 Cumulative Percent Revision of Primary Hemi Stemmed Shoulder Replacement by Gender copyPNG · 551 KB
- Figure SPS3 Cumulative Incidence Revision Diagnosis of Primary Hemi Resurfacing Shoulder Replacement copyPNG · 353 KB
- Figure SPS4 Cumulative Percent Revision of Primary Hemi Resurfacing Shoulder Replacement by Age copyPNG · 737 KB
- Figure SPS5 Cumulative Percent Revision of Primary Hemi Resurfacing Shoulder Replacement by Gender copyPNG · 553 KB
- Figure SPS6Primary Hemi Stemmed Shoulder Replacement by Primary Diagnosis copyPNG · 381 KB
- Figure SPS8 Cumulative Incidence Revision Diagnosis of Primary Hemi Stemmed Shoulder by Primary Diagnosis copyPNG · 543 KB
- Figure SPS9 Cumulative Percent Revision of Primary Hemi Stemmed Shoulder Replacement by Age copyPNG · 757 KB
- Figure ST1 Primary Total Shoulder Replacement by Class copyPNG · 391 KB
- Figure ST15 Cumulative Percent Revision of Primary Total Stemmed Shoulder Replacement by ASA Score copyPNG · 675 KB
- Figure ST16 Cumulative Incidence Revision Diagnosis of Primary Total Stemmed Shoulder Replacement by ASA Score copyPNG · 836 KB
- Figure ST17 Cumulative Percent Revision of Primary Total Stemmed Shoulder Replacement by BMI Category copyPNG · 821 KB
- Figure ST18 Cumulative Incidence Revision Diagnosis of Primary Total Stemmed Shoulder Replacement by BMI Category copyPNG · 1.2 MB
- Primary Partial Shoulder Replacement by Class copyPNG · 431 KB
- Table SP1 Primary Partial Shoulder Replacement by Class copyPNG · 228 KB
- Table SPS26 Cumulative Percent Revision of Primary Hemi Stemmed Shoulder Replacement by Primary Diagnosis copyPNG · 736 KB
Total Shoulders
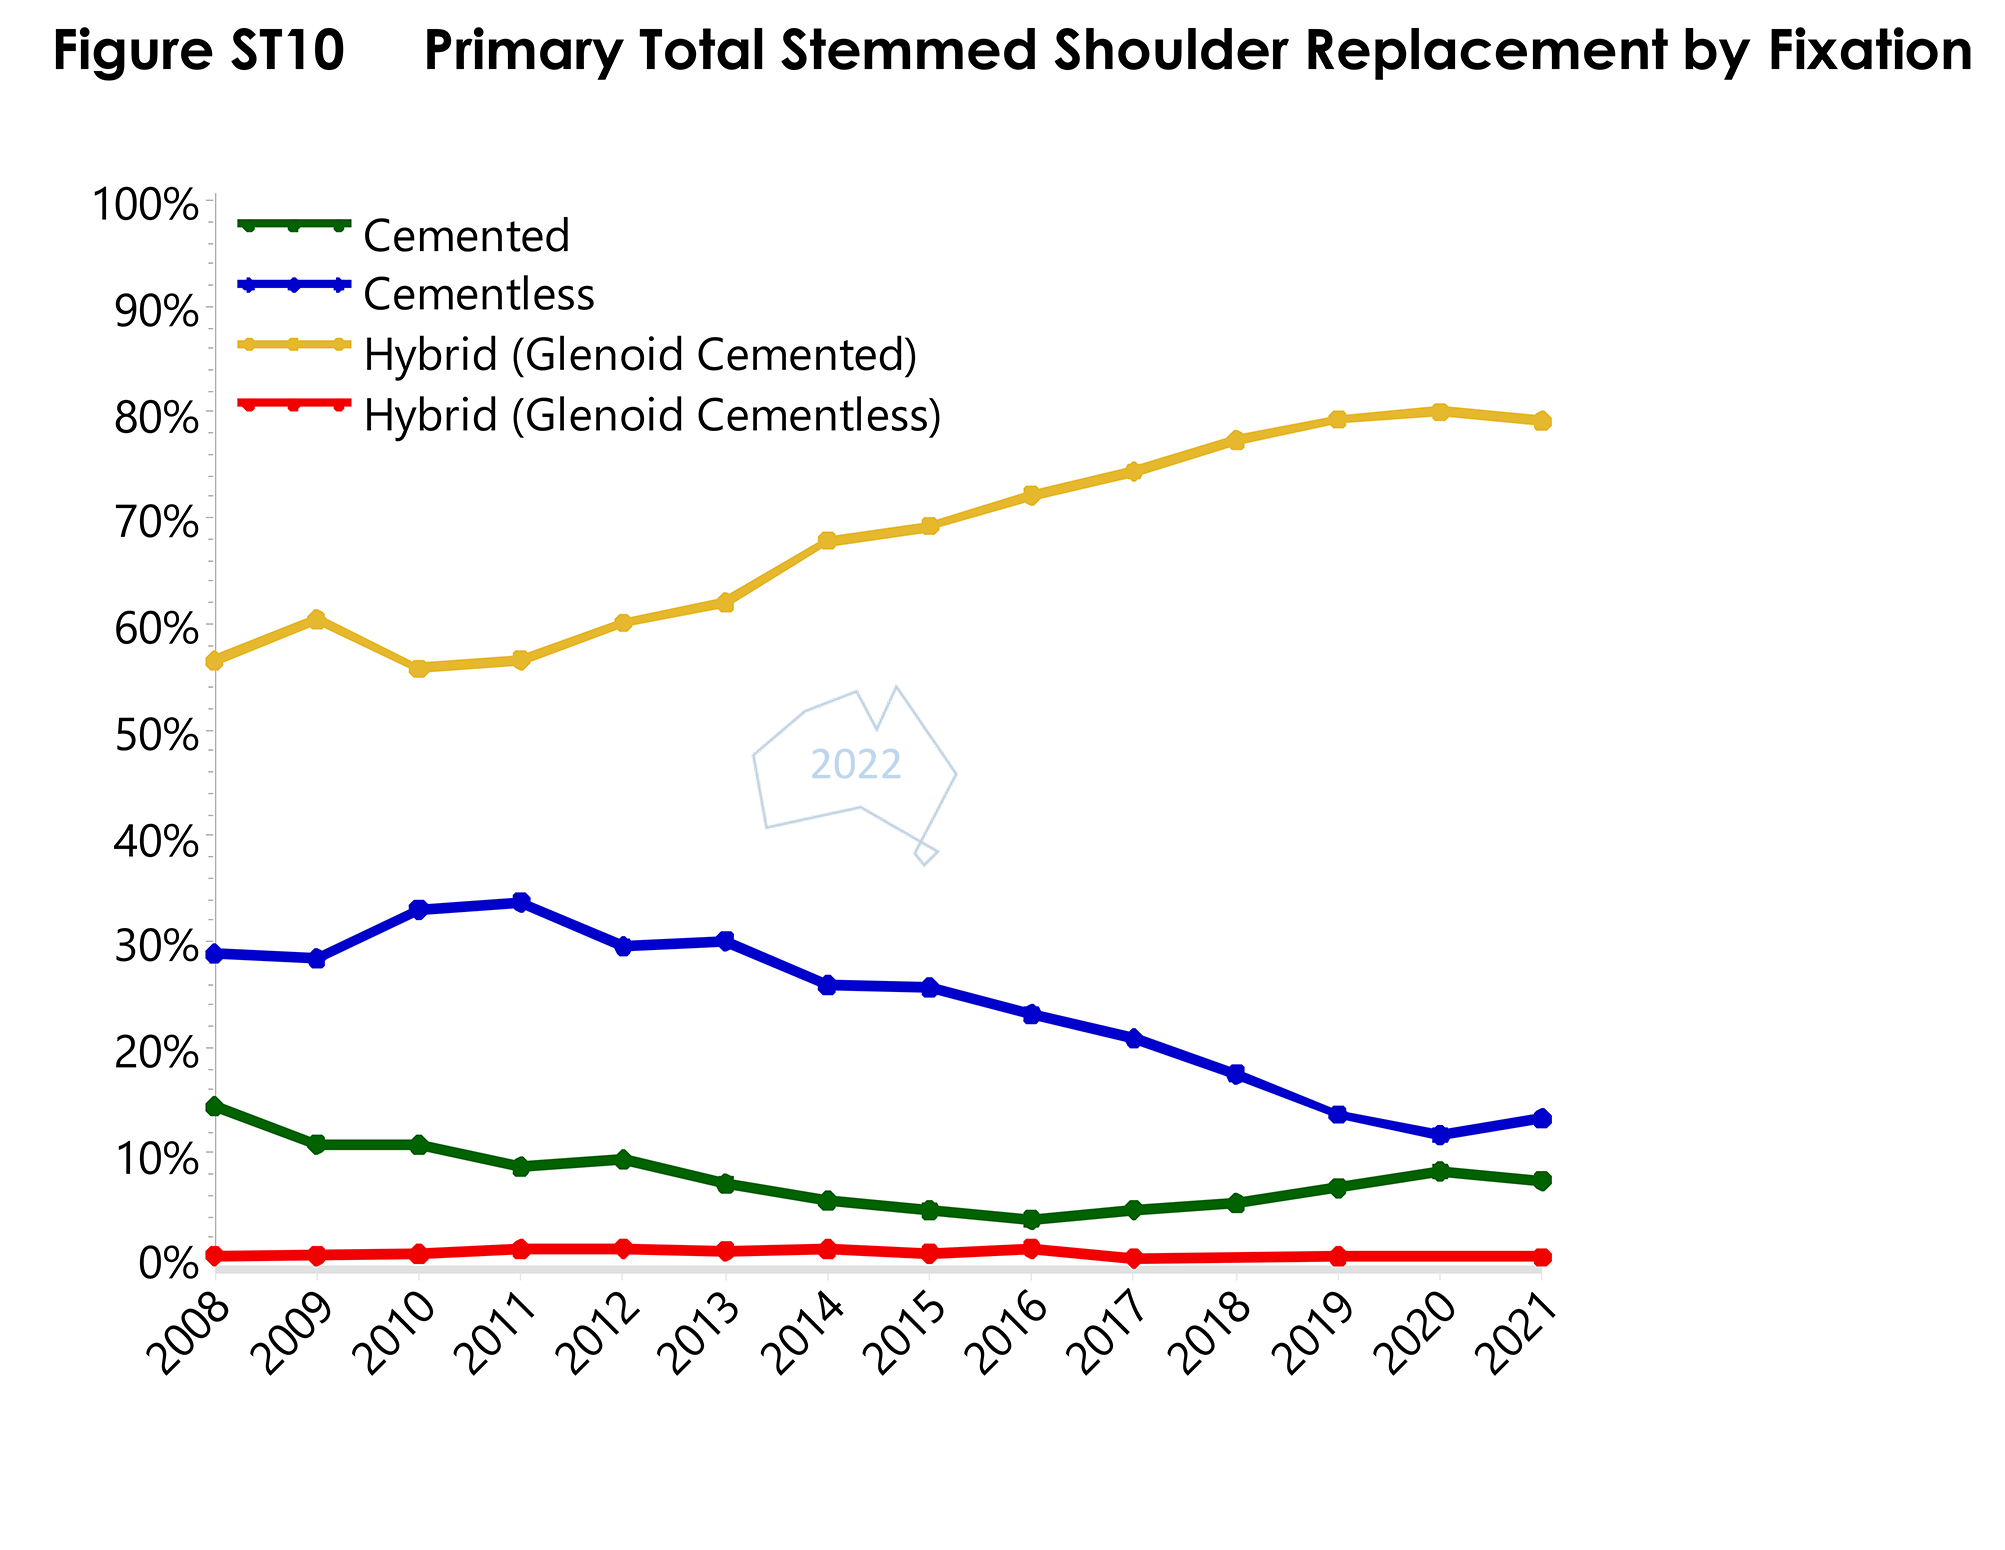
- Figure ST10 Primary Total Stemmed Shoulder Replacement by FixationPDF · 46 KB
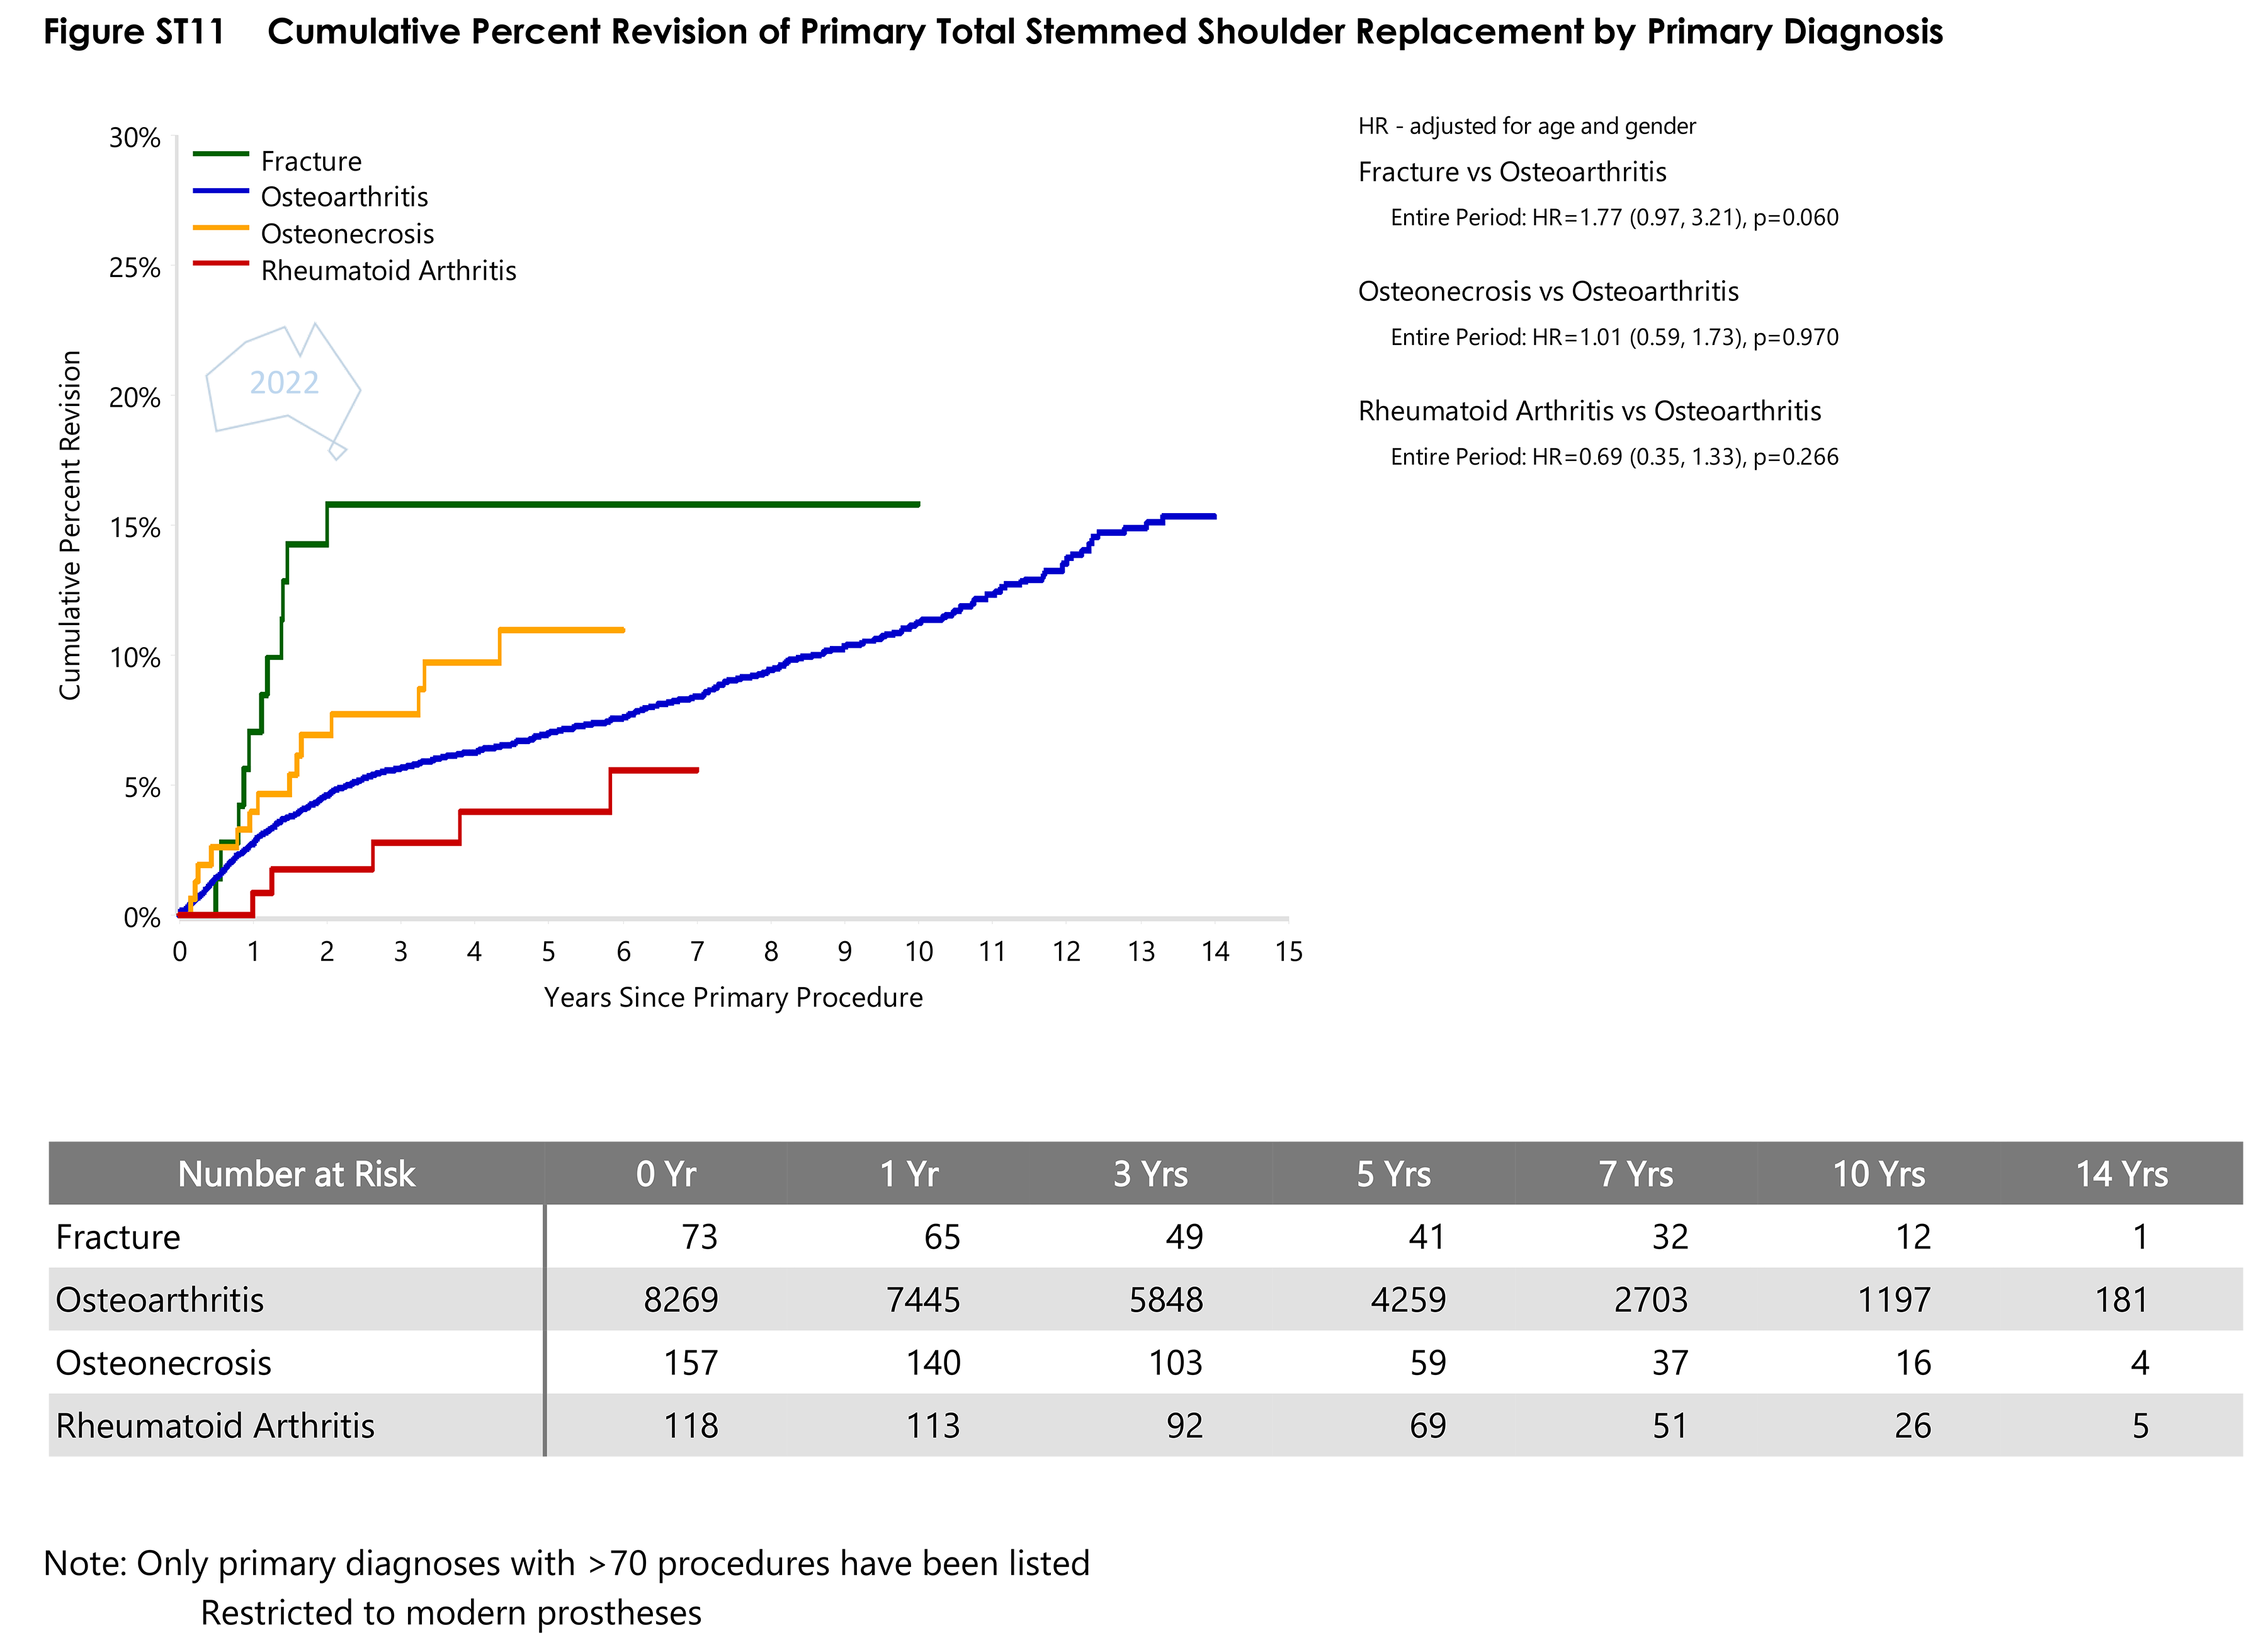
- Figure ST11 Cumulative Percent Revision of Primary Total Stemmed Shoulder Replacement by Primary DiagnosisPDF · 77 KB
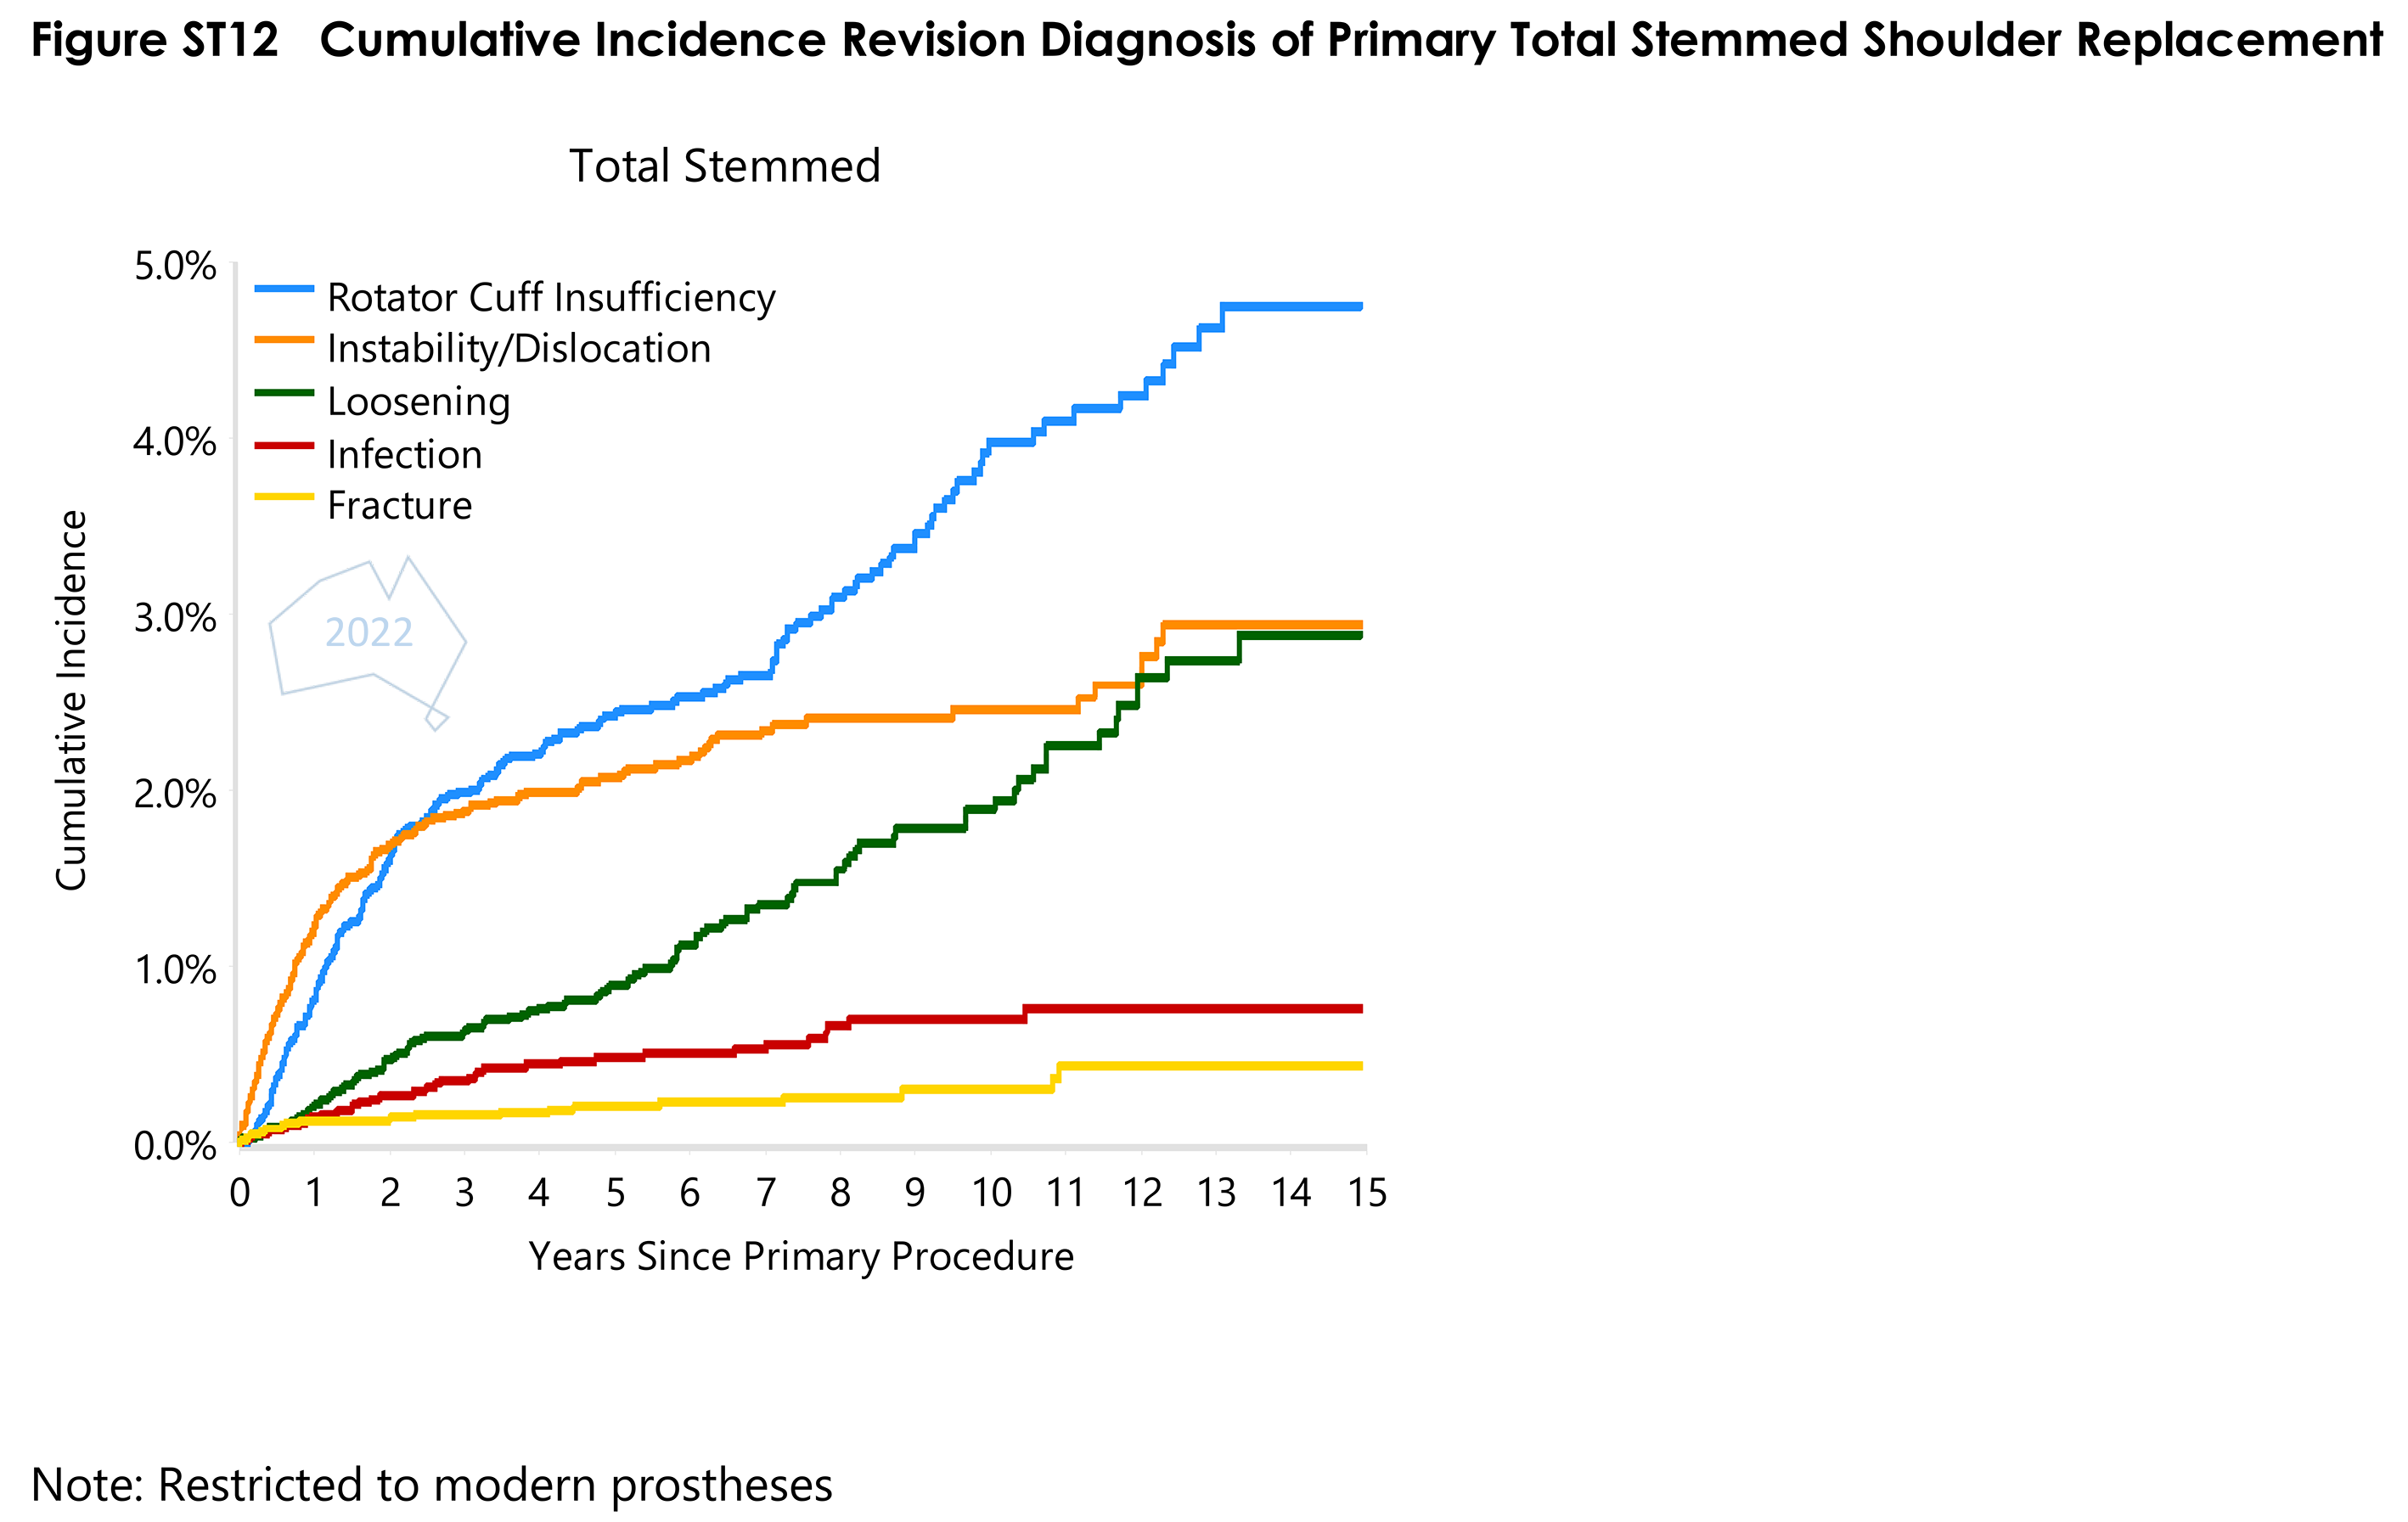
- Figure ST12 Cumulative Incidence Revision Diagnosis of Primary Total Stemmed Shoulder ReplacementPDF · 73 KB
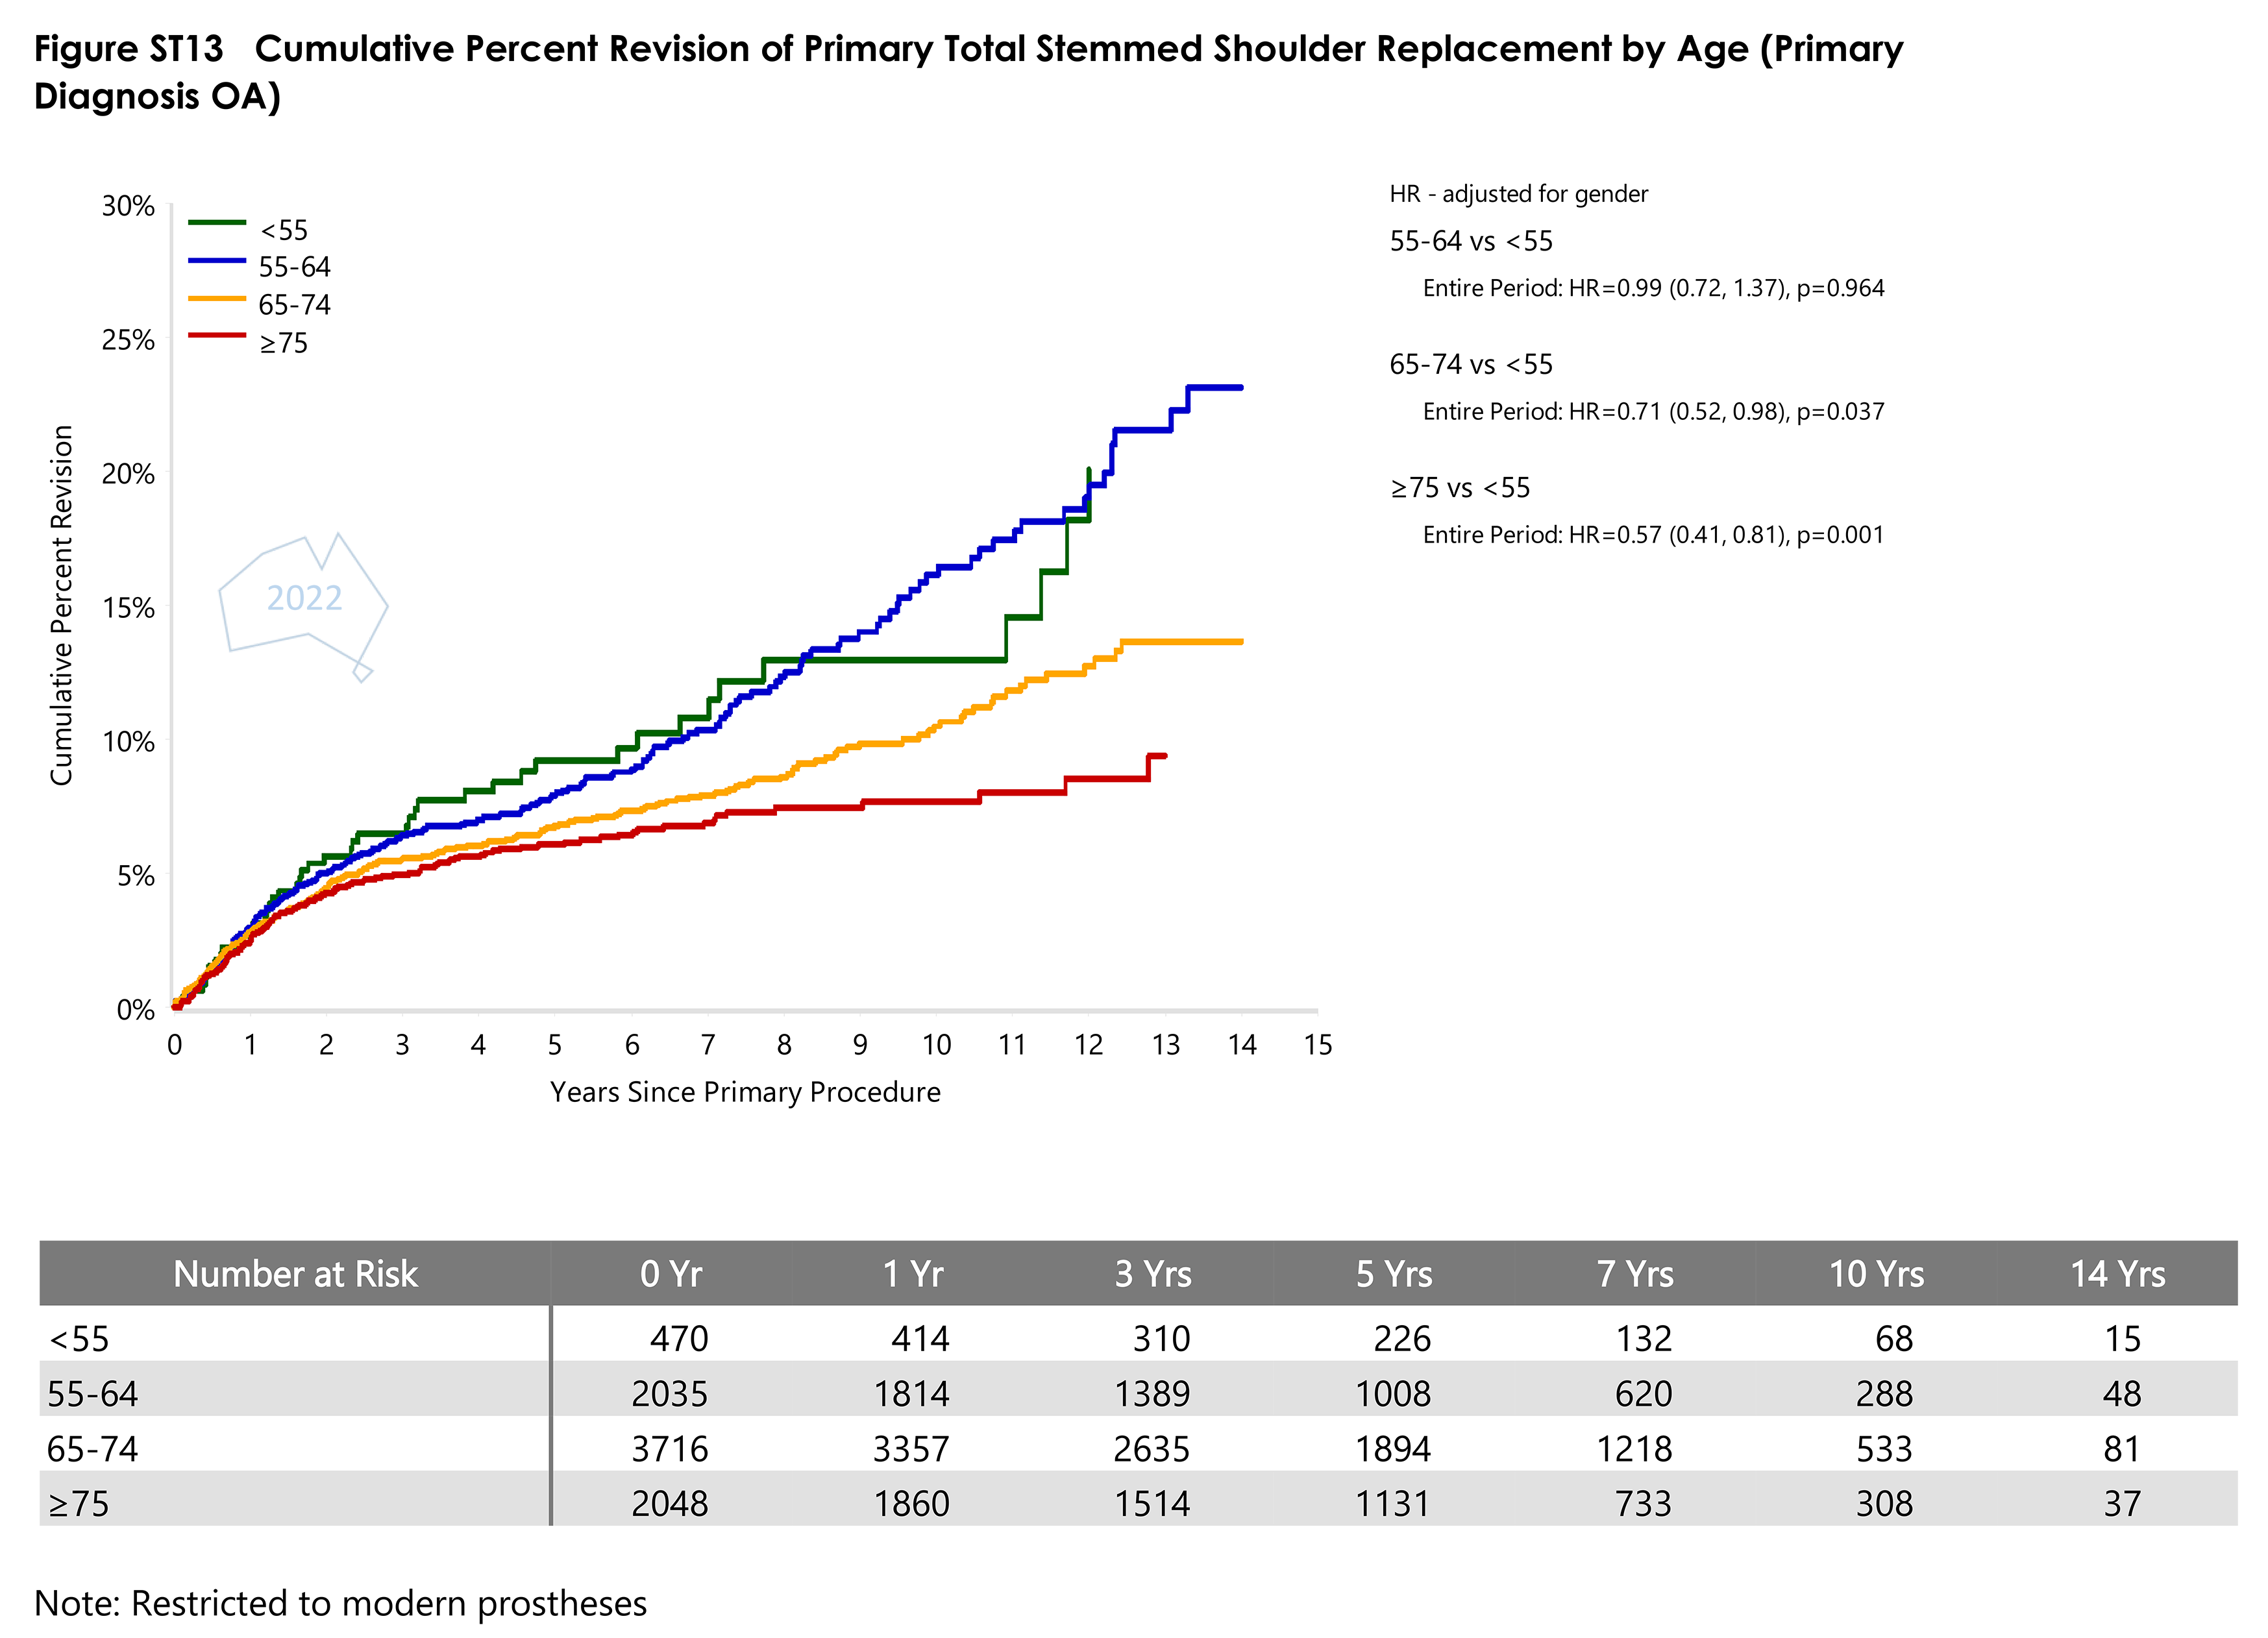
- Figure ST13 Cumulative Percent Revision of Primary Total Stemmed Shoulder Replacement by AgePDF · 87 KB
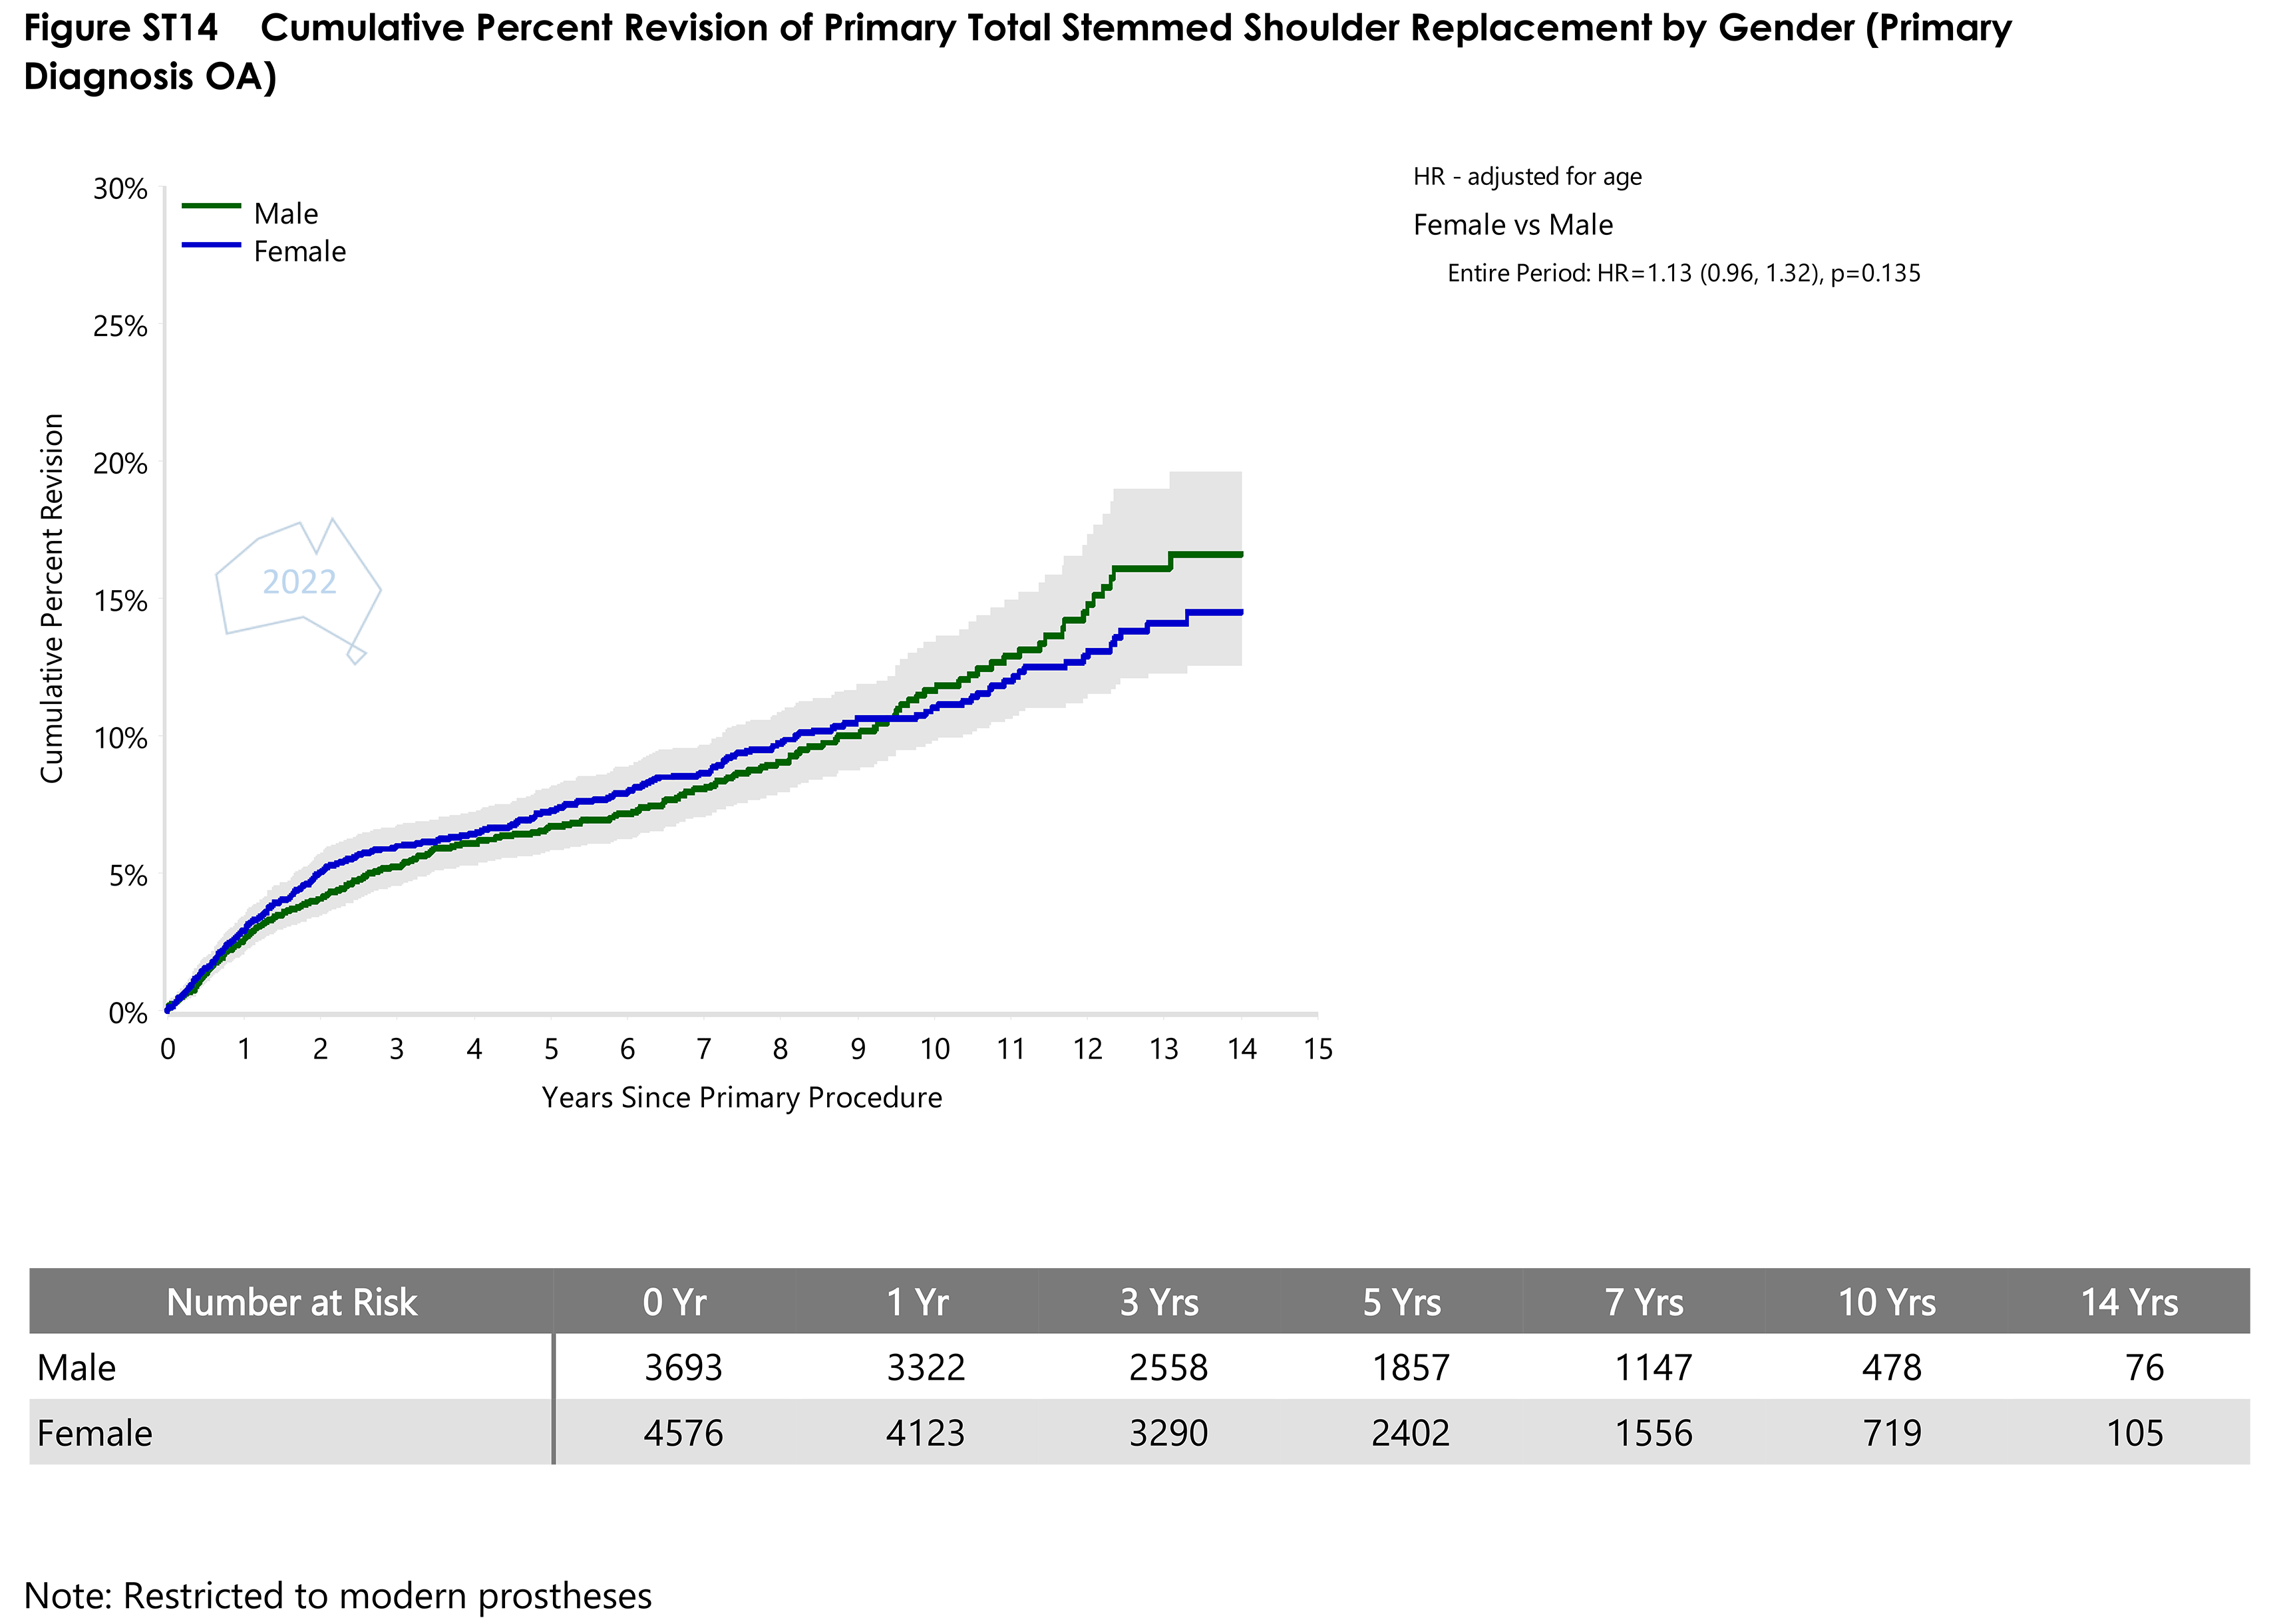
- Figure ST14 Cumulative Percent Revision of Primary Total Stemmed Shoulder Replacement by GenderPDF · 103 KB
- Figure ST15 Cumulative Percent Revision of Primary Total Stemmed Shoulder Replacement by ASA ScorePDF · 90 KB
- Figure ST16 Cumulative Incidence Revision Diagnosis of Primary Total Stemmed Shoulder Replacement by ASA ScorePDF · 85 KB
- Figure ST17 Cumulative Percent Revision of Primary Total Stemmed Shoulder Replacement by BMI CategoryPDF · 68 KB
- Figure ST18 Cumulative Incidence Revision Diagnosis of Primary Total Stemmed Shoulder Replacement by BMI CategoryPDF · 64 KB
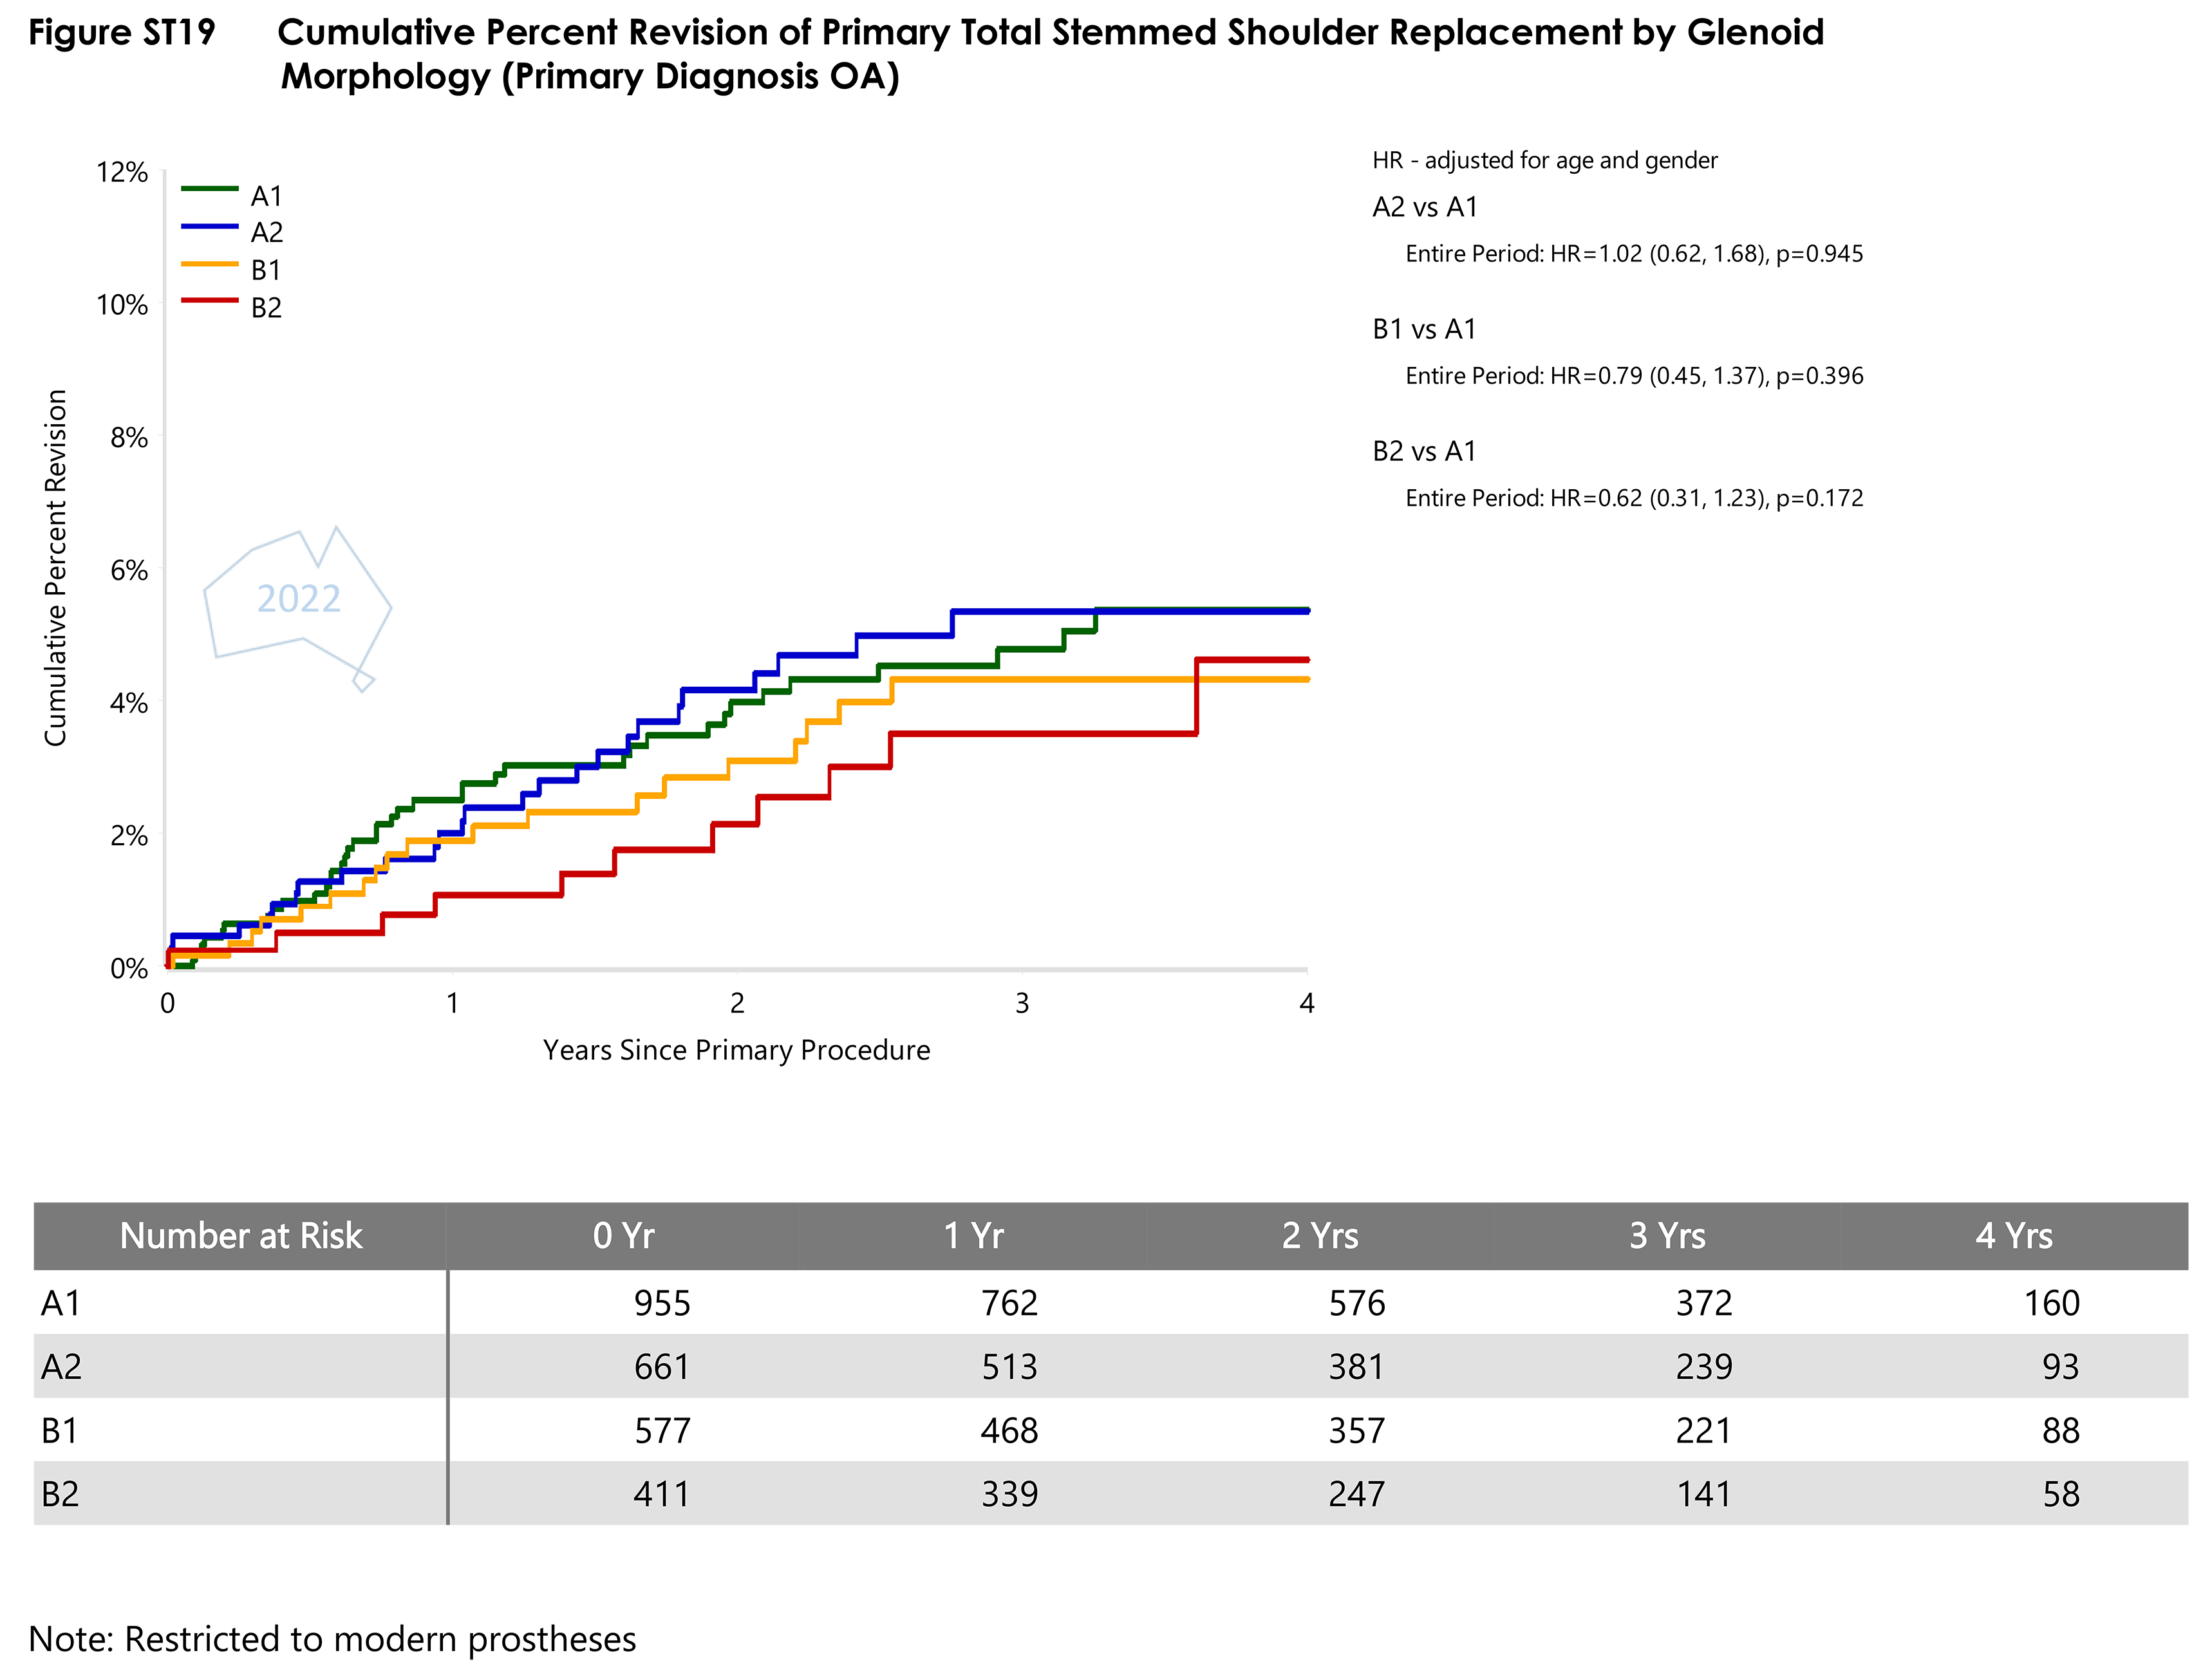
- Figure ST19 Cumulative Percent Revision of Primary Total Stemmed Shoulder Replacement by Glenoid MorphologyPDF · 58 KB
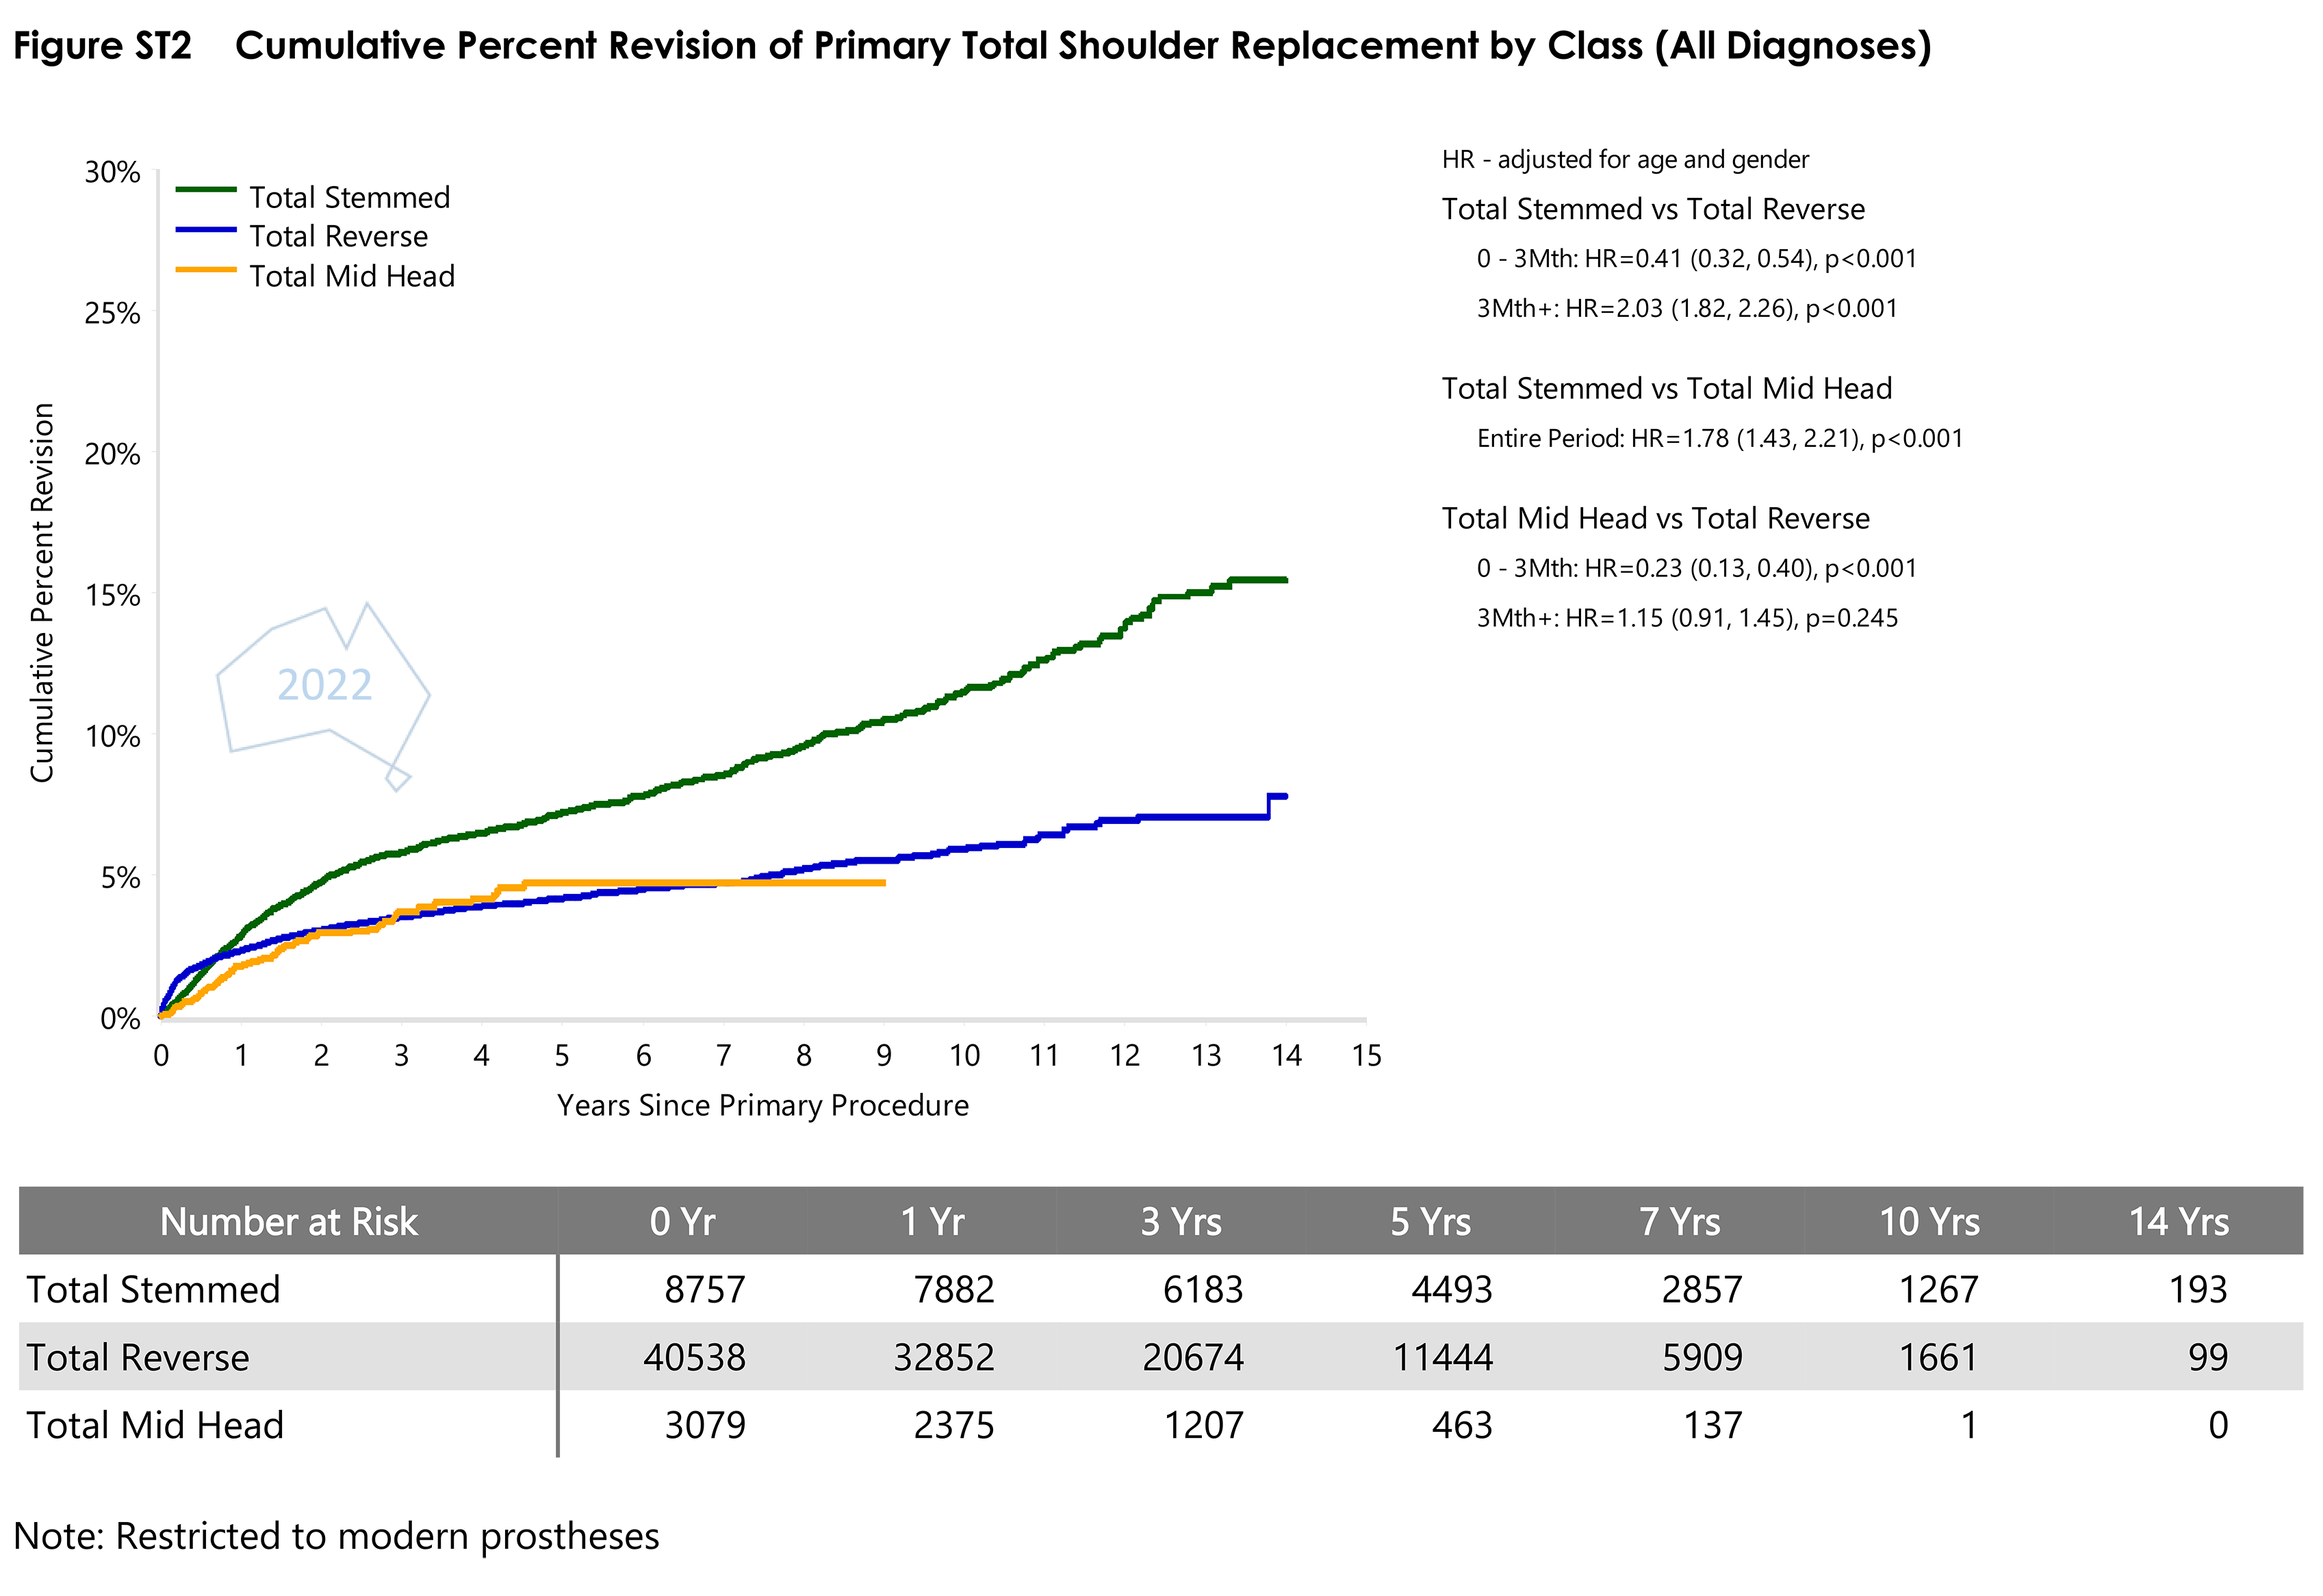
- Figure ST2 Cumulative Percent Revision of Primary Total Shoulder Replacement by ClassPDF · 102 KB
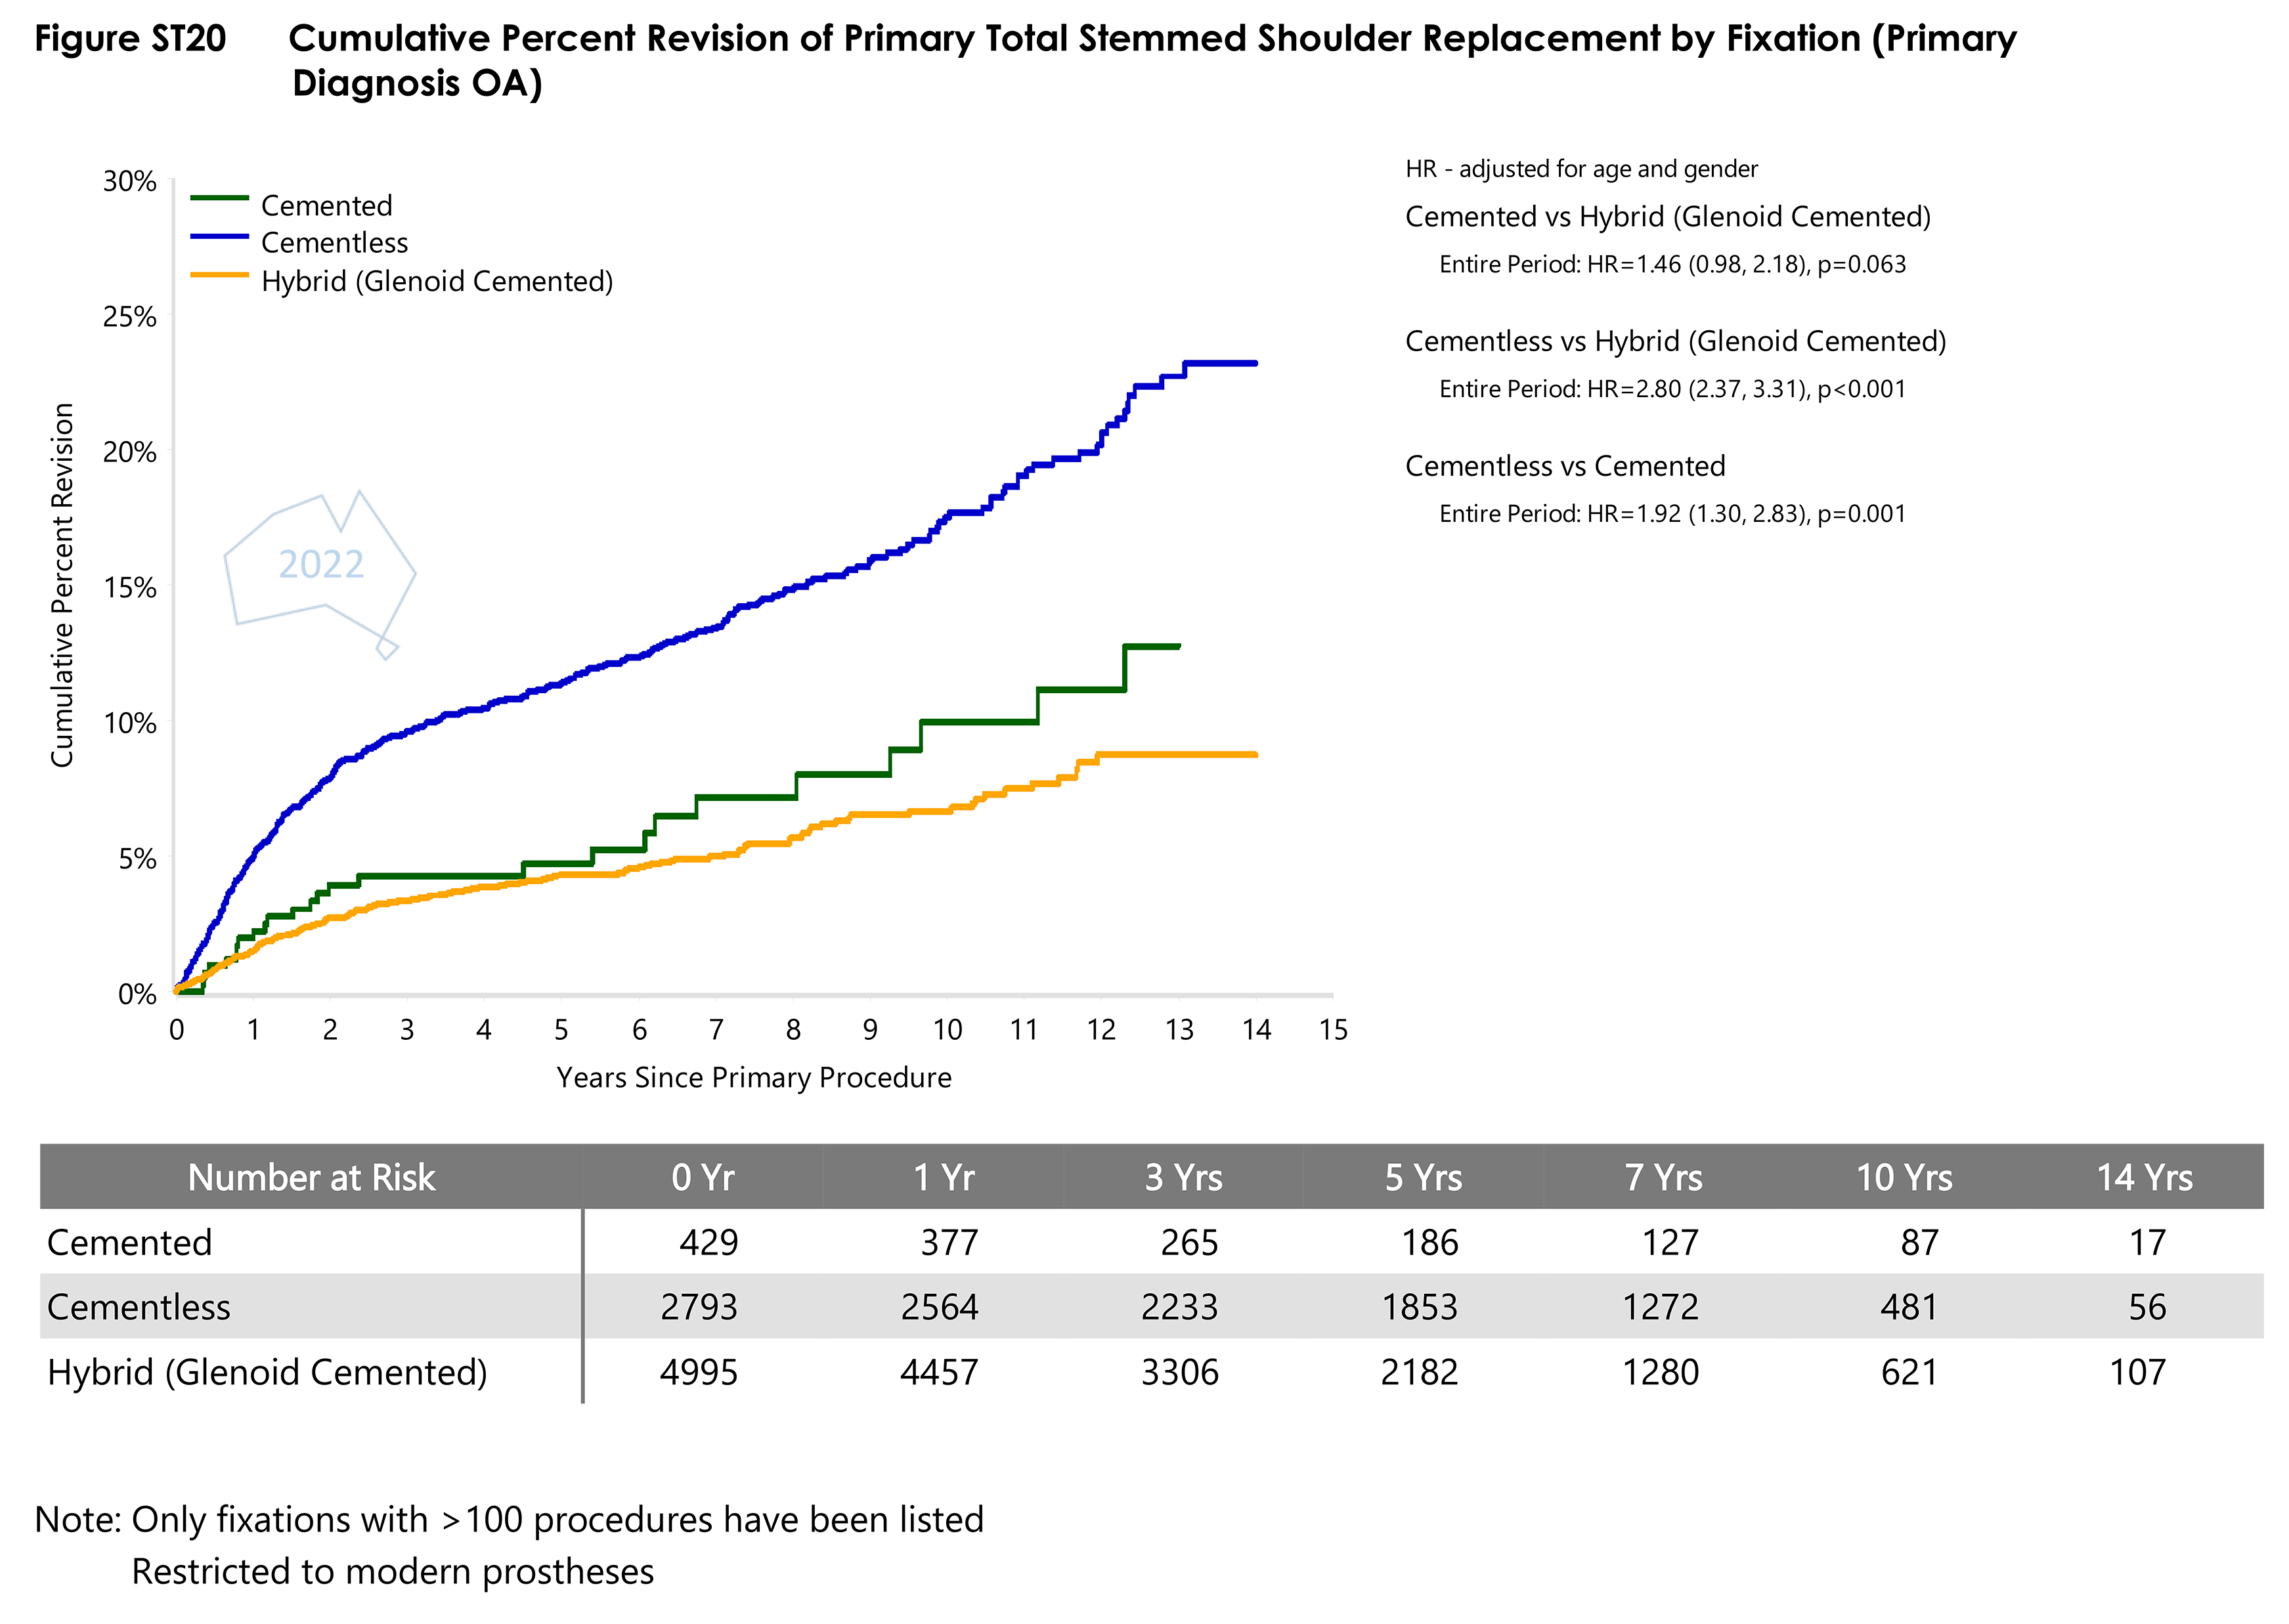
- Figure ST20 Cumulative Percent Revision of Primary Total Stemmed Shoulder Replacement by FixationPDF · 82 KB
- Figure ST21 Cumulative Percent Revision of Primary Total Stemmed Shoulder Replacement by Glenoid TypePDF · 85 KB
- Figure ST22 Cumulative Percent Revision of AllPDF · 63 KB
- Figure ST24 Cumulative Percent Revision of Primary Total Stemmed Shoulder Replacement using All Types of Glenoids by Polyethylene TypePDF · 80 KB
- Figure ST25 Cumulative Percent Revision of Primary Total Stemmed Shoulder Replacement Using Cemented AllPDF · 65 KB
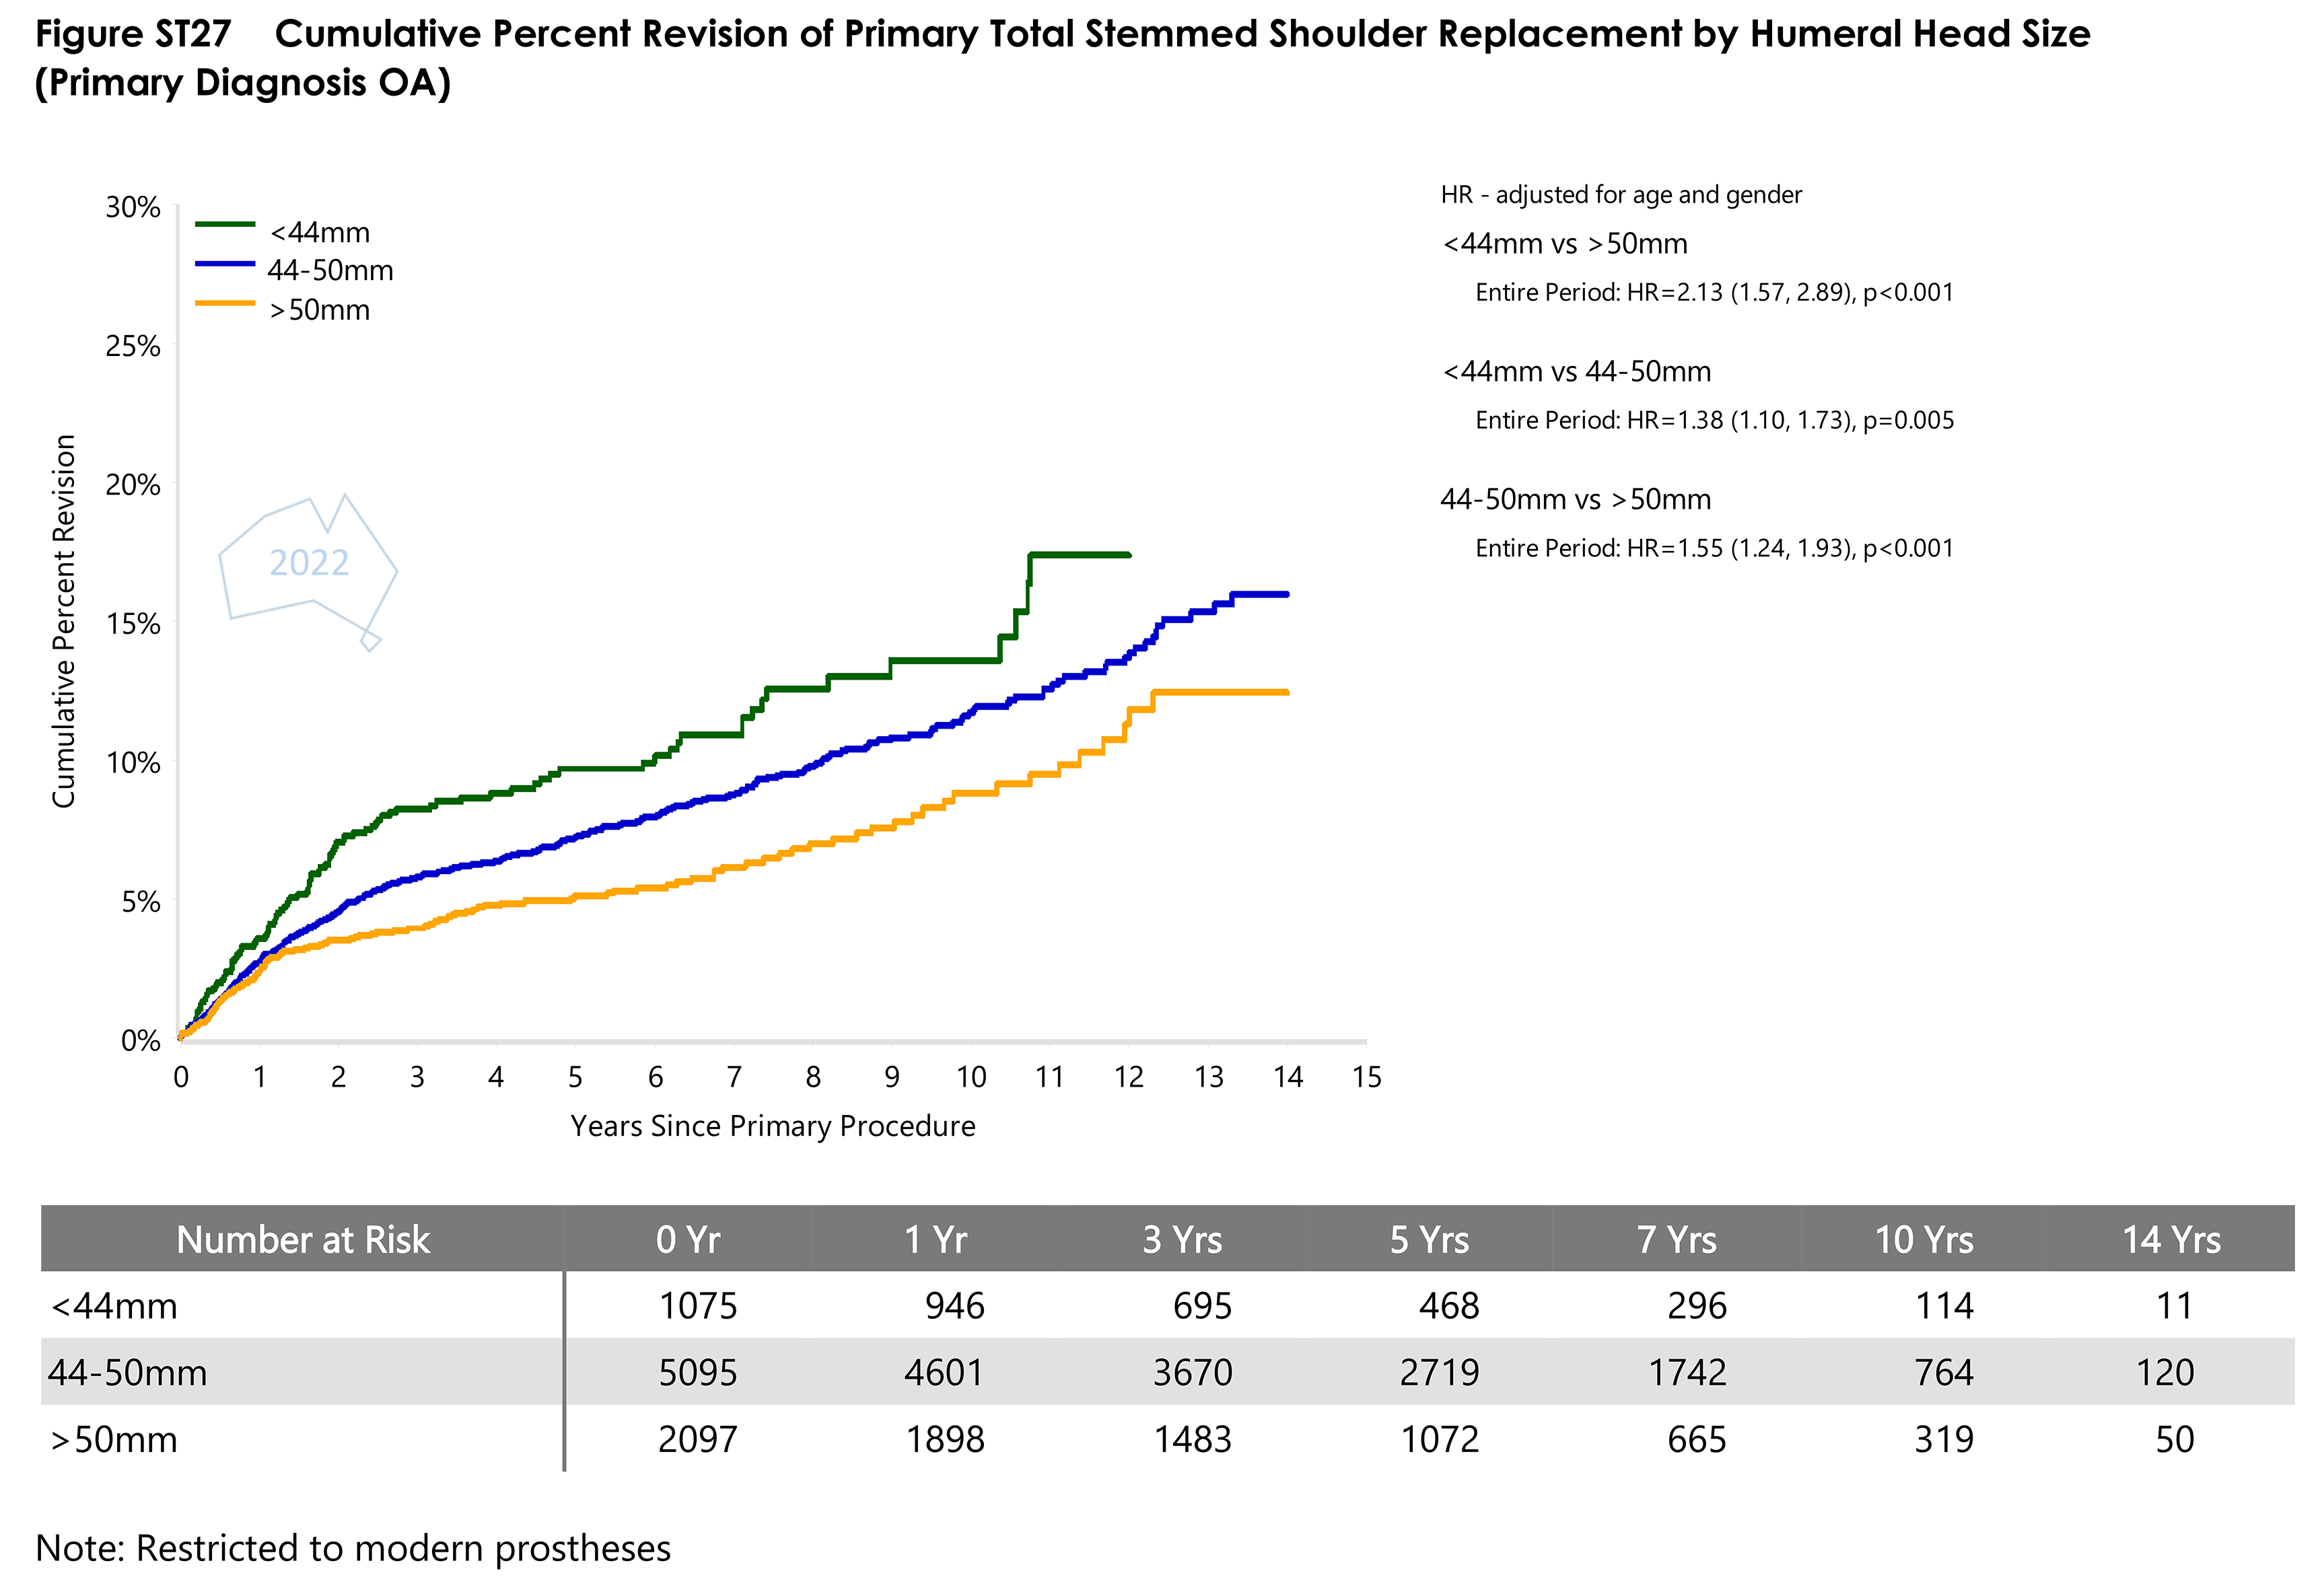
- Figure ST27 Cumulative Percent Revision of Primary Total Stemmed Shoulder Replacement by Humeral Head SizePDF · 82 KB
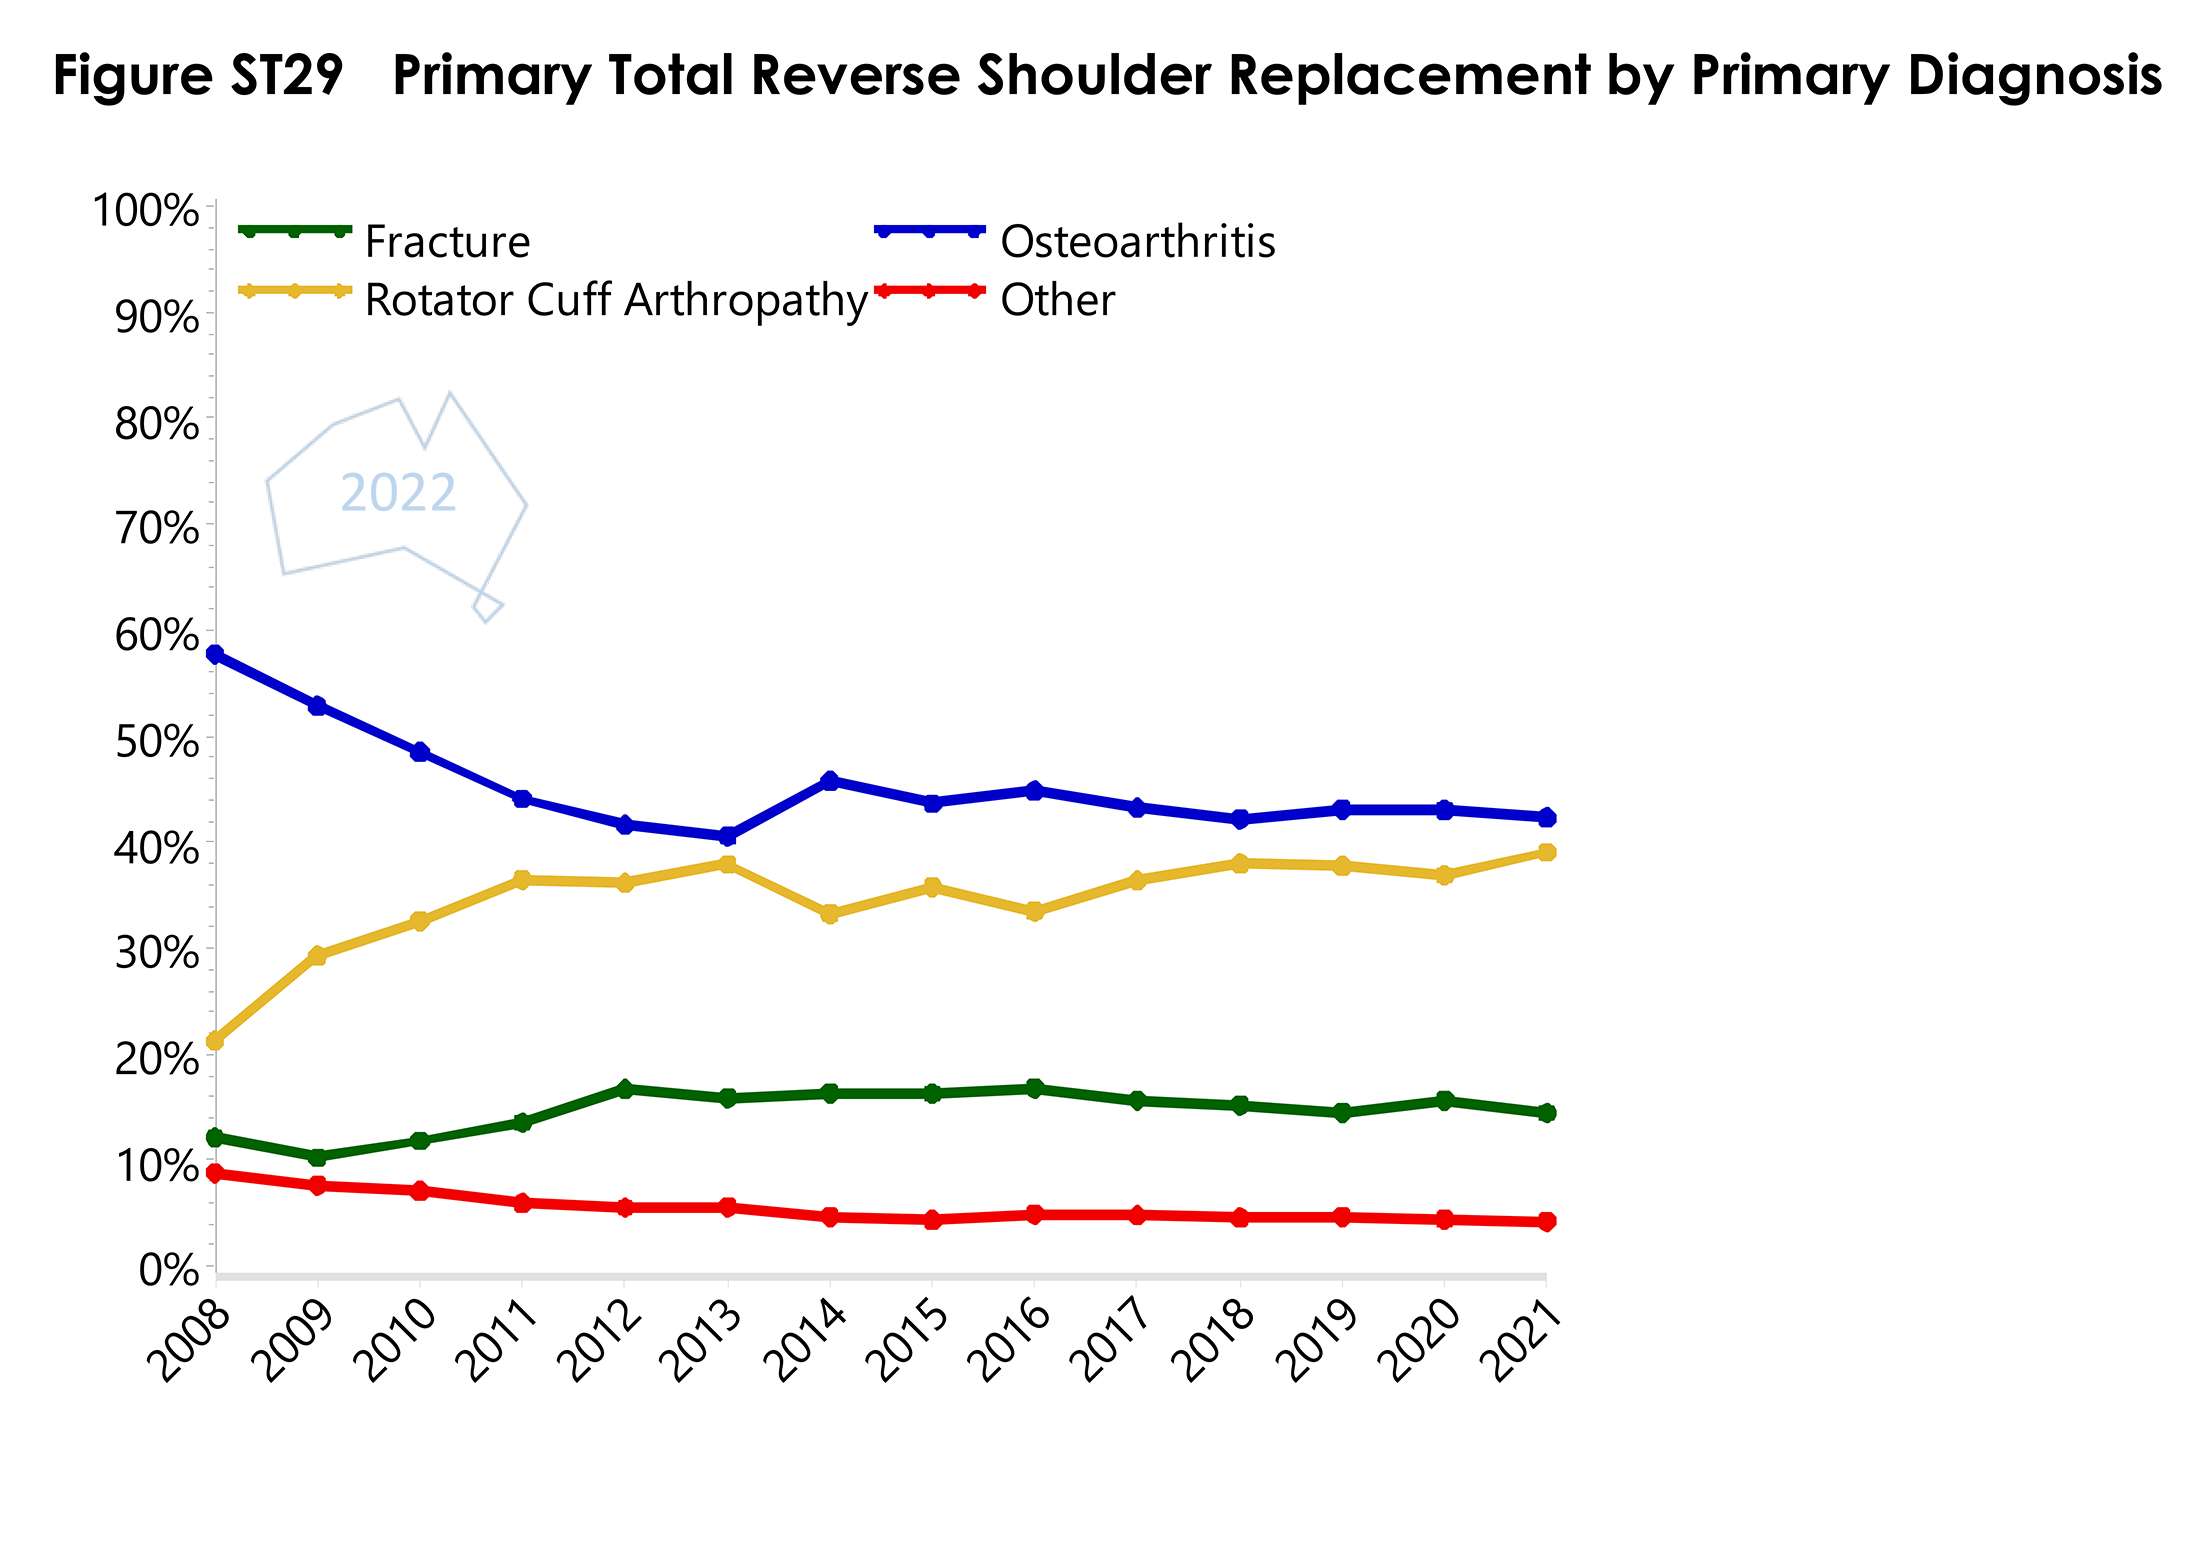
- Figure ST29 Primary Total Reverse Shoulder Replacement by Primary DiagnosisPDF · 47 KB
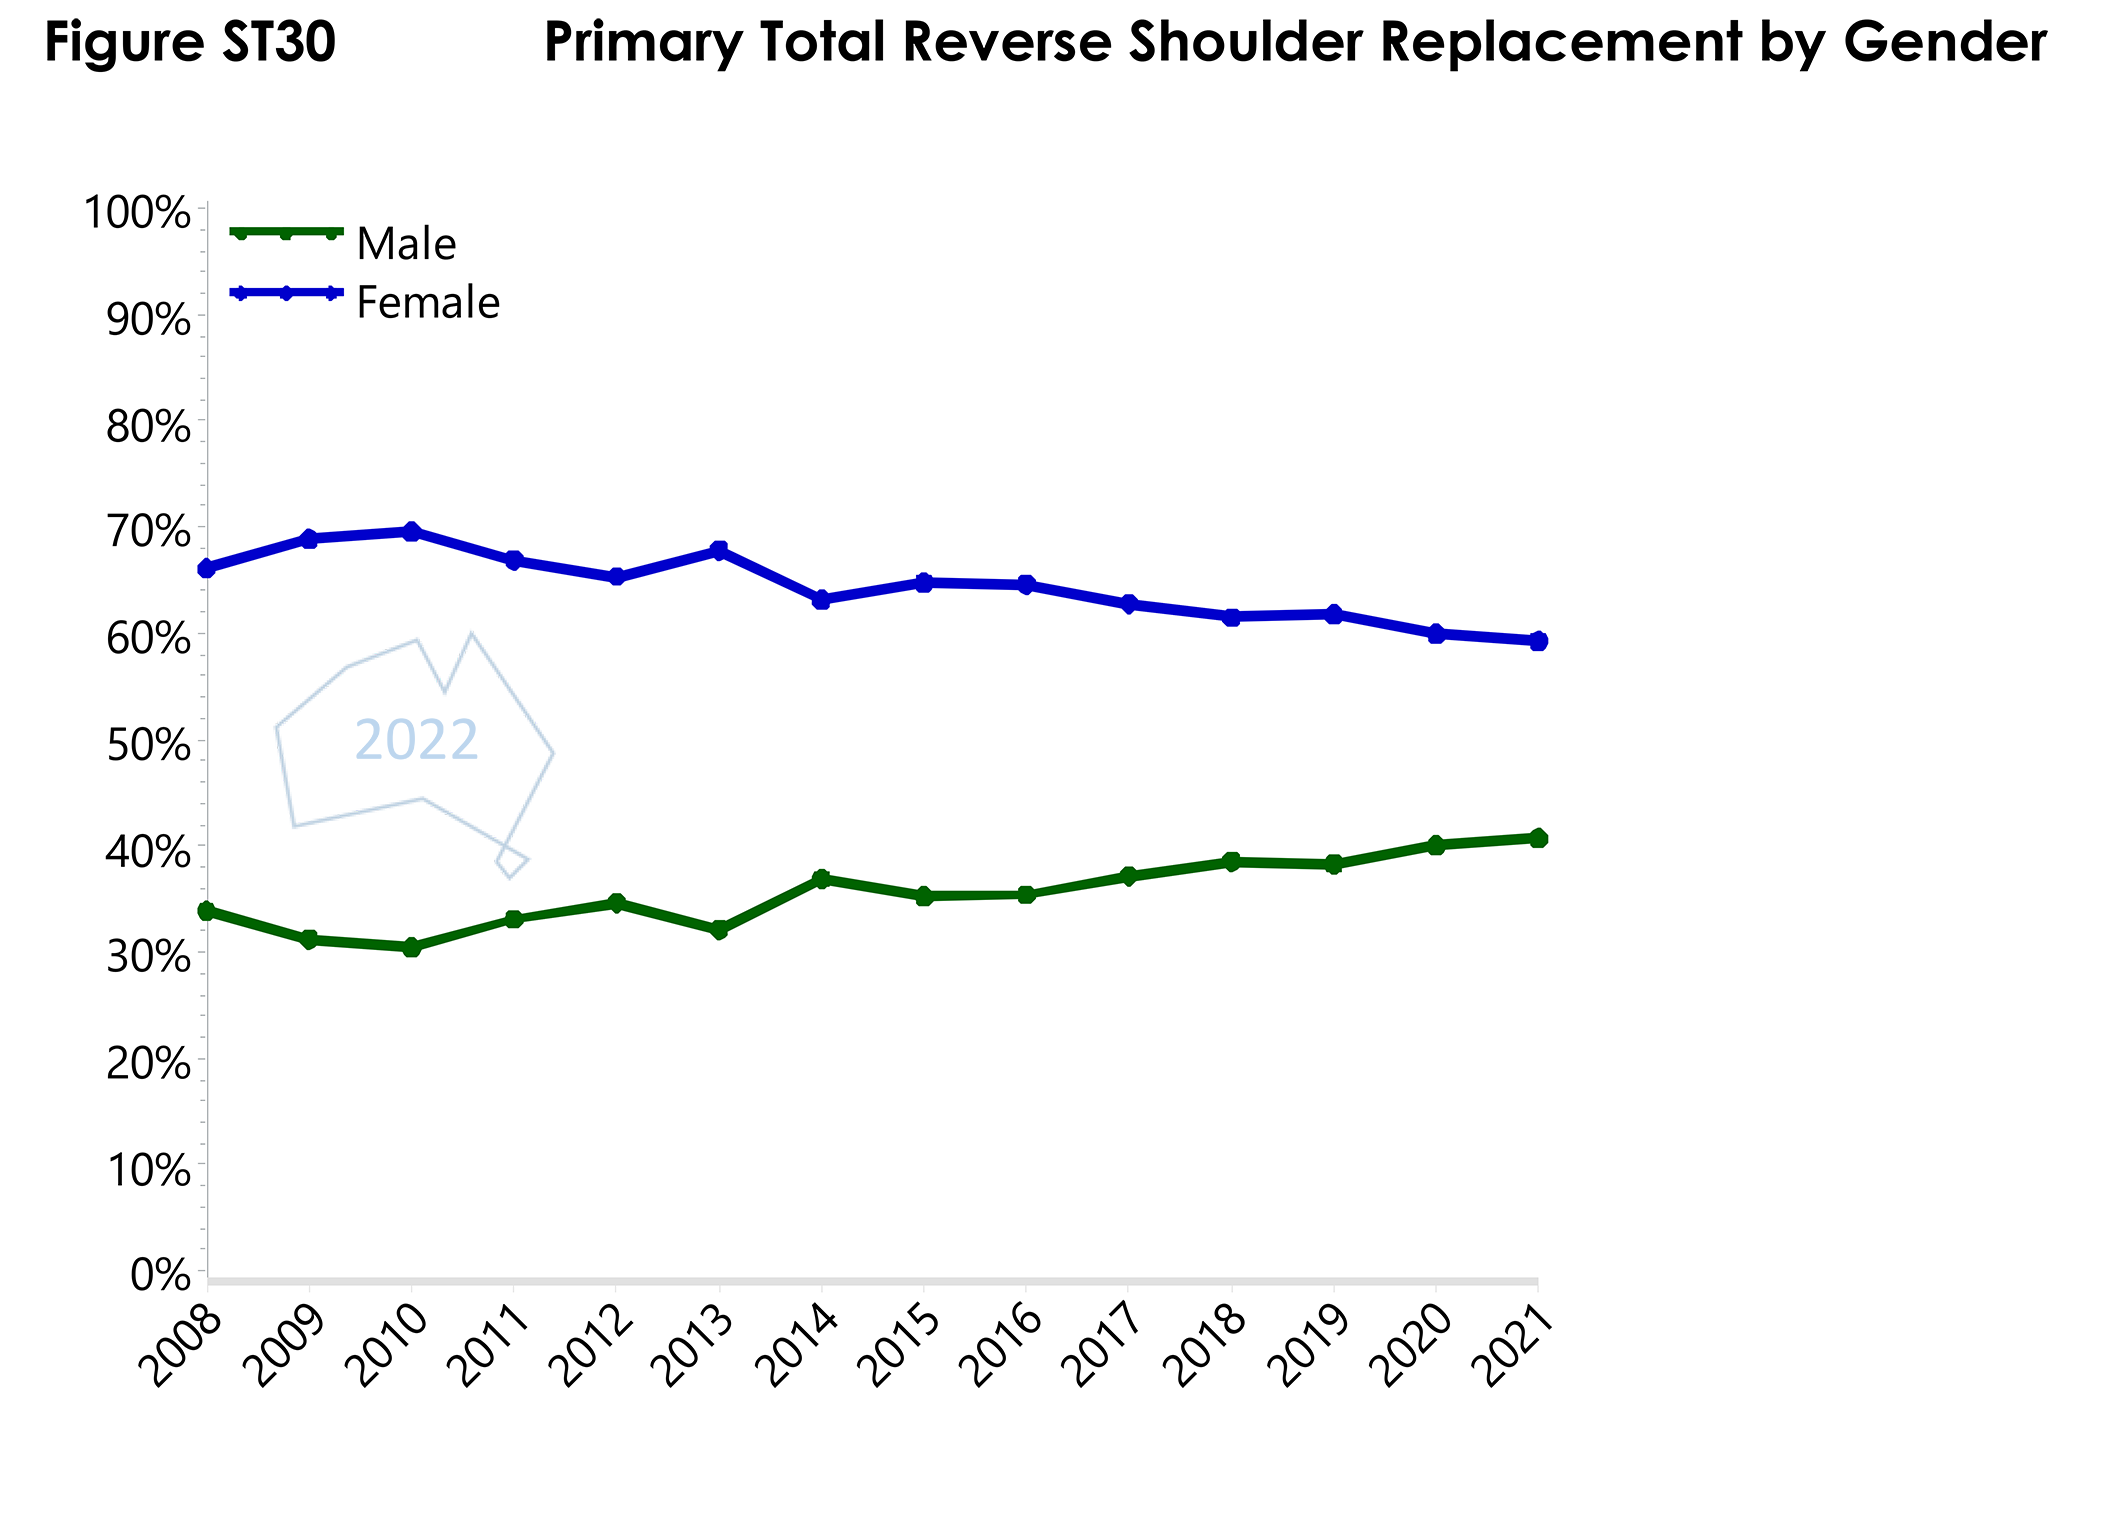
- Figure ST30Primary Total Reverse Shoulder Replacement by GenderPDF · 40 KB
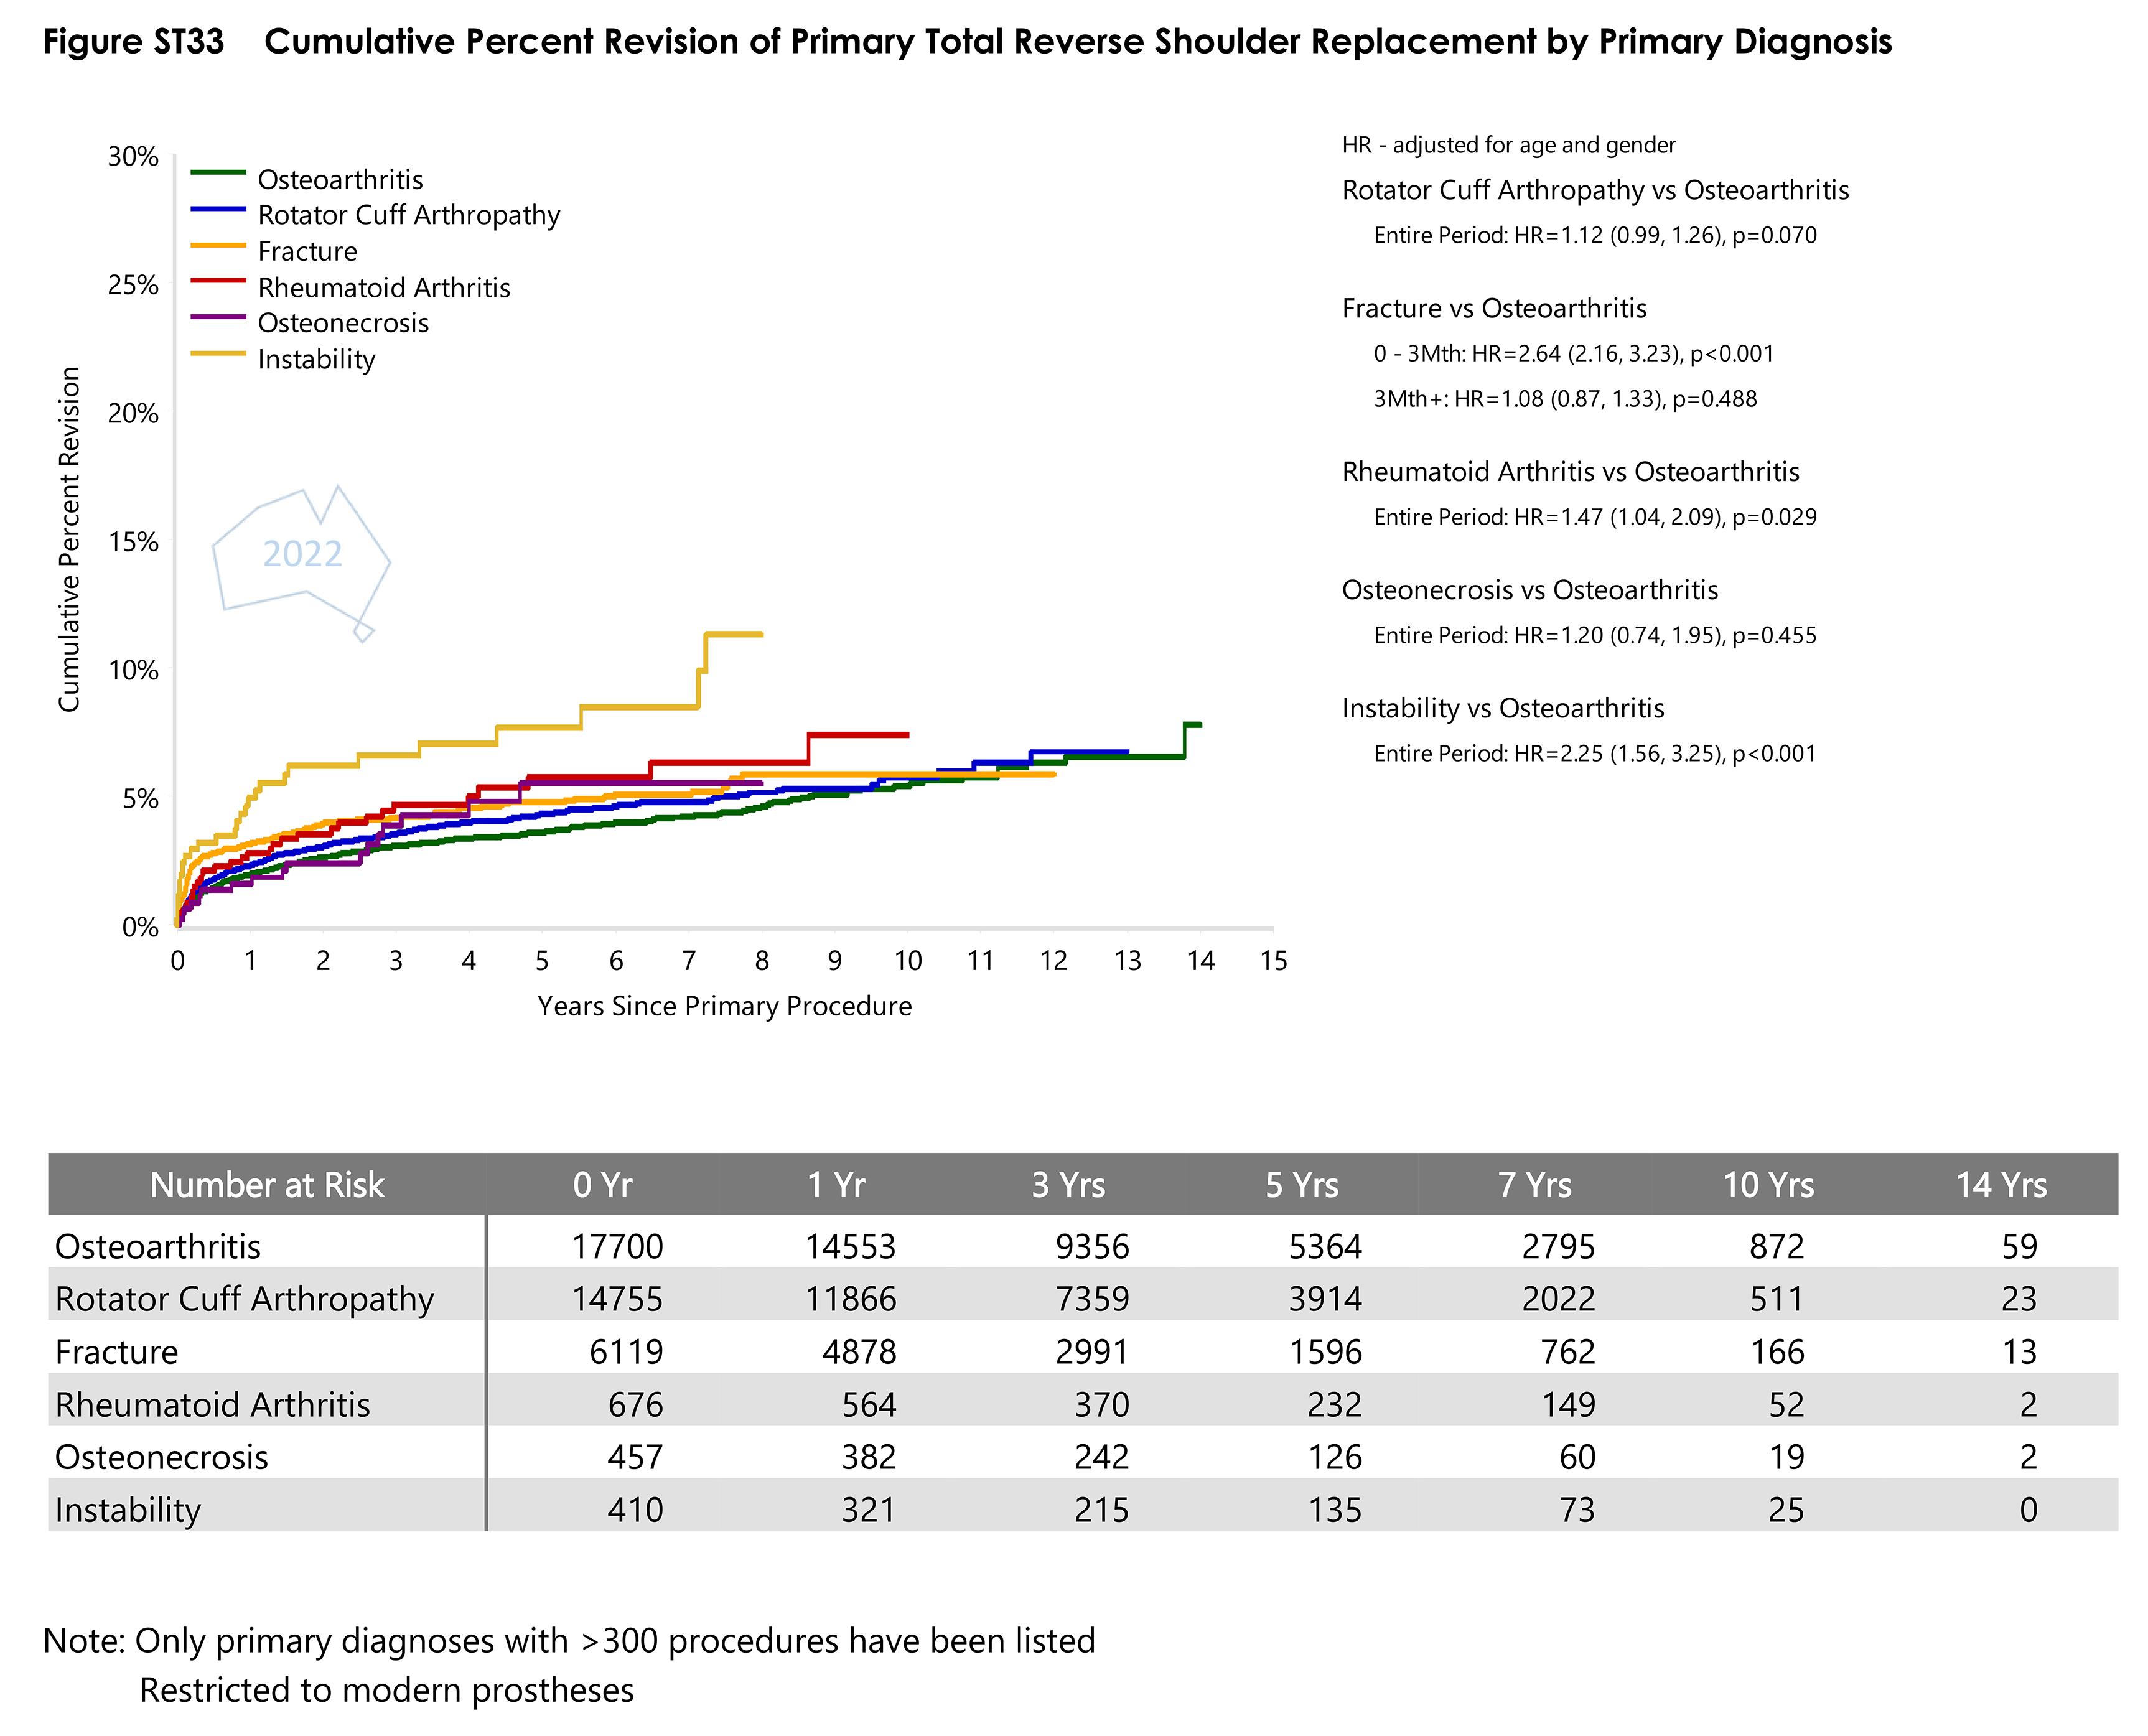
- Figure ST33 Cumulative Percent Revision of Primary Total Reverse Shoulder Replacement by Primary DiagnosisPDF · 116 KB
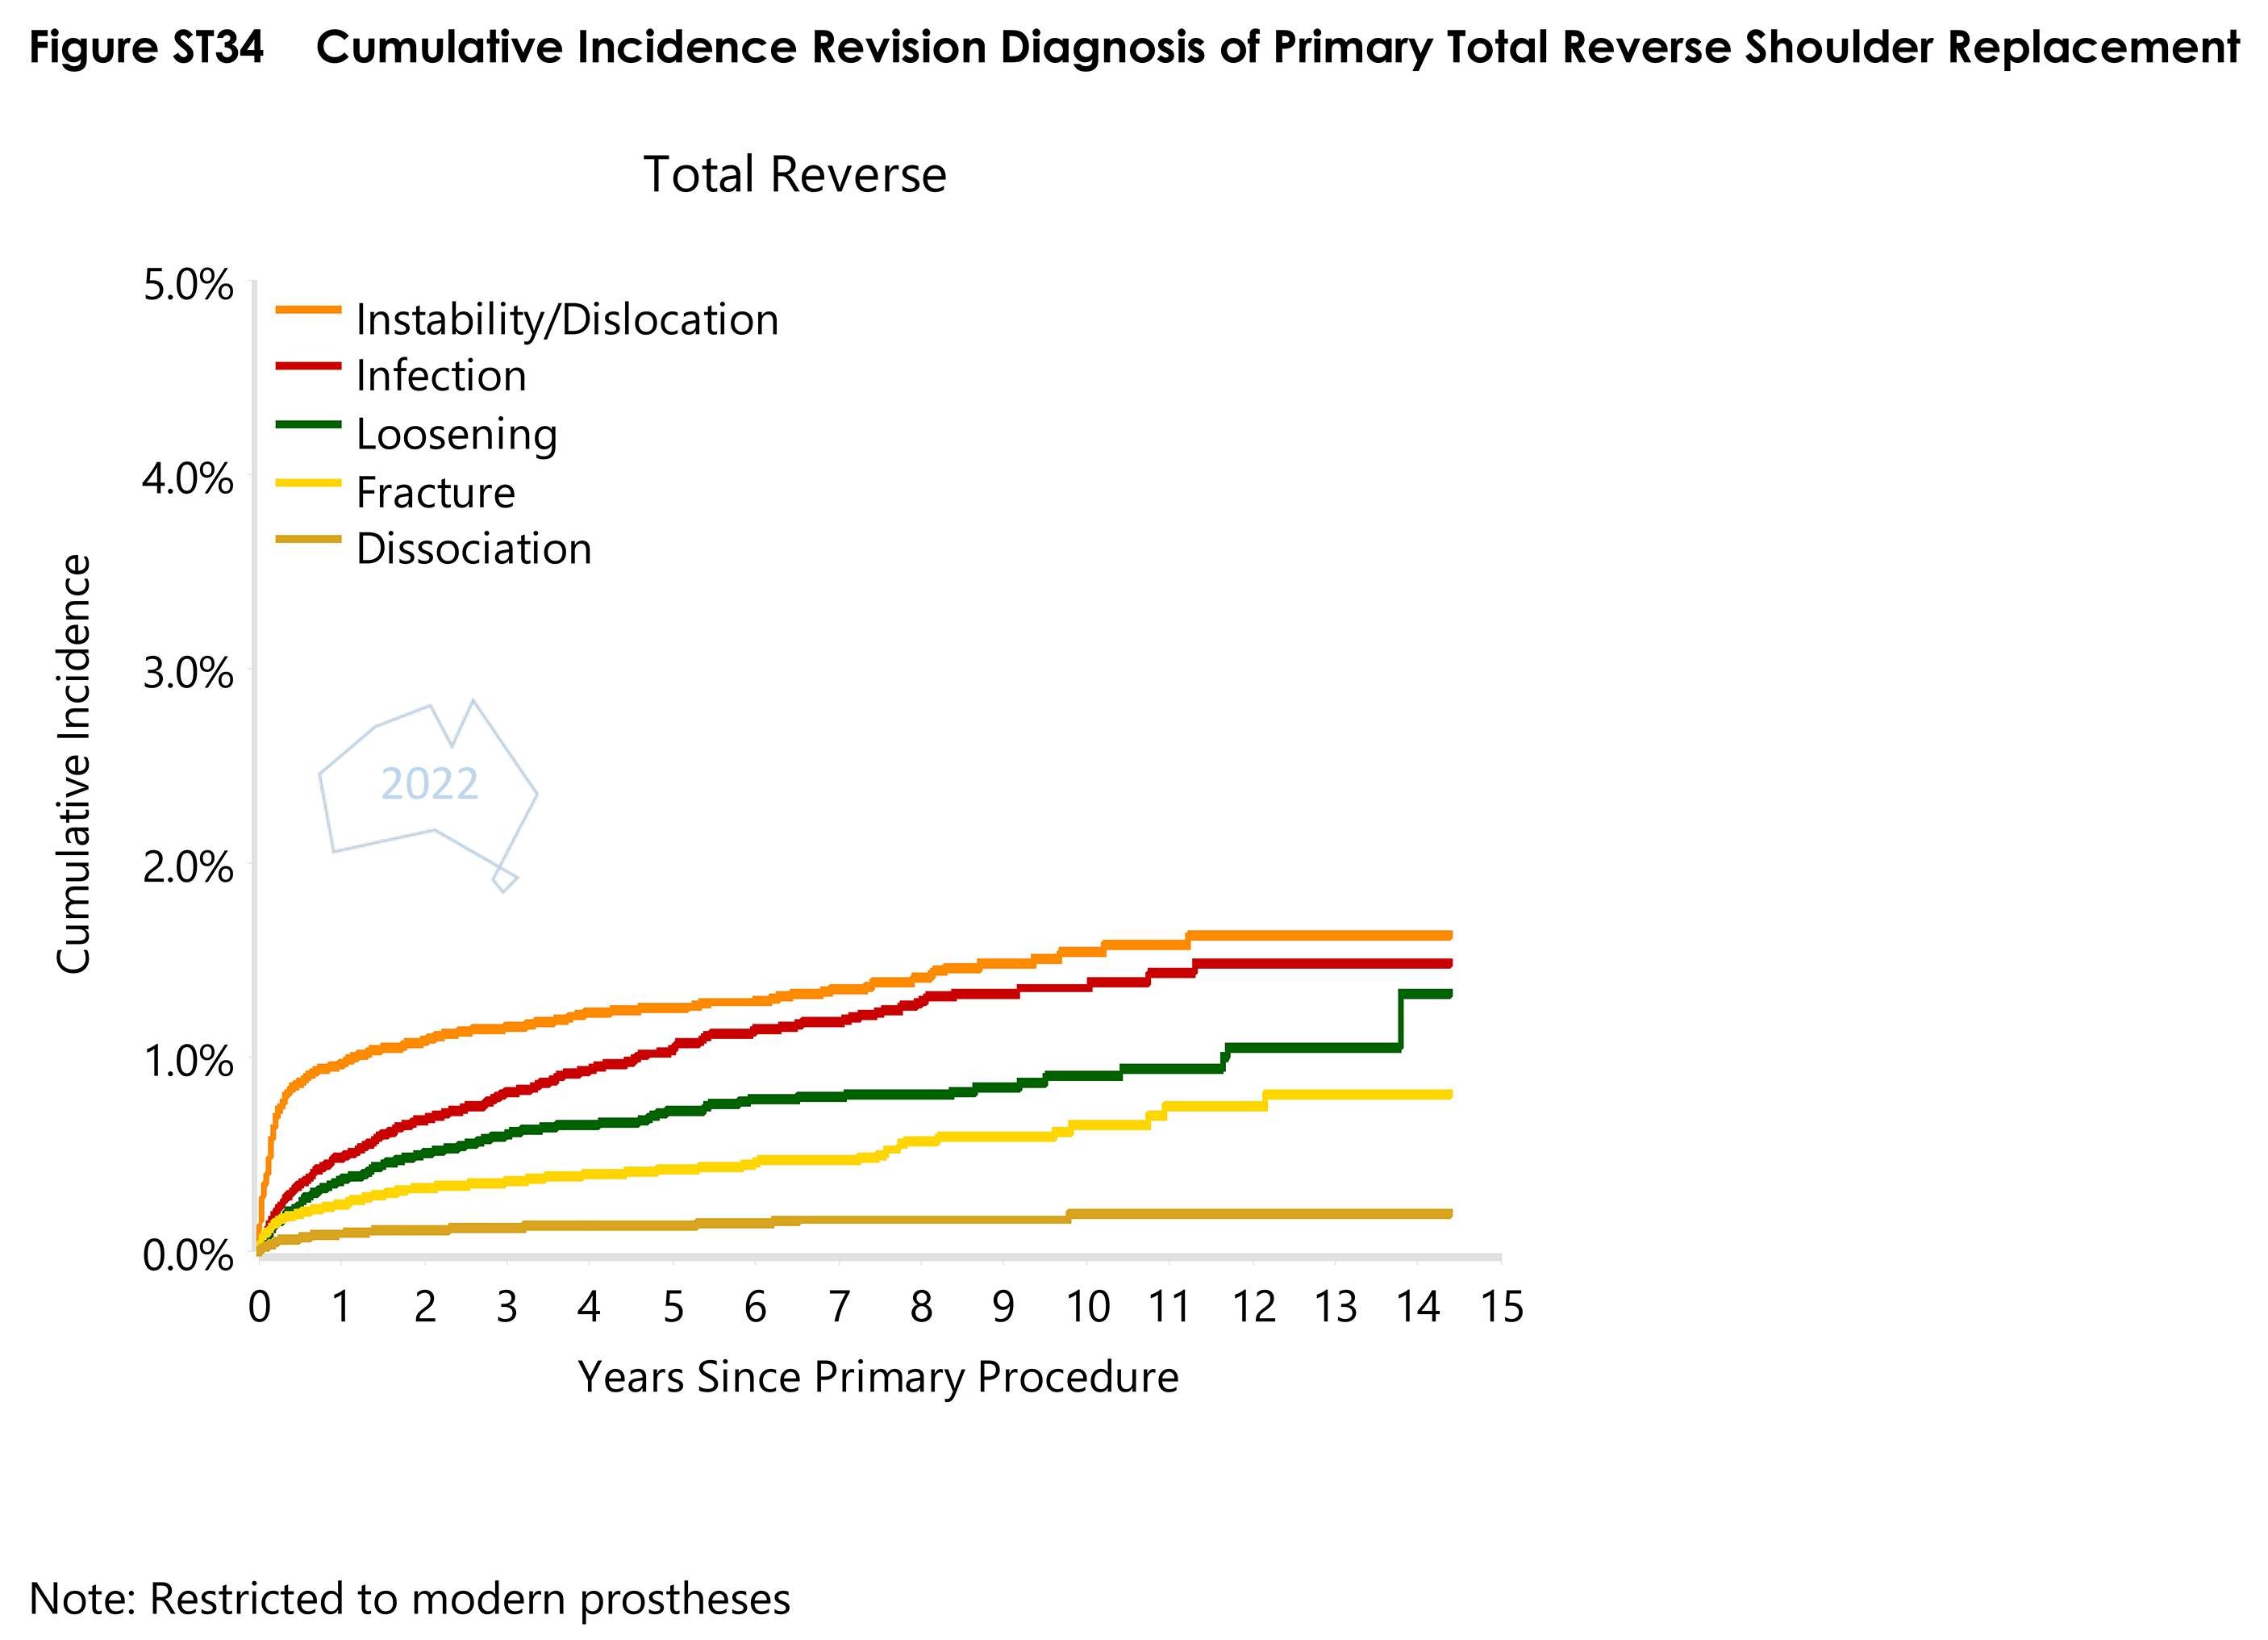
- Figure ST34 Cumulative Incidence Revision Diagnosis of Primary Total Reverse Shoulder ReplacementPDF · 79 KB
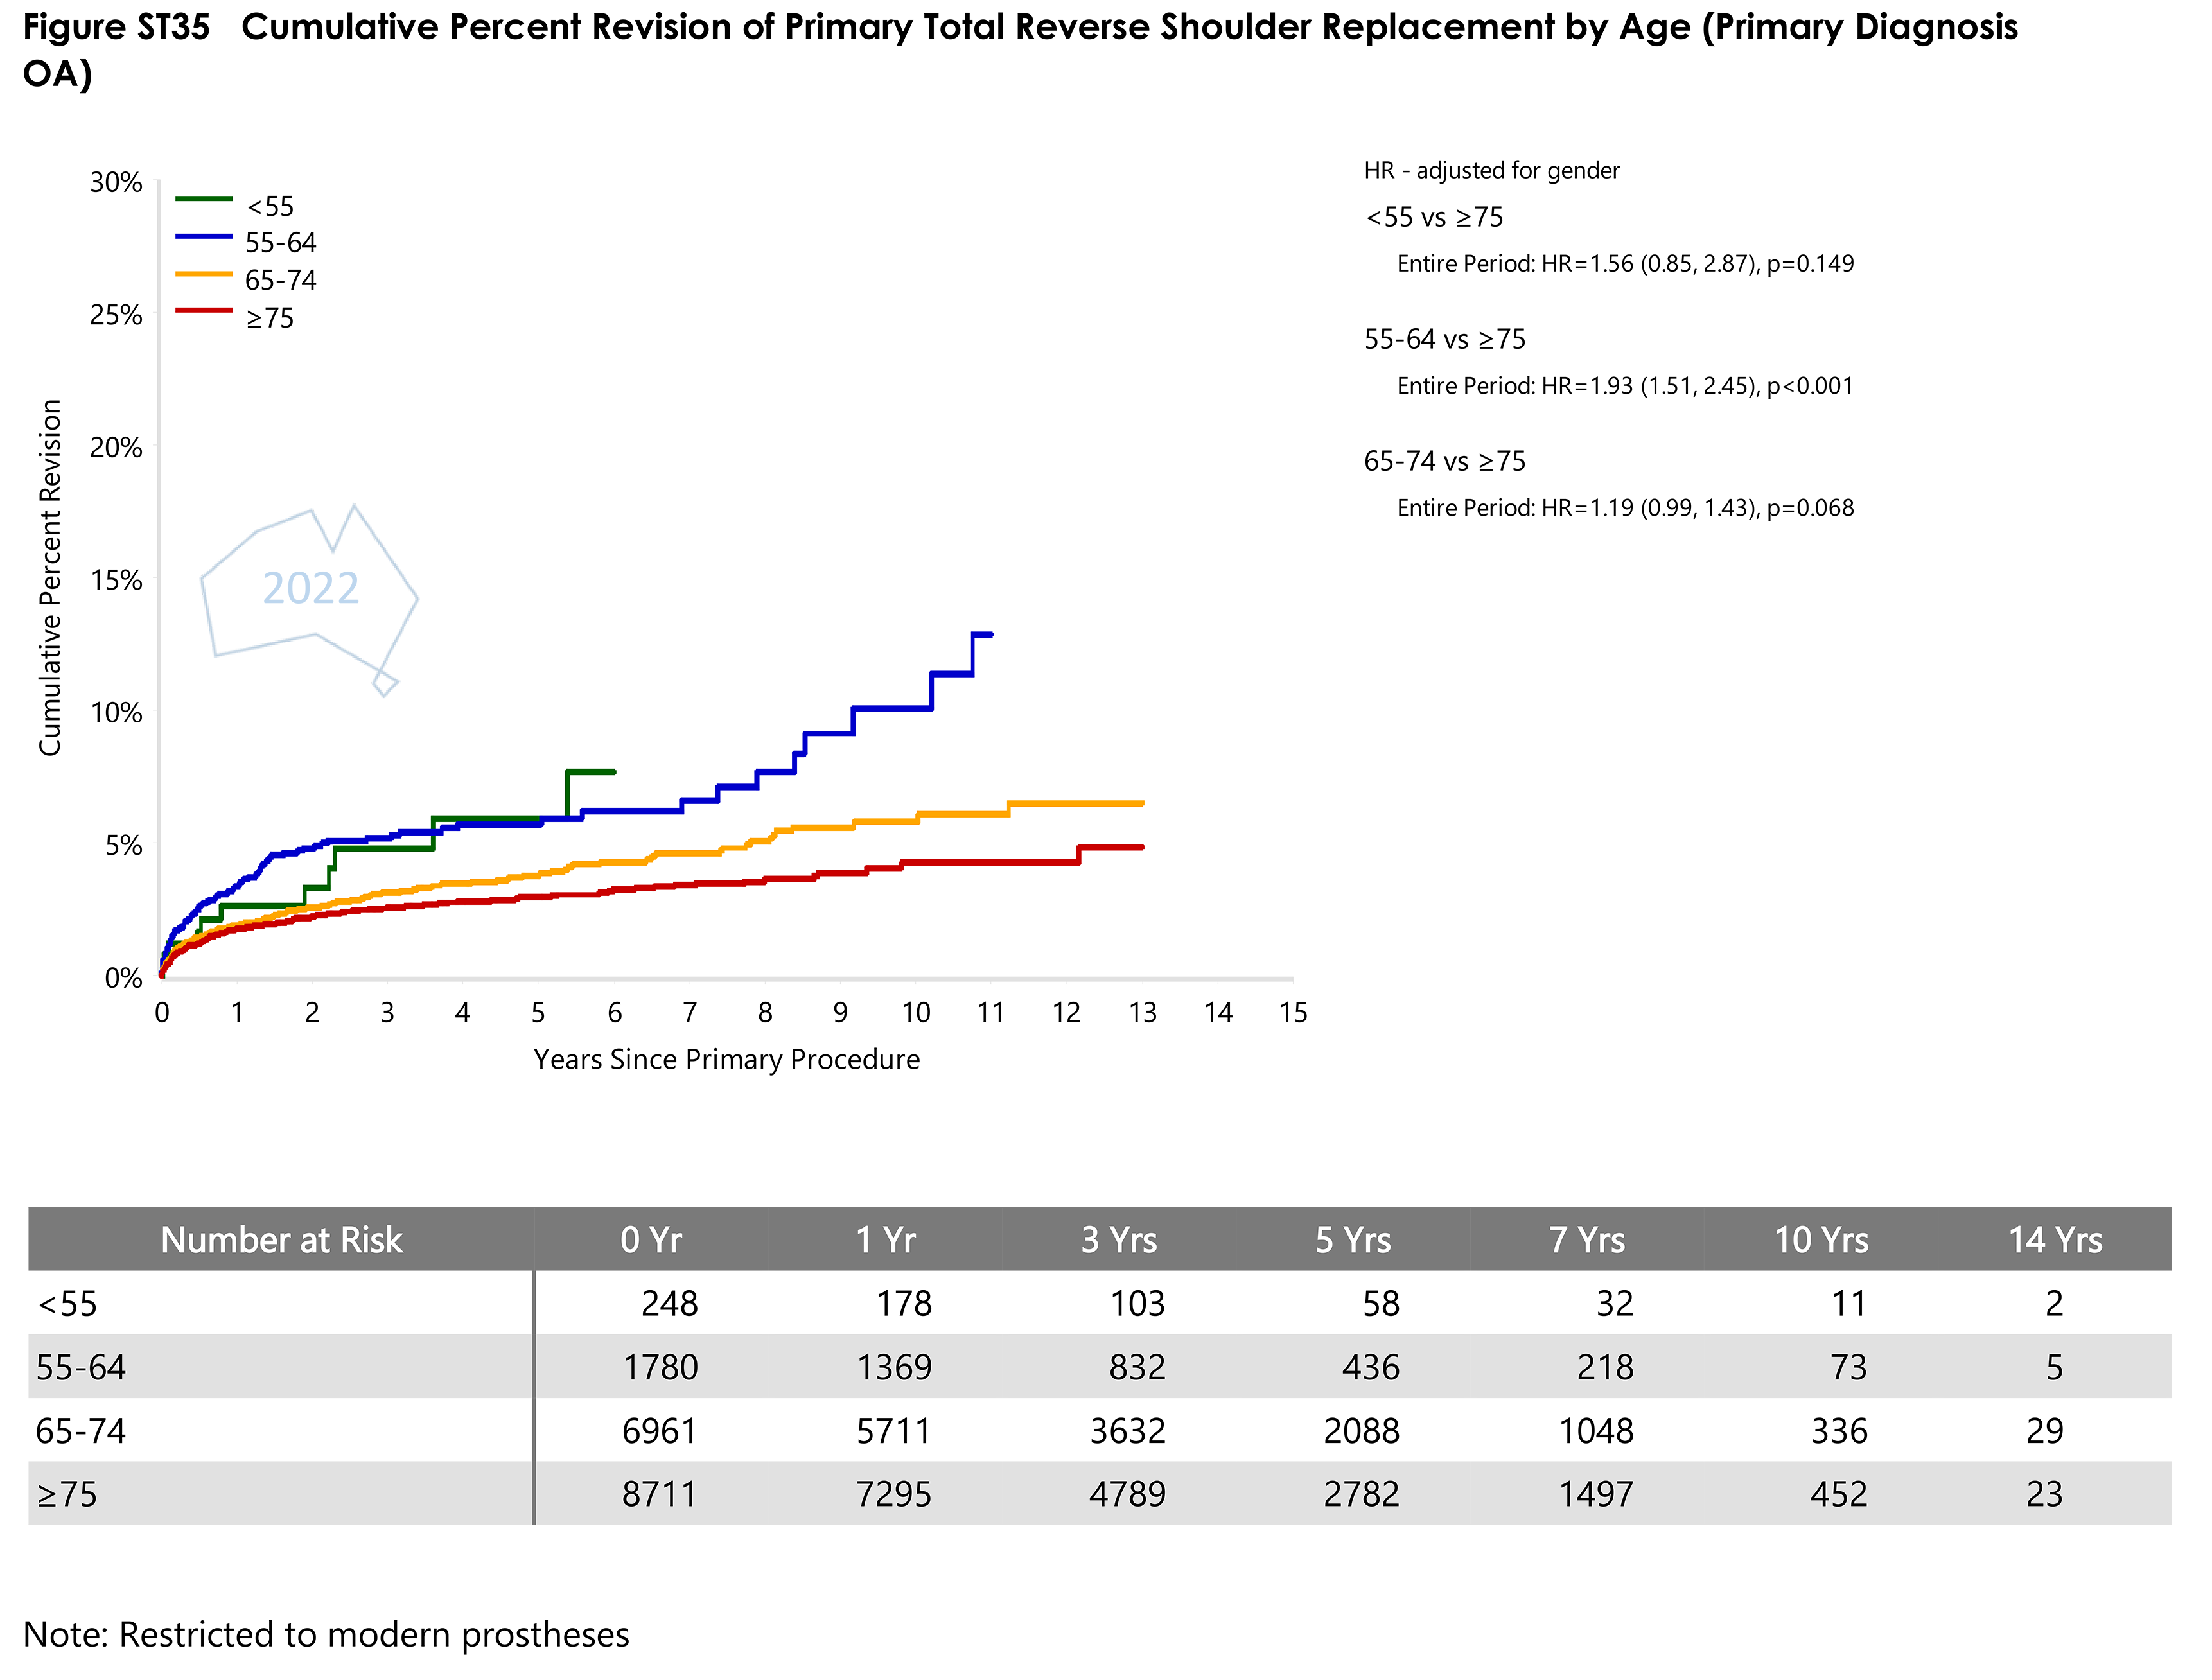
- Figure ST35 Cumulative Percent Revision of Primary Total Reverse Shoulder Replacement by AgePDF · 75 KB
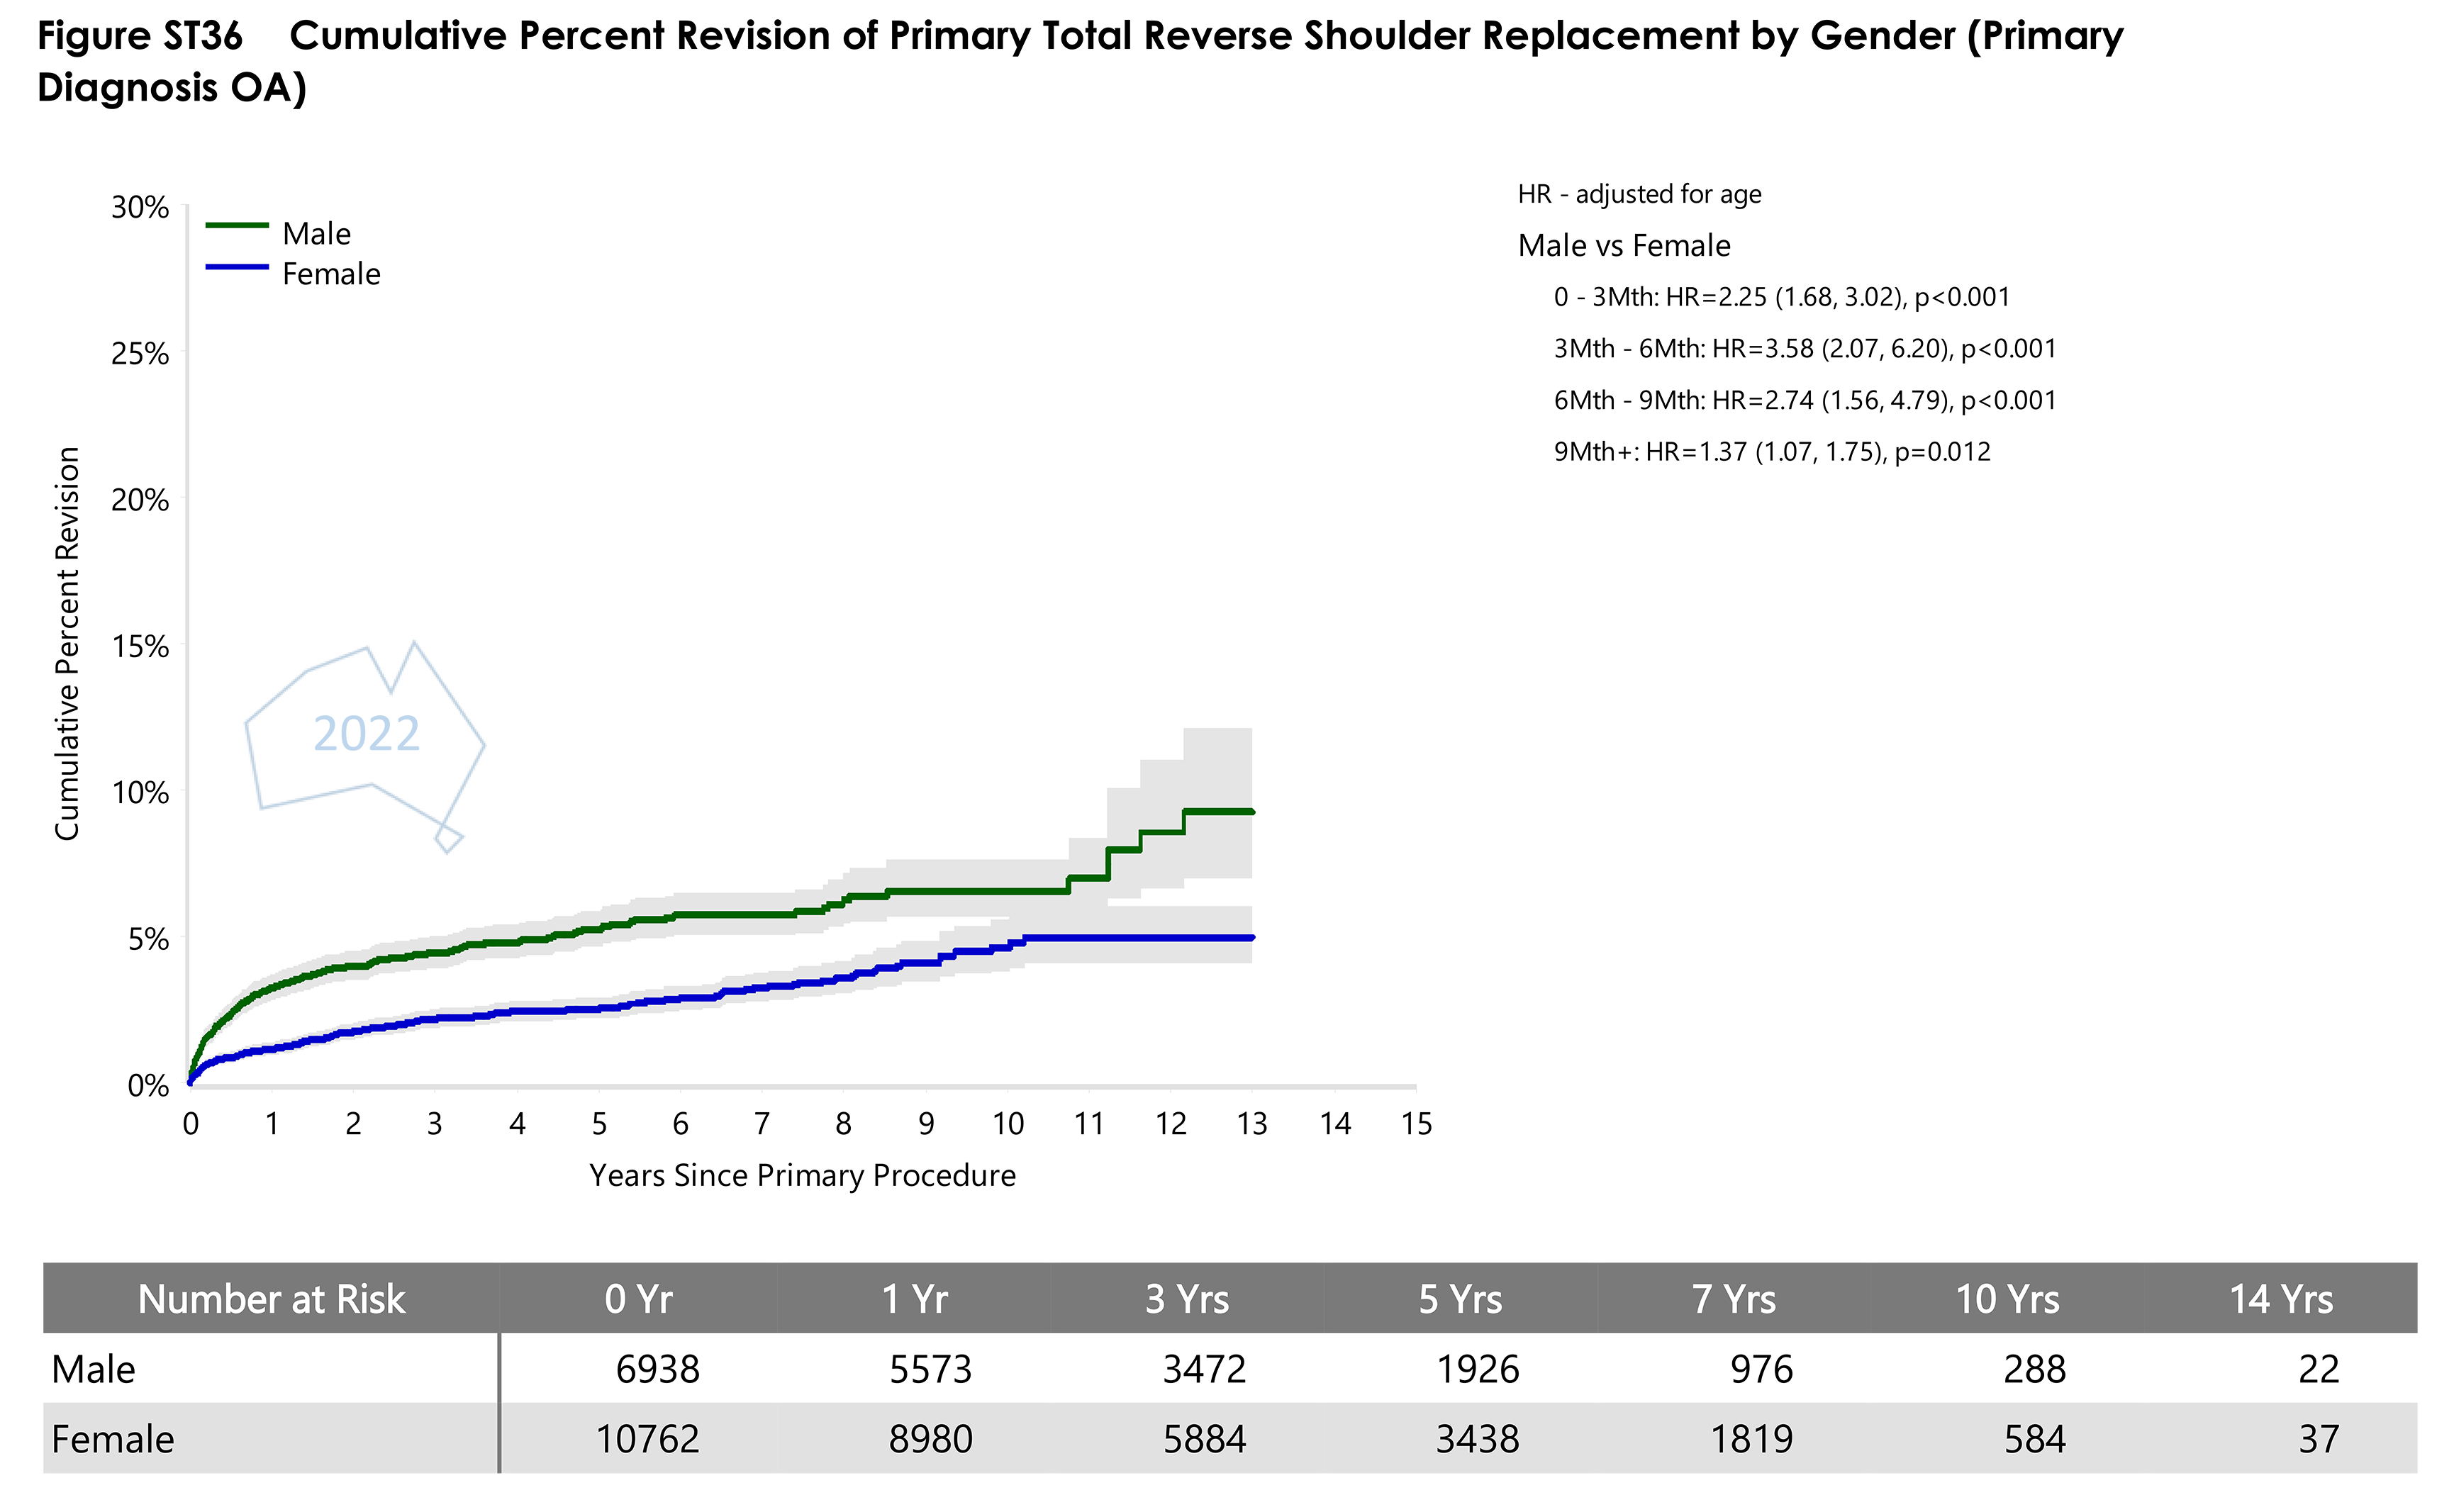
- Figure ST36 Cumulative Percent Revision of Primary Total Reverse Shoulder Replacement by GenderPDF · 72 KB
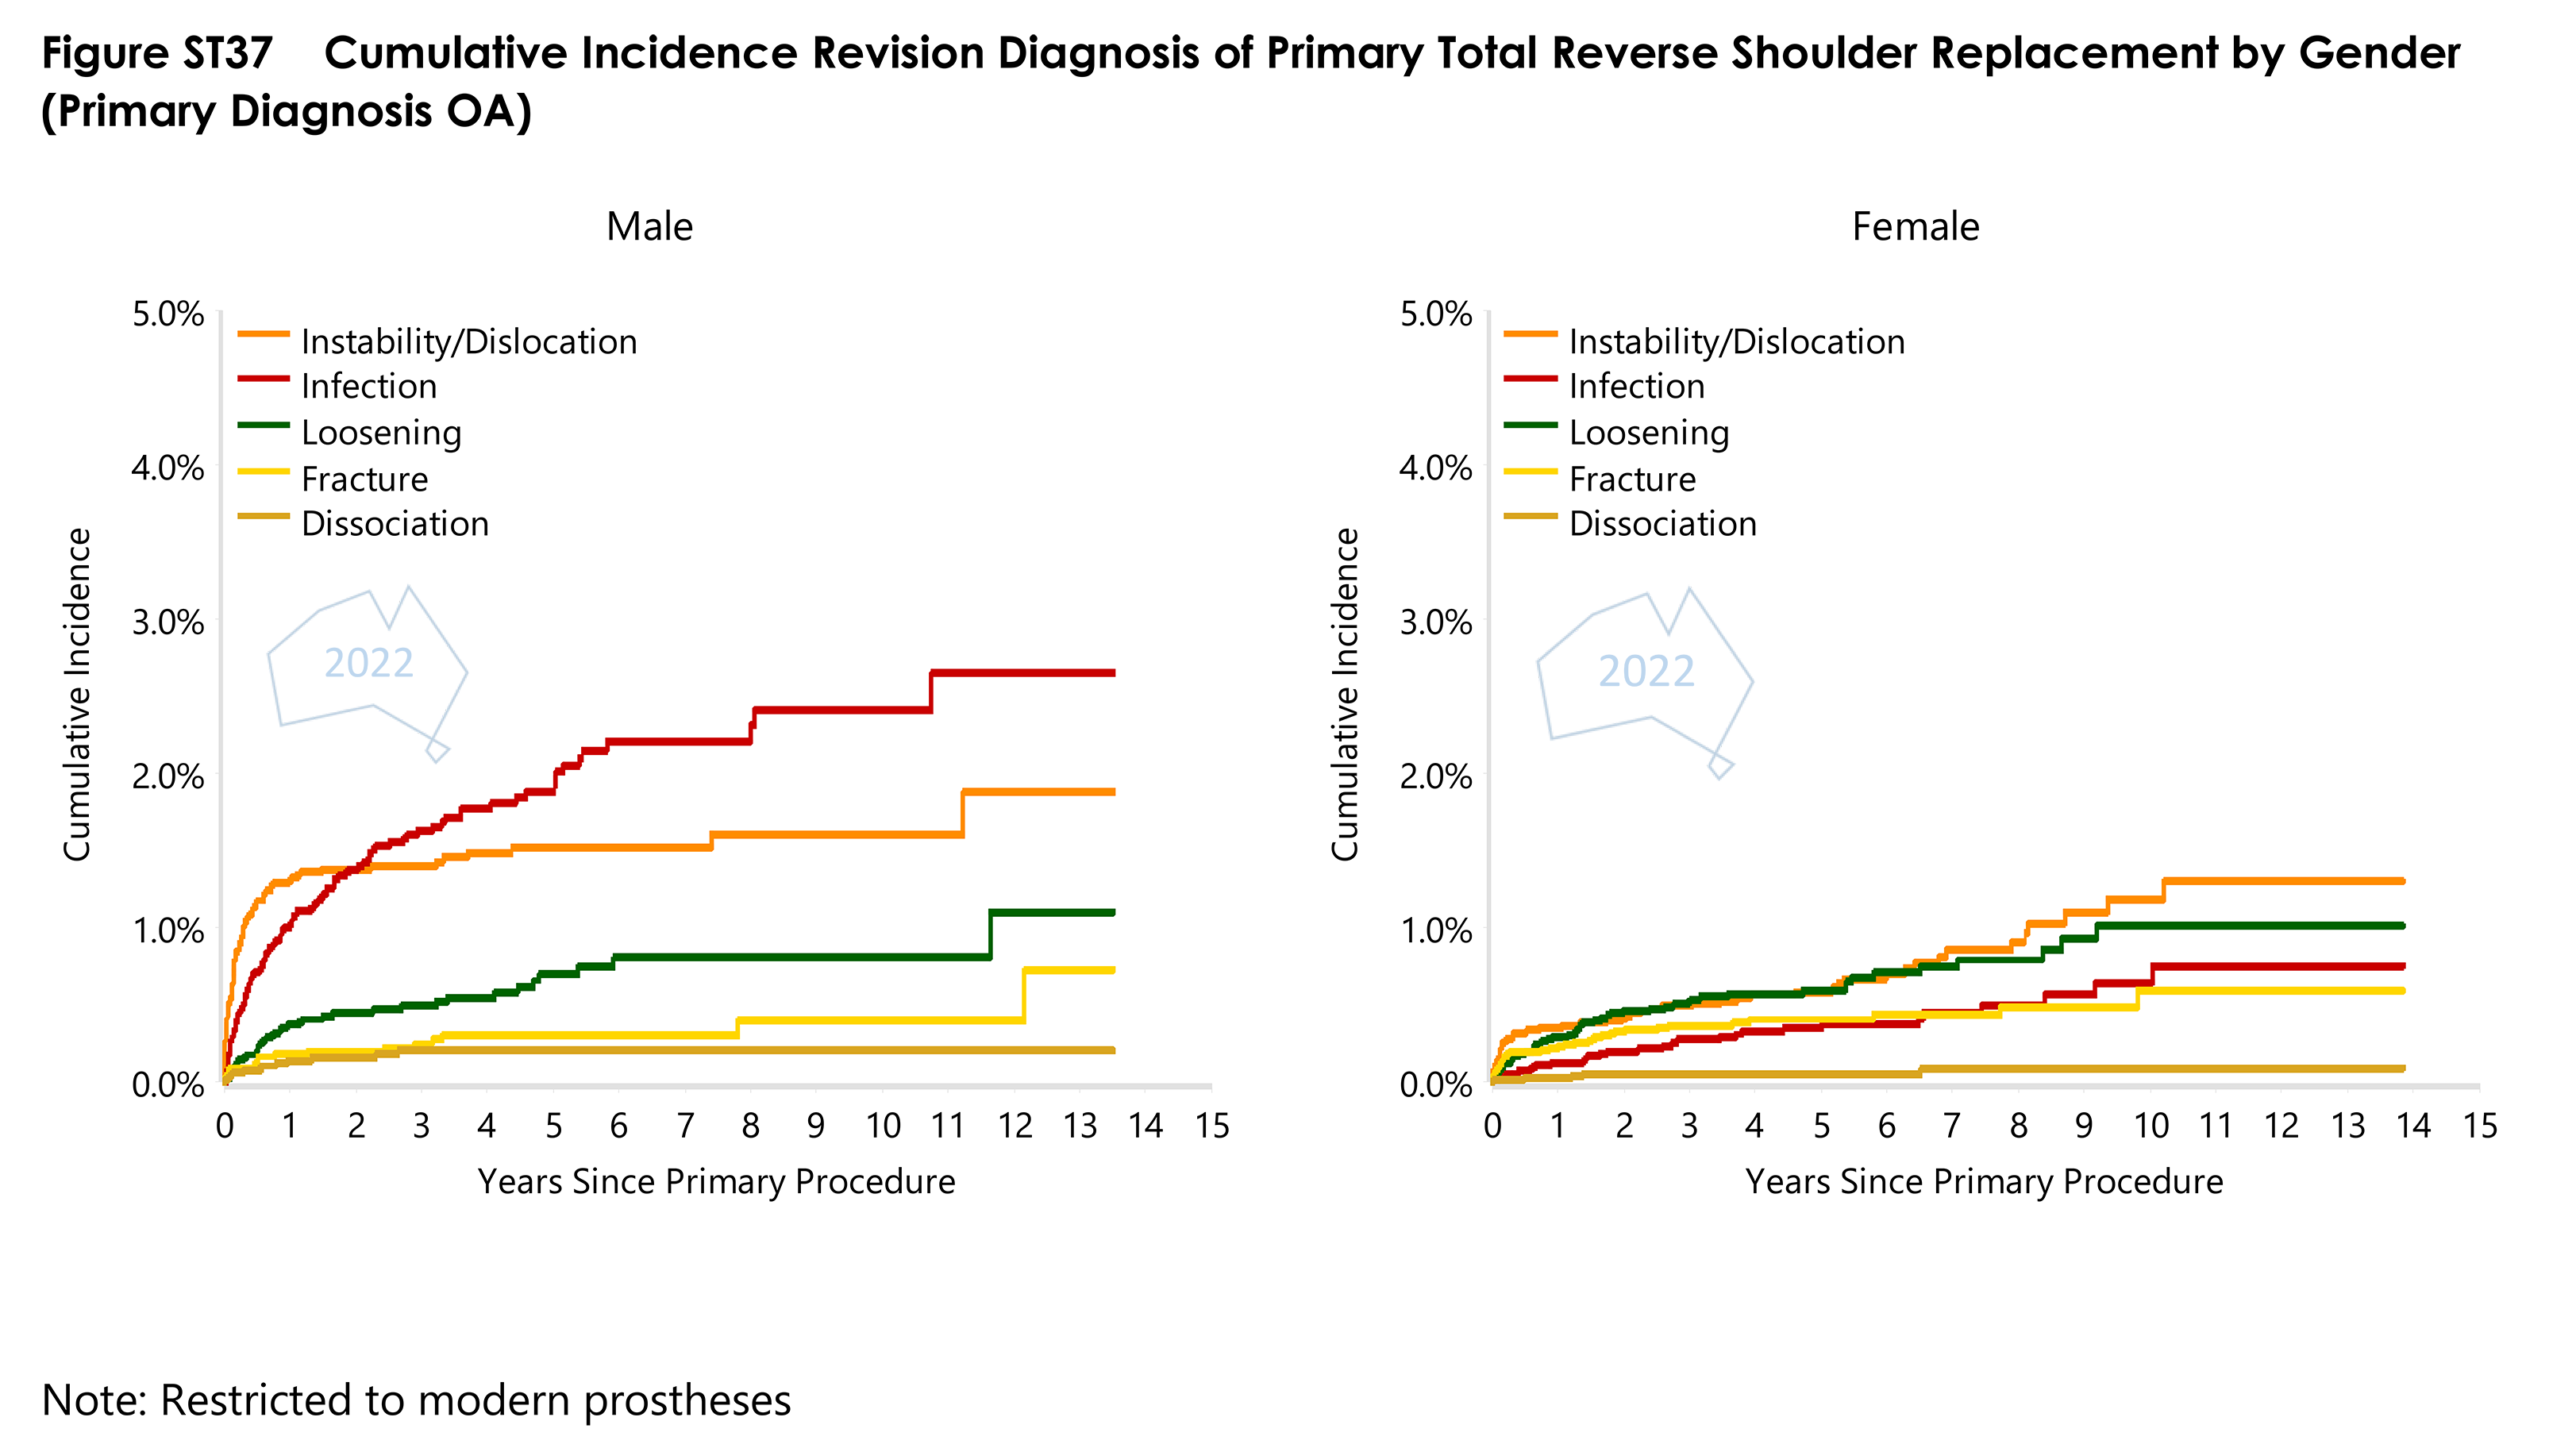
- Figure ST37 Cumulative Incidence Revision Diagnosis of Primary Total Reverse Shoulder Replacement by GenderPDF · 69 KB
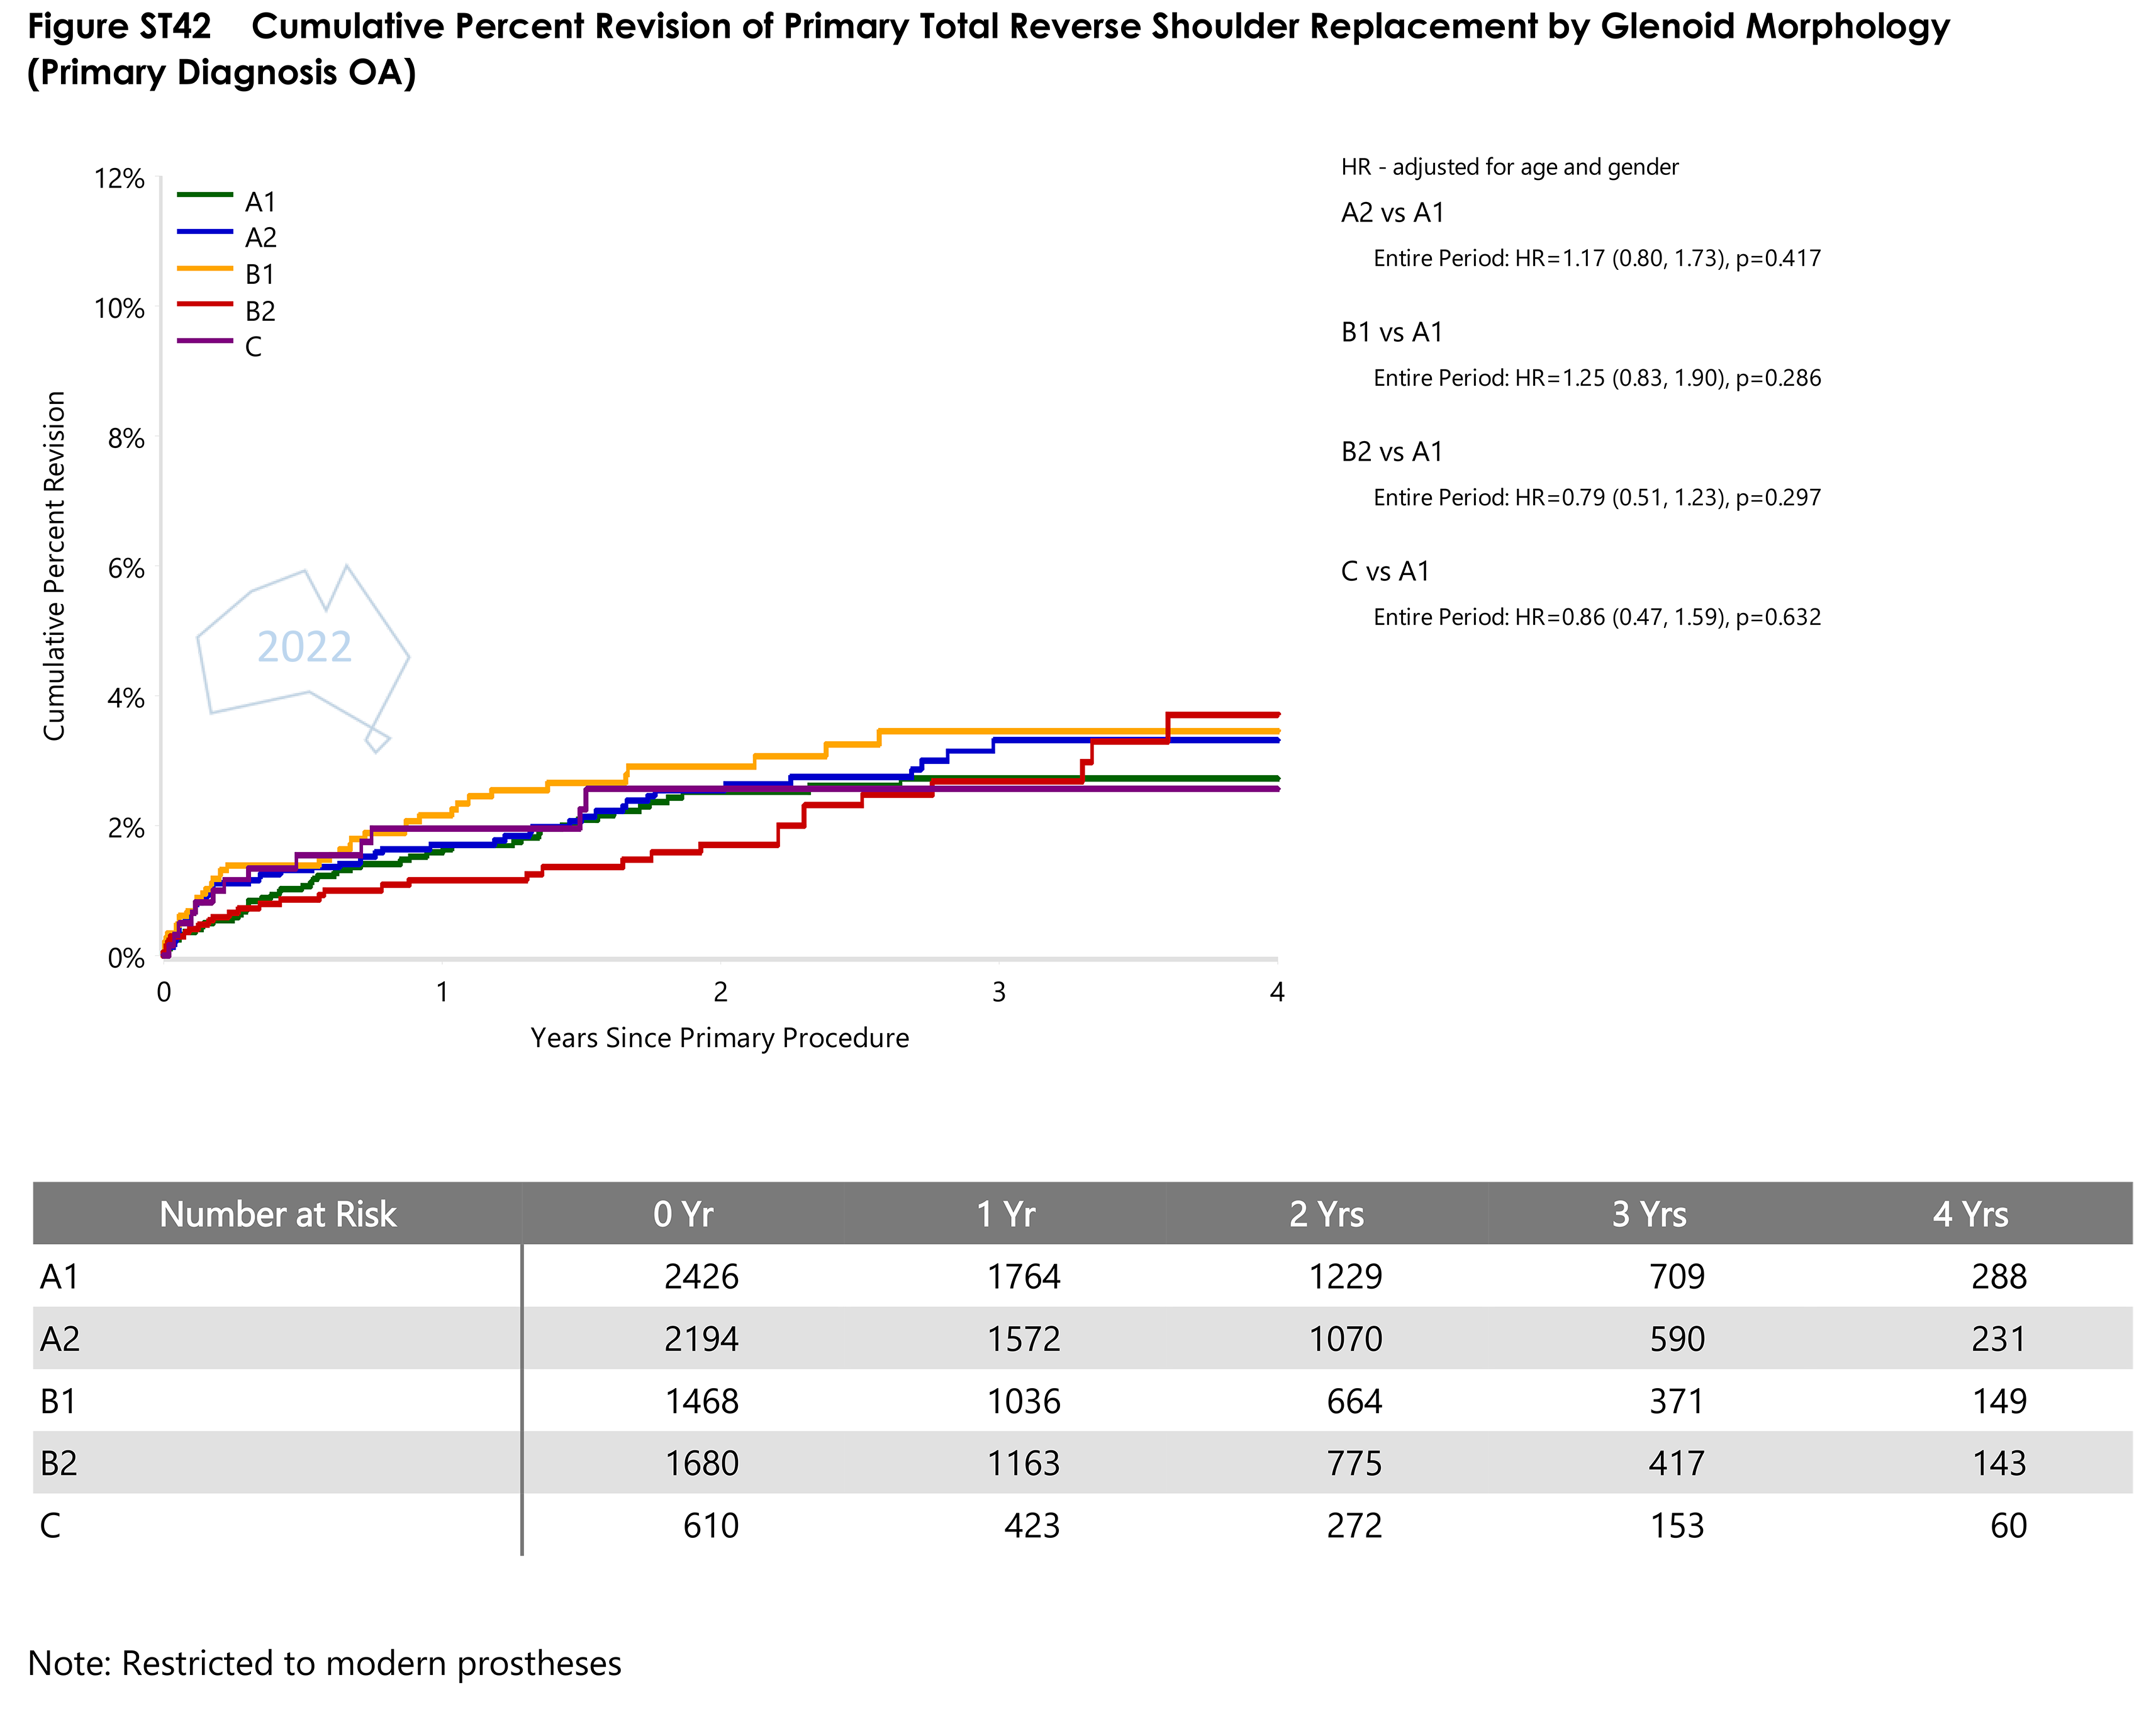
- Figure ST42 Cumulative Percent Revision of Primary Total Reverse Shoulder Replacement by Glenoid MorphologyPDF · 64 KB
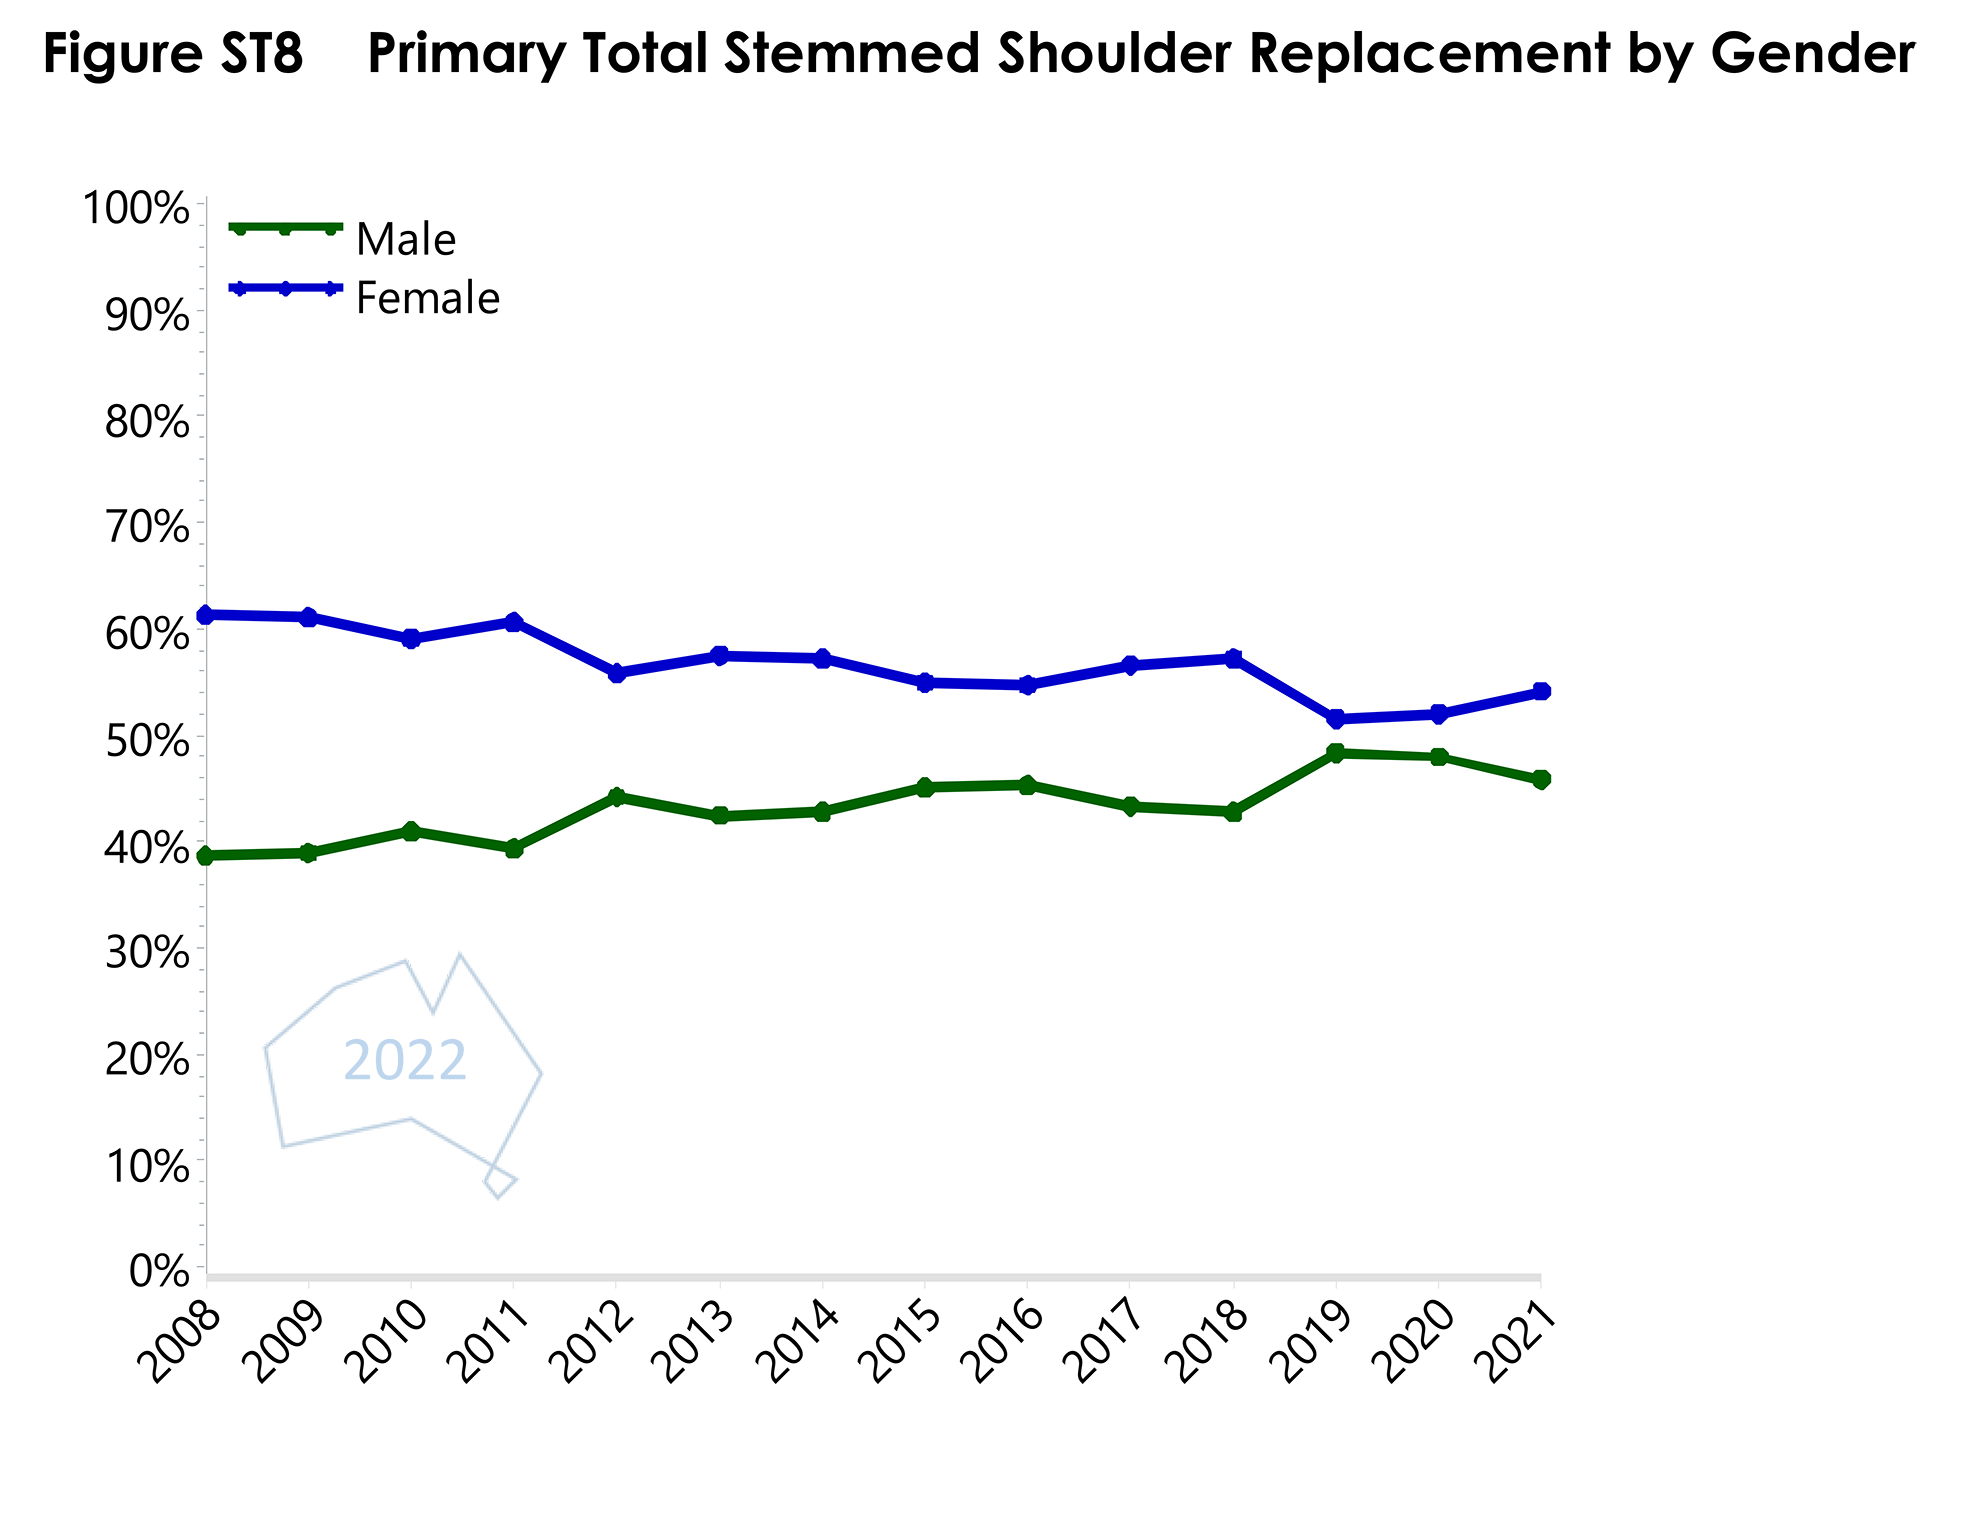
- Figure ST8 Primary Total Stemmed Shoulder Replacement by GenderPDF · 39 KB
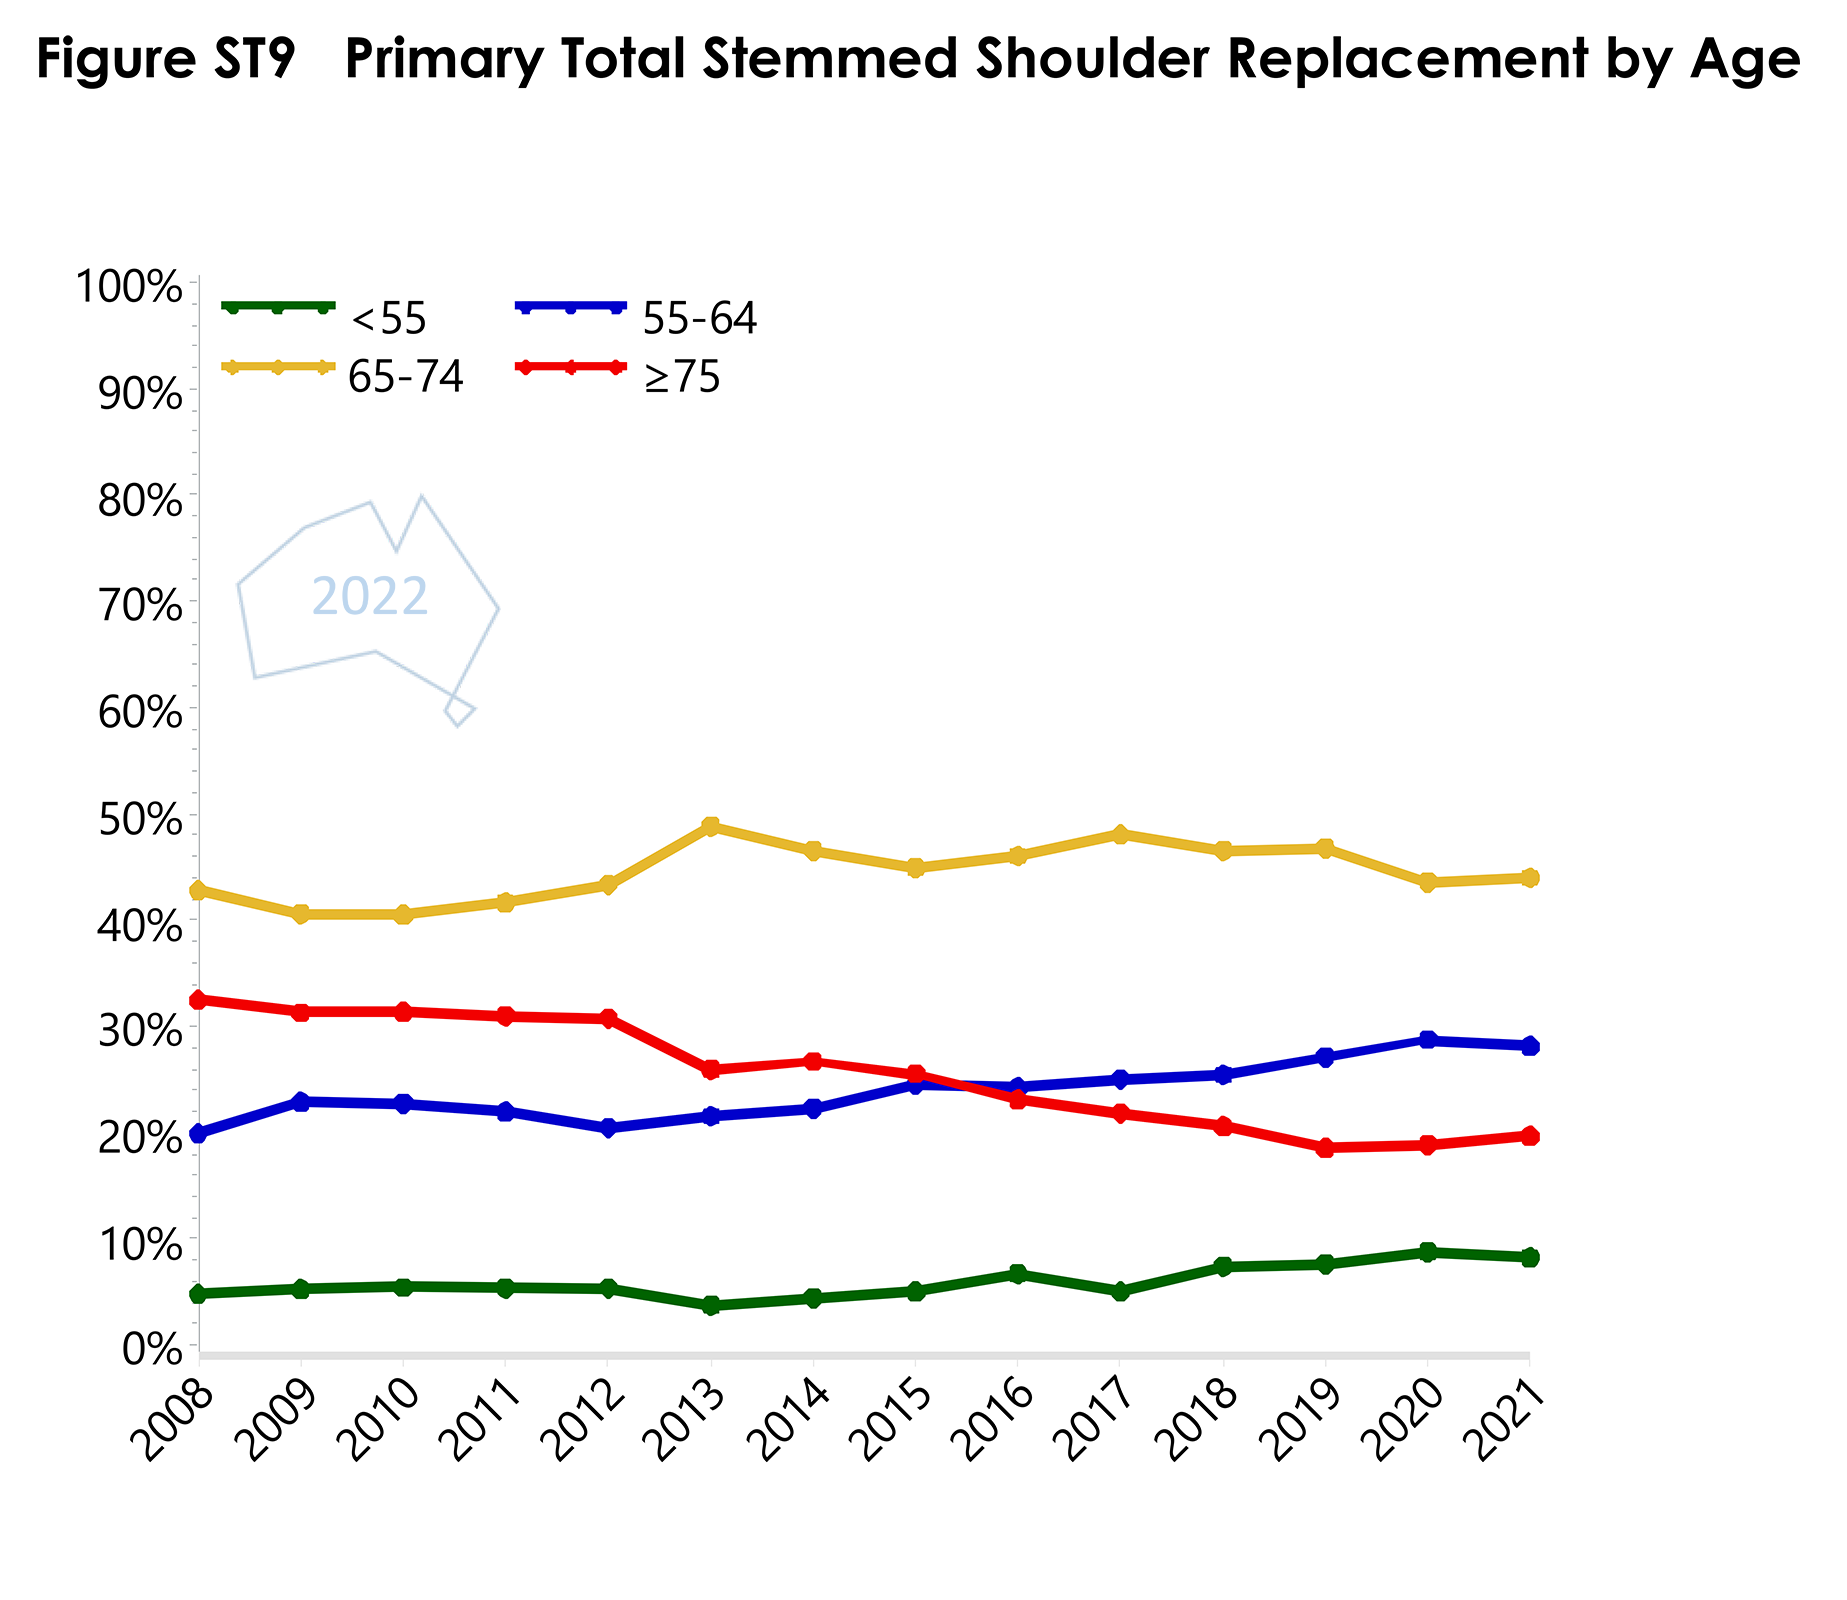
- Figure ST9 Primary Total Stemmed Shoulder Replacement by AgePDF · 42 KB
- Primary Total Shoulder Replacement by ClassPDF · 64 KB
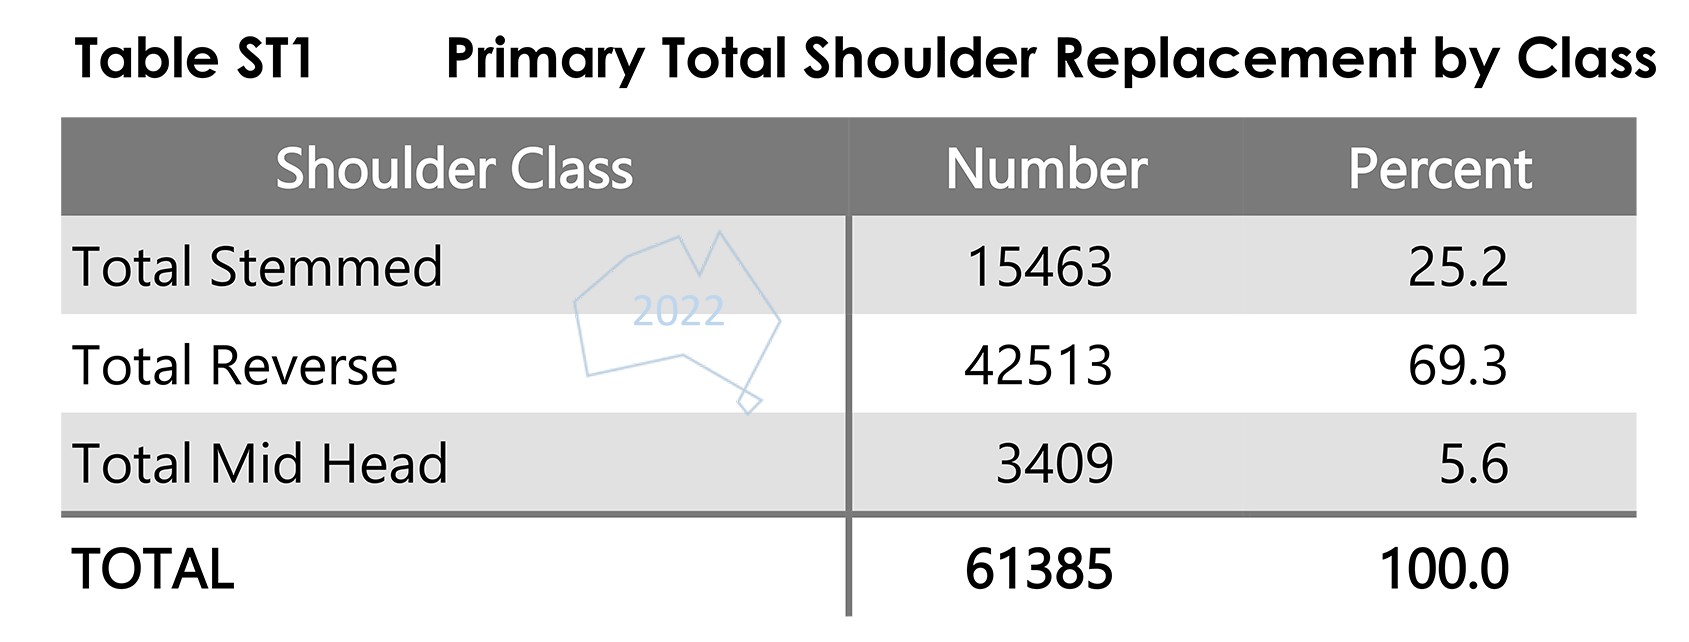
- Table ST1 Primary Total Shoulder Replacement by ClassPDF · 62 KB
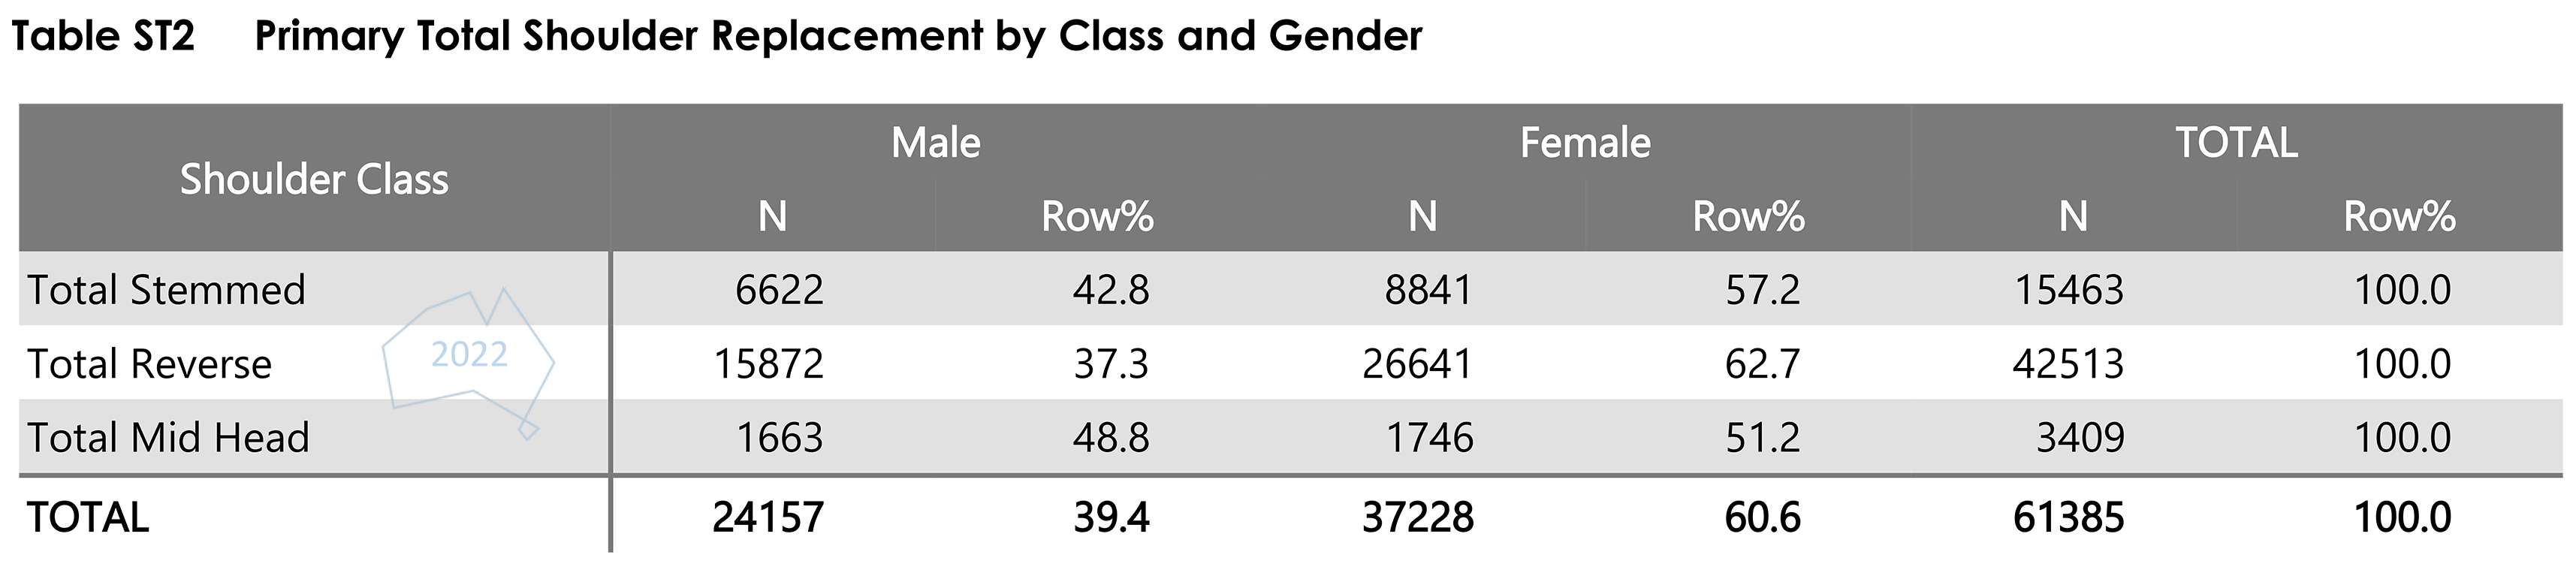
- Table ST2 Primary Total Shoulder Replacement by Class and GenderPDF · 45 KB
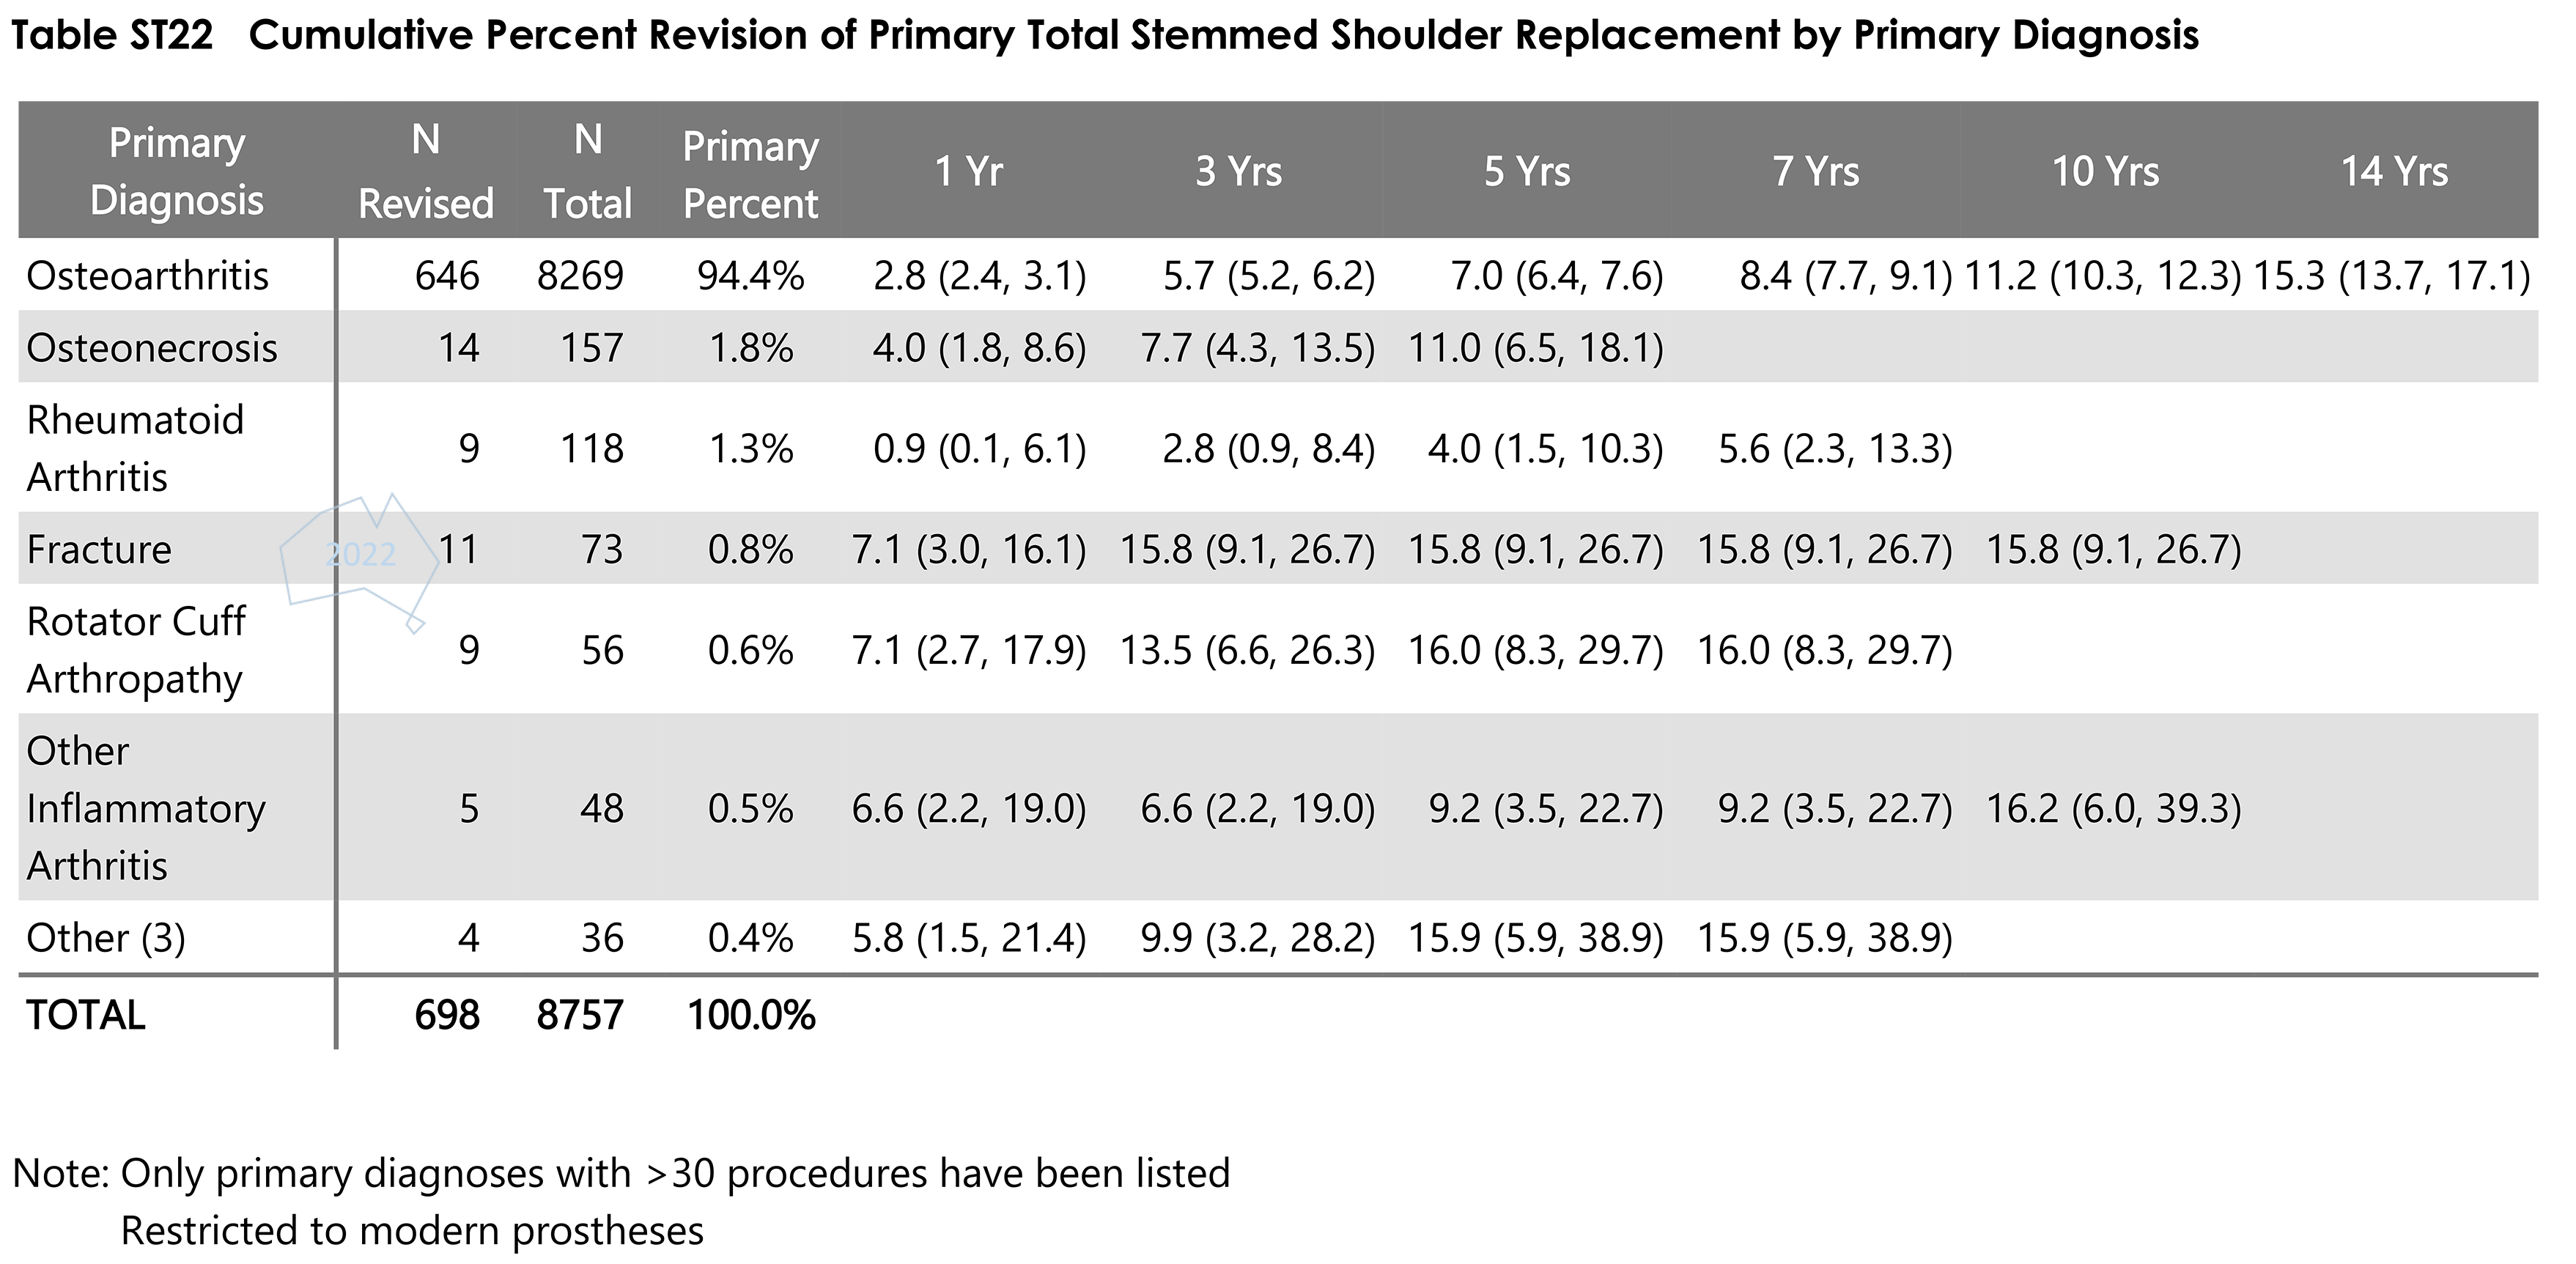
- Table ST22 Cumulative Percent Revision of Primary Total Stemmed Shoulder Replacement by Primary DiagnosisPDF · 56 KB
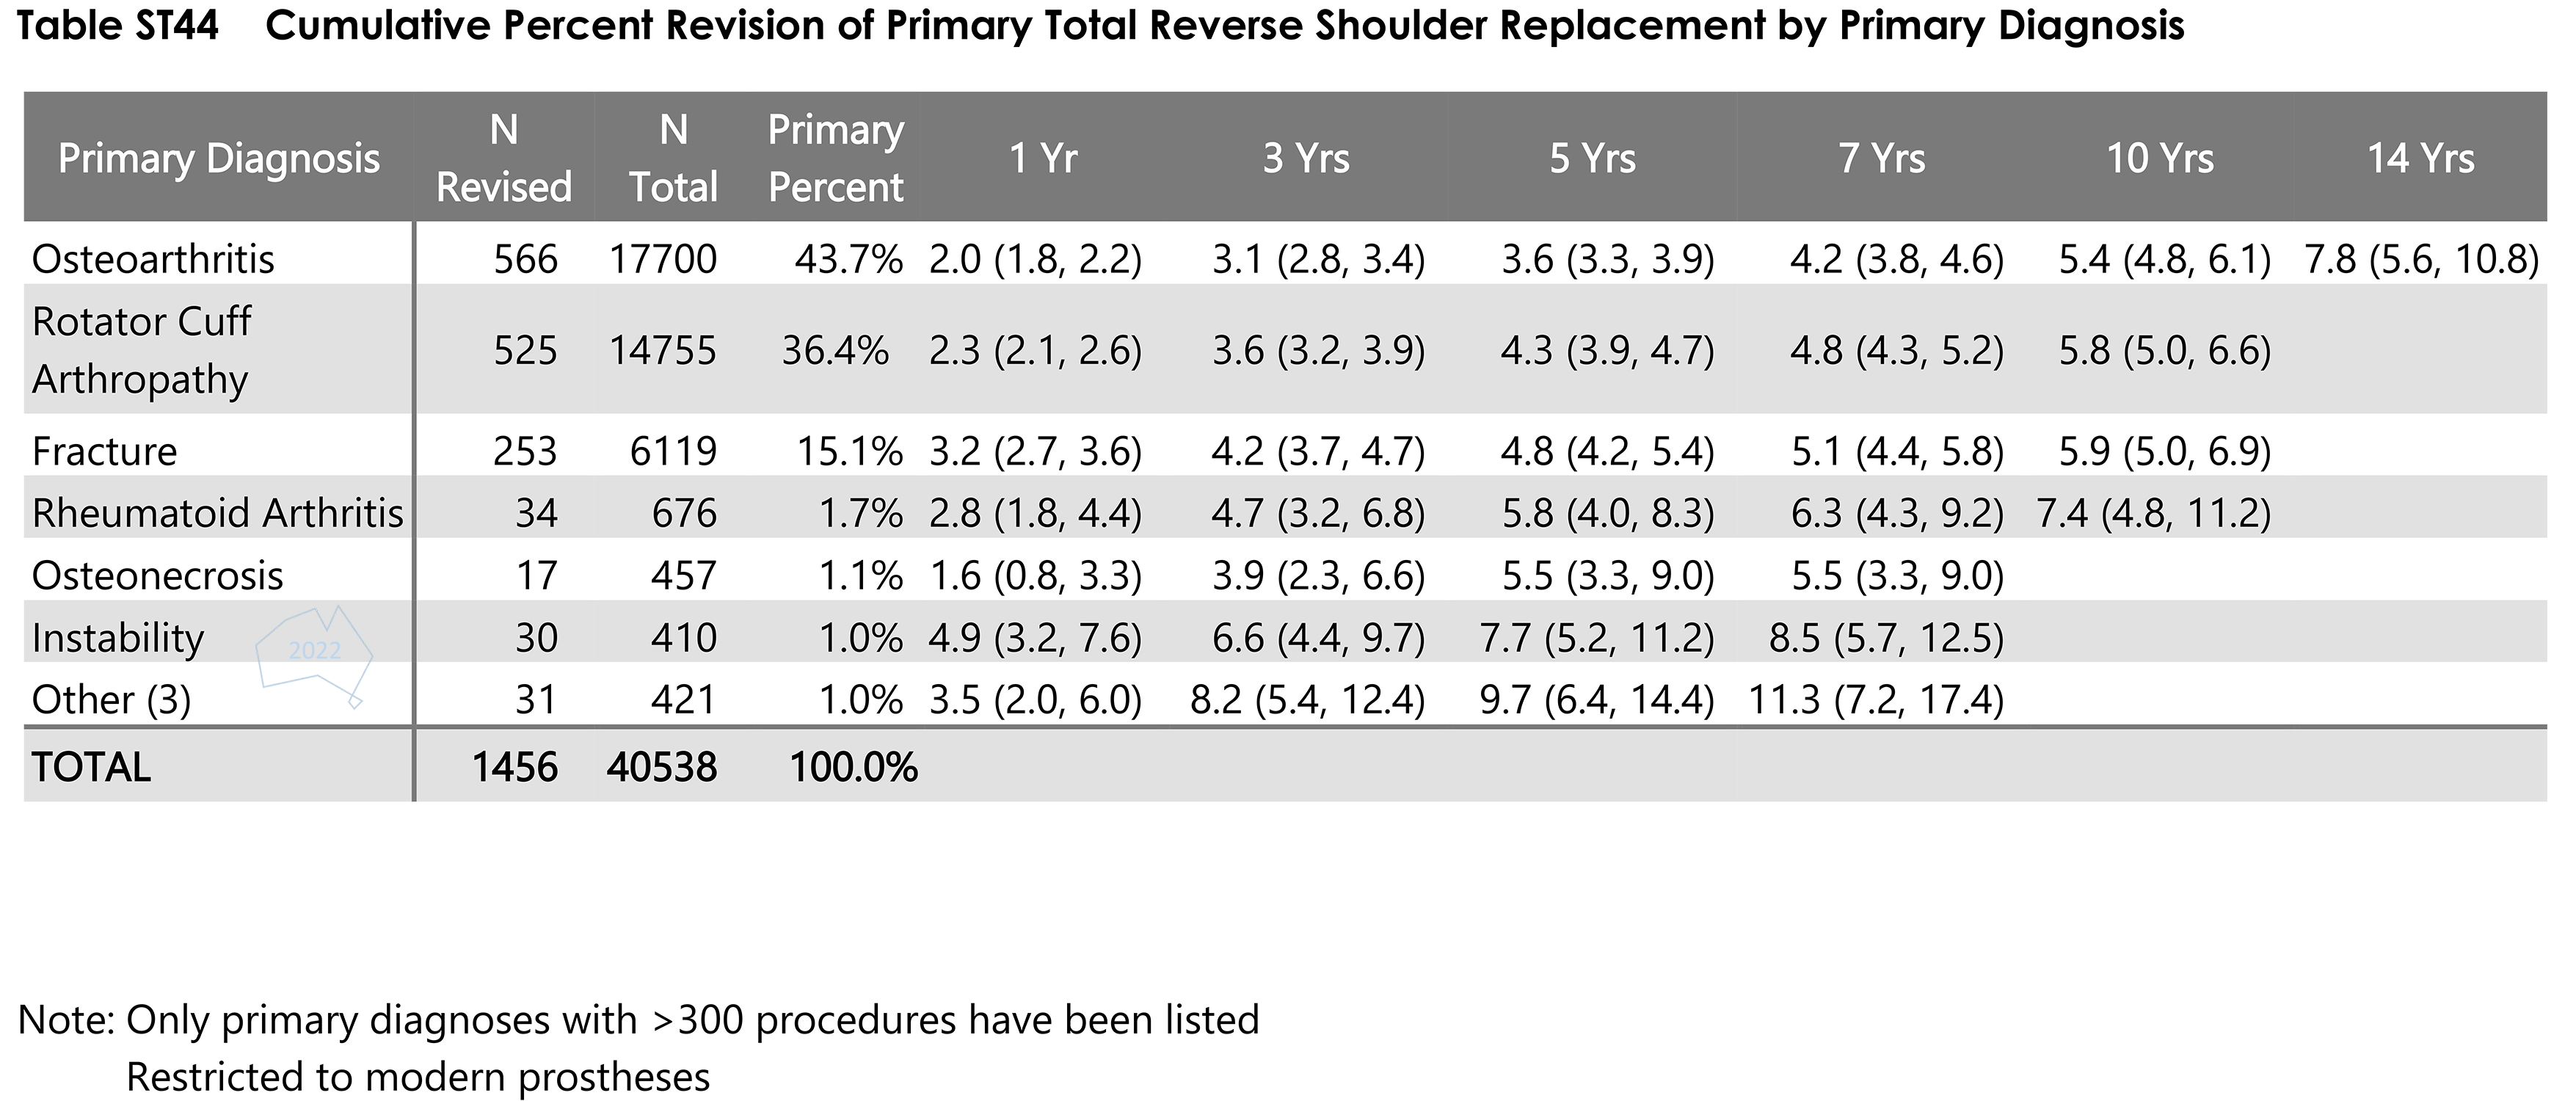
- Table ST44 Cumulative Percent Revision of Primary Total Reverse Shoulder Replacement by Primary DiagnosisPDF · 56 KB
PNG
- Figure ST10 Primary Total Stemmed Shoulder Replacement by Fixation copyPNG · 412 KB
- Figure ST11 Cumulative Percent Revision of Primary Total Stemmed Shoulder Replacement by Primary Diagnosis copyPNG · 726 KB
- Figure ST12 Cumulative Incidence Revision Diagnosis of Primary Total Stemmed Shoulder Replacement copyPNG · 441 KB
- Figure ST13 Cumulative Percent Revision of Primary Total Stemmed Shoulder Replacement by Age copyPNG · 696 KB
- Figure ST14 Cumulative Percent Revision of Primary Total Stemmed Shoulder Replacement by Gender copyPNG · 617 KB
- Figure ST15 Cumulative Percent Revision of Primary Total Stemmed Shoulder Replacement by ASA Score copyPNG · 670 KB
- Figure ST16 Cumulative Incidence Revision Diagnosis of Primary Total Stemmed Shoulder Replacement by ASA Score copyPNG · 859 KB
- Figure ST17 Cumulative Percent Revision of Primary Total Stemmed Shoulder Replacement by BMI Category copyPNG · 888 KB
- Figure ST18 Cumulative Incidence Revision Diagnosis of Primary Total Stemmed Shoulder Replacement by BMI Category copyPNG · 1.2 MB
- Figure ST19 Cumulative Percent Revision of Primary Total Stemmed Shoulder Replacement by Glenoid Morphology copyPNG · 616 KB
- Figure ST2 Cumulative Percent Revision of Primary Total Shoulder Replacement by ClassPNG · 799 KB
- Figure ST20 Cumulative Percent Revision of Primary Total Stemmed Shoulder Replacement by Fixation copyPNG · 826 KB
- Figure ST21 Cumulative Percent Revision of Primary Total Stemmed Shoulder Replacement by Glenoid Type copyPNG · 929 KB
- Figure ST22 Cumulative Percent Revision of All copyPNG · 599 KB
- Figure ST24 Cumulative Percent Revision of Primary Total Stemmed Shoulder Replacement using All Types of Glenoids by Polyethylene Type copyPNG · 633 KB
- Figure ST25 Cumulative Percent Revision of Primary Total Stemmed Shoulder Replacement Using Cemented All copyPNG · 624 KB
- Figure ST27 Cumulative Percent Revision of Primary Total Stemmed Shoulder Replacement by Humeral Head Size copyPNG · 729 KB
- Figure ST29 Primary Total Reverse Shoulder Replacement by Primary Diagnosis copyPNG · 425 KB
- Figure ST30Primary Total Reverse Shoulder Replacement by Gender copyPNG · 330 KB
- Figure ST33 Cumulative Percent Revision of Primary Total Reverse Shoulder Replacement by Primary Diagnosis copyPNG · 1.1 MB
- Figure ST34 Cumulative Incidence Revision Diagnosis of Primary Total Reverse Shoulder Replacement copyPNG · 447 KB
- Figure ST35 Cumulative Percent Revision of Primary Total Reverse Shoulder Replacement by Age copyPNG · 652 KB
- Figure ST36 Cumulative Percent Revision of Primary Total Reverse Shoulder Replacement by Gender copyPNG · 663 KB
- Figure ST37 Cumulative Incidence Revision Diagnosis of Primary Total Reverse Shoulder Replacement by Gender copyPNG · 590 KB
- Figure ST42 Cumulative Percent Revision of Primary Total Reverse Shoulder Replacement by Glenoid Morphology copyPNG · 701 KB
- Figure ST8 Primary Total Stemmed Shoulder Replacement by Gender copyPNG · 332 KB
- Figure ST9 Primary Total Stemmed Shoulder Replacement by Age copyPNG · 382 KB
- Primary Total Shoulder Replacement by Class copyPNG · 398 KB
- Table ST1 Primary Total Shoulder Replacement by Class copyPNG · 201 KB
- Table ST2 Primary Total Shoulder Replacement by Class and Gender copyPNG · 381 KB
- Table ST22 Cumulative Percent Revision of Primary Total Stemmed Shoulder Replacement by Primary Diagnosis copyPNG · 927 KB
- Table ST44 Cumulative Percent Revision of Primary Total Reverse Shoulder Replacement by Primary Diagnosis copyPNG · 735 KB